In the 1990s, a new industry was created in Australia. It produced nothing. But it…
Australian government satisfied with failure
Only a short blog post today as it is Wednesday and I reserve most of the day for other writing (book manuscripts etc). What follows is some analysis I provide to several Australian journalists to help them get the arguments right when it comes to the political spin that the politicians try to pump out. Australia’s Prime Minister has been making a big deal that “Over the last five years we’ve delivered more than a million jobs” and yesterday, as we lead into the election cycle (due in May) he said that the Federal government aimed “to see 1.25 million jobs created over the next five years”. Should we cheer or cry? Many economists who have offered commentary over the last 24 hours seem to think we should be happy with that goal. Me, I think it is about half as many new (net) jobs that are required given the state of the labour market and signals a failed policy strategy. Here is why I think that.
Some basic facts
1. The current conservative government was first elected in September 2013.
2. From December 2013 to December 2018 (5 years), the net change in total employment was 1,298.3 thousand (774.0 full-time jobs and 524.3 part-time jobs).
3. In December 2013, the part-time to total employment ratio was 30.8 per cent. By December 2018, it has risen to 31.7 per cent.
4. Over that period, the change in the underlying working age population was 1564.3 thousand and the change in the labour force was 1249.0 thousand.
5. So total unemployment fell by 49.3 thousand as a result of the employment change being larger than the additions to the labour force.
6. The unemployment rate fell from 5.9 per cent to 5 per cent.
7. The participation rate rose by 1.2 percentage points.
So on the face of it, the growth in employment allowed for a modest fall in the unemployment rate as the additional jobs outpaced the growth on the supply side of the labour market.
But it was a very modest period of employment growth indeed.
Politicians like to claim that “employment is at record levels”. While that might be a virtuous state, it usually turns out that it just means that the total working age population (above 16 years) is also at ‘record’ levels.
So the statement “employment at record levels” is, when taken at face value, somewhat vacuous no matter how good it sounds.
The related claim “we’ve delivered more than a million jobs” is also vacuous unless you benchmark it against some scale variable.
That is why economists use the ratios like the Employment to Population ratio.
Over the period in question, the Employment to Population ratio rose by 1.7 percentage points.
You might then conclude that I am being over-critical of the government when I suggest that this data points to a failed policy strategy and they should not be celebrating their achievements at all.
So, how to I come to that conclusion?
We also have to consider the state of the cycle
The current conservative government came to power in a mid-cycle period.
The fact is that we are in a cycle that began after the peak of February 2008, just as the GFC began.
Sure enough, the period from December 2013 to December 2018 (5 years) broadly covers the current tenure of this particular government.
But when they came to power, the labour market was still adjusting to the crisis and was far from full employment.
It is better to appraise where policy has taken us relative to the last peak, rather than the labour market state 5 years ago.
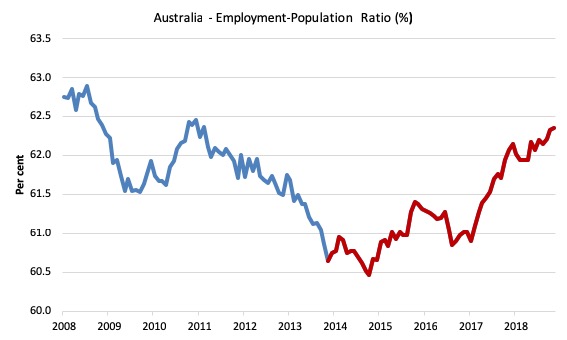
Consider the following graph, which shows the Employment-Population ratio from February 2008 to December 2018. The red segment is the 5-year period from December 2013.
The brief history is that the previous Labor government that was in power at the time the GFC hit introduced a relatively sizeable fiscal stimulus package which reversed the slowdown.
By 2011, it was panicking and claiming it had to quickly restore a fiscal surplus (it was under attack from all sorts of mindless commentators and mainstream economists who clearly don’t understand these matters) and it reversed the stimulus.
The economy slowed dramatically as a result and the EPOP ratio fell steadily as employment growth tanked.
When the current conservative government came to office, it initially promised to push the austerity level up further.
The first few months of its attempt to do that caused the labour market to head towards collapse (the last few months of the blue segment).
They then backtracked a little and adopted a pragmatic stance and the labour market slowly started to improve, albeit at a slow rate (the red segment).
Compared to the previous peak (February 2008), the EPOP ratio is still 0.4 percentage points short. If we considered that in terms of the current working age population, that means that Australia is 81 thousand jobs short of where it would be if the EPOP ratio was back to its previous peak.
Now consider the other side of the labour market – the labour underutilisation.
Facts:
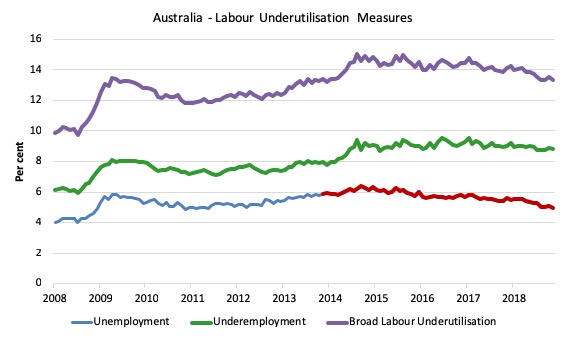
1. At the peak of the previous cycle (February 2008), the national unemployment rate was 4 per cent.
2. Underemployment (part-time workers wanting more hours of work) was at 6.2 per cent.
3. Taken together, the Broad labour underutilisation rate was 9.9 per cent (and it fell to 9.7 per cent in August 2008).
4. In December 2013 (the start of the 5-year period), the unemployment rate was per cent; 5.9 per cent, underemployment was at 8 per cent and the broad labour underutilisation rate was 13.4 per cent.
5. By December 2018, underemployment has risen to 8.8 per cent and the broad labour underutilisation rate is at 13.3 per cent.
The following graph shows the evolution of these aggregates since February 2008 to December 2013. The red segment just marks the period since December 2013.
Conclusions:
The ‘1 million jobs’ narrative fails because:
1. Total labour wastage is now largely unchanged from what it was at the start of the five year period.
2. But it is 3.4 points higher than it was when this cycle began in February 2008.
3. While unemployment has fallen over the last 5 years (by 49.3 thousand) it is still 225.3 thousand higher than it was in February 2008 and the unemployment rate is still 1 percentage point higher.
4. Underemployment is now higher by 0.8 points than it was in December 2013 and 2.6 points higher than it was in February 2008.
In other words, given the timing of the cycle when the current government took offiec, it had to put in place policies that would have supported much stronger employment growth than it did to wipe out the accumulated labour wastage that occurred over the course of the cycle to that point.
It failed to do that.
There is massive excess capacity in the Australian labour market. 1.25 million (net) jobs
No gain in unemployment rate
Finally, if employment was to increase in net terms by 1.25 million between now and December 2023, and the labour force grew by its average growth rate between January 2000 and December 2018, then the unemployment rate would be 5 per cent.
In other words, the Government is pleasing itself that its policies will yield no further reduction in the unemployment rate despite it being at elevated levels compared to February 2008.
It is also clear that the broader measures of labour underutilisation (underemployment etc) would remain at elevated levels.
That sounds like a policy failure to me.
This song still resonates 50 odd years later
I first heard this song – I’ll Be Long Gone – at a movie when I was wanting to be a soul/R&B guitar player in the early 1970s.
The song appeared on his second self-titled album from 1969 – Boz Scaggs, which was recorded in the famous Muscle Shoals Sound Recorders studio in Alabama.
Before he put his own band together, Boz Scaggs had played with the fabulous Steve Miller Band, another great West Coast addition to the world of music.
It was released in August 1969 and I bought it at one of Melbourne’s Import Shops, sometime in 1970, given the delay in getting to Australia. It has been played a lot since.
The backing band – The Muscle Shoals Rhythm Section (the Swampers) – is an all-star cast of genius players.
You can also see a live version (with his own band) which was recorded on June 30, 1971 at Fillmore West, San Francisco.
It appears on the album – Live At The Fillmore West 30th June 1971 – which is a bootleg release (and it sounds like it) on the Keyhole Label (released 4/1/2014).
The recording is not great but the feel is.
This was night one of the last week of the Fillmore West venue and Boz Scaggs and his band were a regular act at the Fillmore West venue during the heady times that led up to the closure.
Unfortunately, some time after this period, Boz Scaggs decided to become a disco pop singer and he lost my interest.
That is enough for today!
(c) Copyright 2019 William Mitchell. All Rights Reserved.
Aw come on, Silk Degrees has to be one of the most unique and interesting albums of all time (and very much in the style and feel of the song you’ve linked).
And during the term of this awful government the lives of the unemployed living on the meagre unemployment benefit, enduring all the sociopathic demands of the job service providers and perhaps being caught by the robo-debt fraud, has been extremely cruel. The incomes of most of the employed have stagnated, permanent jobs have declined whilst the cost of living, especially housing and utility bills have increased markedly. Corporate profits, especially for the major banks are doing very nicely.