Today (January 22, 2026), the Australian Bureau of Statistics (ABS) released the latest labour force…
British labour market – rise in self-employment driving growth
The British Office of National Statistics (ONS) published its latest labour market data last week (January 22, 2019) – UK labour market: January 2019. Employment continues to increase, unemployment is steady and inactivity is falling (participation is rising). Real wages are also finally starting to rise (average weekly earnings rose by 3.3 per cent over the last 12 months) after a decade of flat wages growth. The ONS say that the 4 per cent unemployment rate “has not been lower since December 1974 to February 1975”. But the labour market of 2019 is very different to that of late 1974. While the growth in real wages is a positive development, the large negative is that employment for employees fall in the three months to November 2018 and all the employment growth was taken by self-employed. The other disturbing statistic is that if we considered the involuntary part-time workers to be equivalent to the unemployed, then the adjusted unemployment rate would be around 6.6 per cent, a far cry from full employment.
Employment – at record levels
The data covers the three months to November 2018 (so it is not the 4th quarter). I will refer to it as the November-quarter.
The heading reflects the sort of statements that politicians make. In this case it is true. Total employment in the November-quarter was 32,535 thousand and it has never been higher.
But then the total working age population (above 16 years) was 53,169 thousand and that has never been higher.
So the statement “employment at record levels” is somewhat vacuous no matter how good it sounds.
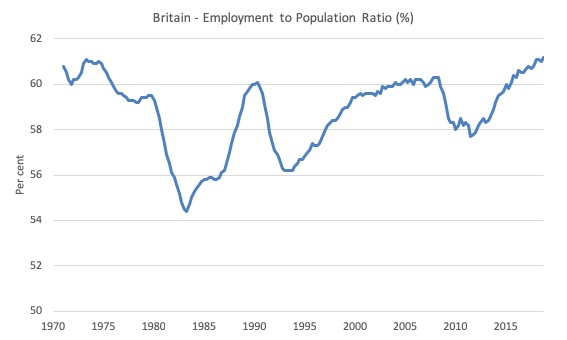
We are better off considering rates and the Employment to Population ratio shown in the next graph is at levels not witnessed since the November-quarter 1973, just before the OPEC oil crises hit.
The ratio is now at 61.2 per cent and was at 61.1 per cent in June 1973.
So relative to the working age population, employment is now at record levels.
Part-time, self-employed and temporary workers
The data also shows that the proportion of workers who are now in part-time positions has risen from 23.5 per cent in the June-quarter 1992 to 26.2 per cent in the November-quarter 2018 – not a significant shift.
There has also not been much change in the proportion of workers working second jobs over that period (3.72 per cent down to 3.42 per cent) and there has been a decline in the proportion of temporary employees as a percent of all employees (5.9 per cent down to 5.7 per cent).
Further, contrary to popular perception, the proportion of total workers who are self-employed has only marginally increased over this 26 year period – 13.6 per cent in the June-quarter 1992 to 14.9 per cent in the November-quarter 2018. This ratio has actually fallen since mid-2016.
But of those, the proportion of self-employed who are working part-time has risen from 17.6 per cent in the June-quarter 1992 to 30.1 per cent in the November-quarter 2018 – a large shift and likely to be hiding a significant shortfall in labour demand as people eke out a working life as best they can.
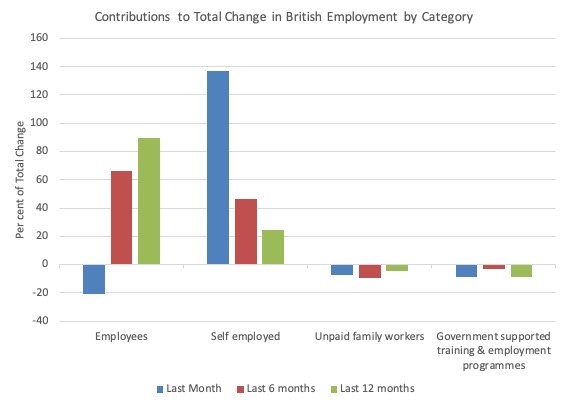
Moreover, the recent employment gains in Britain are overwhelmingly accounted for by a rise in self-employment.
The following graph shows the proportions of total employment change accounted for by the four categories for which ONS provide data (employees, self-employed, unpaid family workers, and those on government supported training programs).
Over the last 12 months, total employment has risen by 327.7 thousand and 89.2 per cent of that has been accounted for by jobs for employees (24.6 per cent to the self-employed).
However, over the last 6 months, total employment has risen by 136 thousand and 66 per cent of that has been accounted for by jobs for employees (46.7 per cent to the self-employed).
The stark shift that is going on is highlighted in shifts in the last month.
Total employment rose by 58.9 thousand and employees lost 12.1 thousand jobs while the self-employed added 80.5 thousand jobs.
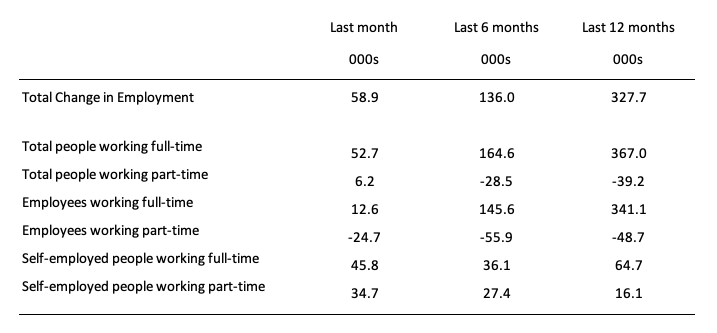
Of those changes, the following Table provides more insights.
It shows that overall, part-time employment has fallen over the last 12 months. The falls have been confined to employees who have overwhelmingly been able to gain full-time work.
For self-employed workers, there also has been a bias towards full-time work accession.
Zero hour contracts
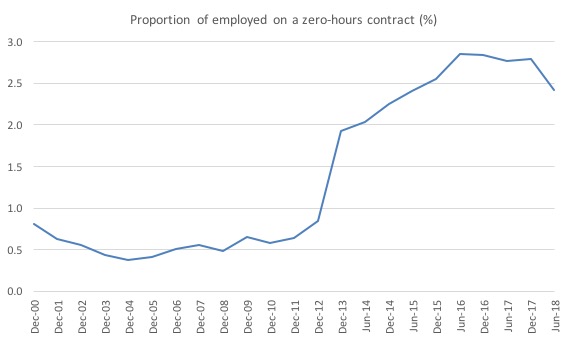
The ONS data – EMP17: People in employment on zero hours contracts (Last updated: August 14, 2018) shows that the proportion of workers in this state has risen from 0.8 per cent of all workers in the December-quarter 2000 to a peak of 2.8 per cent in the December-quarter 2017.
In the first six months of 2018, the proportion has dropped to 2.4 per cent.
The following graph shows the history.
Unemployment rate down to early 1970 levels
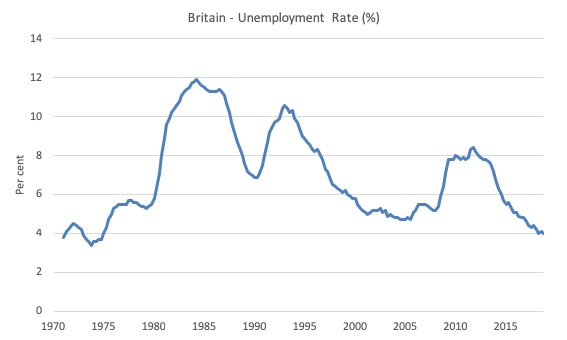
The next graph shows the official unemployment rate from the first-quarter 1971 to the November-quarter 2018. It was 4 per cent in the most recent quarter (down from 4.1 per cent in the September-quarter).
It was last at that level in the March-quarter 1975, just before the then Labour government declared Keynesian economics was dead!
So on this aggregate Britain is performing well and there are no hints that the Brexit referendum has altered the steady fall in official unemployment since the most recent peak in the December-quarter 2011.
Hours worked – steady
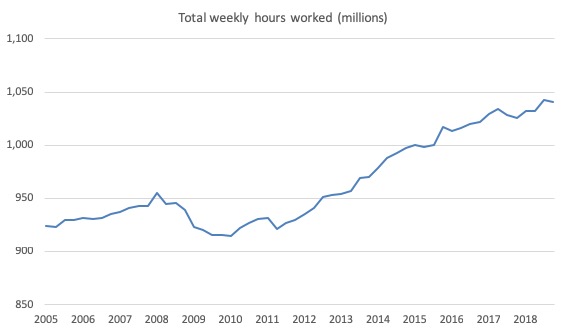
The next graph shows the total weekly hours worked in Britain (in millions of hours) from the March-quarter 2005 to the November-quarter 2018.
Since the pre-GFC peak, hours worked have only grown by a total of 9 per cent overall and only 1 per cent since the end of 2016.
In the November-quarter 2018, there was a 0.2 point decline in hours worked recorded.
Real earnings now growing
Up until recent months, the earnings statistics were telling us that the labour market was not as strong as the narrow aggregates (such as the official unemployment rate and total employment) might suggest.
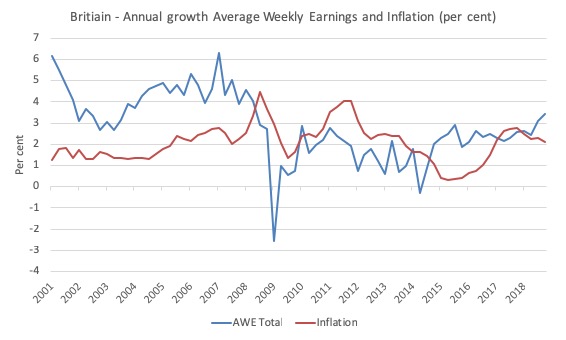
However, since July 2018, average weekly earnings have grown at an annual rate faster than the CPI inflation, resulting in real earnings growth.
In November, total average weekly earnings (excluding bonuses) grew at an annual rate of 3.2 per cent whereas the annual CPI inflation rate was 2.2 per cent.
Adding in bonuses shows that the real pay of workers rose by 1.1 per cent in November.
The next graph shows the annual growth in average weekly earnings and the CPI inflation rate from March 2001 to November 2018.
There are some positive signs emerging that workers are now gaining some of the productivity growth in Britain for the first time in a while.
Underemployment
The latest ONS estimates of – EMP16: Underemployment and overemployment – were published on November 13, 2018.
Underemployment refers to part-time workers who desire more hours of work.
Remember, that to be classified as officially employment, a person only has to work 1 or more hours a week.
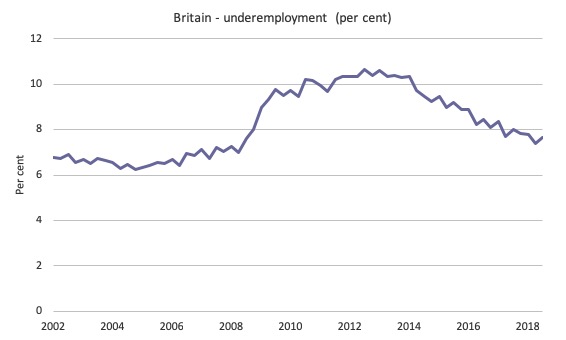
The following graph shows the evolution of the underemployment rate from the March-quarter 2002 to the November-quarter2018.
While its trajectory is downwards, the current rate of 7.7 per cent remains well above the pre-GFC level of 7 per cent (November-quarter 2008).
In the three months to September 2018, underemployment rose by 0.3 points.
But we have to see this in a longer-term perspective.
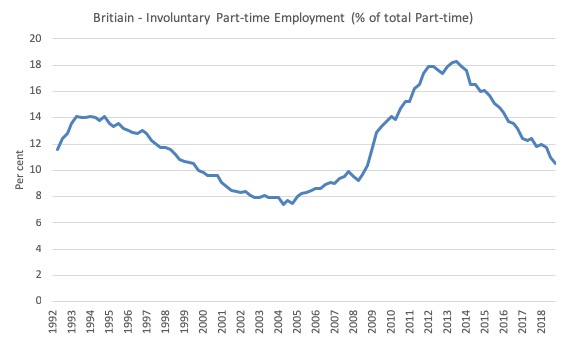
The following graph shows that the rate of involuntary part-time work has risen significantly since before the GFC.
In the June-quarter 2004, this proportion (involuntary part-time to total part-time workers) was 7.4 per cent (533 thousand).
By the November-quarter 2018, the proportion remains at 10.5 per cent (881 thousand), which indicates that the labour market still is some distance from full employment.
This means that there are still 881 thousand British workers who desire full-time work but cannot find it.
If we consider that in hours-terms, the amount of labour wastage is quite stark.
The data shows that part-time workers are working on average 16.3 hours per week.
Full-time workers are on average working 37.1 hours per week.
So if those 881 thousand workers were to gain full-time employment at average hours, there would be an additional 494 thousand full-time equivalent jobs in Britain.
At the current labour force level, that would generate an unemployment rate of 2.6 per cent.
The alternative way of thinking about that is to consider the wasted hours as being commensurate with unemployment.
If we then adjusted the unemployment rate to include that component of part-time work that is involuntary we would get an unemployment rate of 6.6 per cent rather than 4 per cent.
That should present a more sober picture of the British labour market.
Conclusion
The evidence is fairly consistent across a range of measures that, in aggregate terms, the British labour has improved markedly over the last 5 years.
Employment growth is strong and has accelerated since mid-2016.
But underlying that growth are some disturbing trends – like the rise in zero hours contracts and the increasing proportion of self-employed who are working part-time and likely to be underemployed.
More recently, the growth in employment has been marked by an absolute decline in employee jobs and a total dominance of self-employment growth.
The one bright sign is that real wages have started to grow after a period of cuts.
Whether that positive trend is maintained into the Northern winter remains to be seen.
That is enough for today!
(c) Copyright 2018 William Mitchell. All Rights Reserved.
Some good analysis there.
There’s a couple of comments i’d like to add:
Firstly i’m sure you’re aware there have been court cases surrounding what constitutes ‘self-employed’ in the UK, most notably Pimlico Plumbers and Uber. Companies routinely abuse this status to save them having to offer the employment rights of an employee ‘on the books’.
Secondly, is there any data on the other type of underemployment? That is workers who are grossly overqualified for their current employment. Eg Graduates working in pubs etc. I’d suggest that’s a major issue as well and reflects the low-skill nature of the UK jobs market.
Bill,
I do not believe pay rise data for the self employed in the UK as they are poorly recorded by HMG agencies. Like UK inflation indexes overall pay data appear to be manipulated to give the required output.
Regards
Ian McKay – the other attraction of self-employed or ‘consultant’ staff to employers is that, for such workers, they don’t have to pay employers’ nation insurance contributions (this is 13.8% of the salary amount over an allowance) nor do they have to bother with the new compulsory pension schemes.
And then there are the mental health problems that current working practices are producing. Such as extreme bullying. There was bullying previously, but it has increased in intensity and frequency during the neoliberal era. And bullies tend not to be moved, which they were before, well 40 years before.
Yorkshire Water has decided to train their some of their work force to sort of be councellors so that they can spot mental health problems in order that they can be dealt with before there needs to be a consultant referral to someone who is actually trained to deal with mental health problems. A truly neoliberal solution for what is a serious and seemingly increasing problem.
Then there are those who have been asked to take on jobs that used to be done by two or three people. These workers don’t feel that they can refuse, so Darconian are some working environments. A not insignificant number of them develop mental health problems.Quelle surprise.
The Brexit referendum may not have had much of an effect, but I would not expect that it would, as most businesses seem to have been waiting to see what sort of ‘deal’ the government was going to produce. Now that they are getting an idea, we can wait and see. Tesco’s has already decided to close their fresh meat and fish deli counters with the consequent loss of some 15k jobs. Staff canteens are also to be replaced by vending machines. This is neoliberalism at its best. Brexit is only one of the factors here. It may be surmised, however, that it may not prove to be insignificant.
Neoliberalism, however, is not responsible for shops stocking fewer products, some of the shelves being partially empty, and choice being significantly reduced. At least, in parts of the north.
I commend Prof Bill Mitchell for his great contributions to reality economics by his research and work on MMT and the Job Guarantee.
This is how a Nations Economy should be run, for the benefit of its people.
Unfortunately the Credit Creation process has been captured and privatised since the first Central Bank was established as the Bank of England by a Scotsman William Paterson in 1694.
Since then the vested interests of the Financial and Banking system have captured the political and Treasury Dept of many countries.
They will not allow an MMT System to disrupt their extraordinary privilege of control over credit creation and the economies reliant on that credit.
Germany has solved that problem over a hundred years ago by the establishment of small non-profit community banks ,such as Sparkasse, dealing only with local SME\’s.
There are at present approx. 1500 such community banks in Germany.
Germany\’s success as an Industrial powerhouse is directly linked to the SME\’s availability of credit from these small local community banks. The SME\’s are also the biggest employer.
This system of local bank credit creation, while not fiscal as MMT is a route to more equitable wealth distribution via employment and a means to direct investment to Industrial wealth producing manufacture.
It is estimated that over 80% of the credit creation of the 5 main British banks goes to Finance Capitalism ie FIRE sector., with just 4% to Industrial development.
Germany invests over 70% of its credit creation in Industrial development.
The ECB has recognised the threat to its monopoly position by community banks ,and has begun a process to eliminate them and credit unions by the imposition of onerous regulatory processes.
This is another good reason for Brexit.
Correction:
I meant to say that neoliberalism is not solely responsible for reductions in product choice and stocking decisions, as this is fairly recent in certain respects. Both factors, neoliberalism and Brexit chaos, could be said to be interacting here to produce a convergent result.
Does anyone know of any research or a clear layman’s description of the interaction of in work benefits with part time self employment in the UK? In particular working tax credits. A graph of UK spending on in work benefits over time would be useful. There must have been some work done on this prior to the roll out of universal credit.
When the definition of the word “employment” has been so diluted by neoliberalism that it now includes gig jobs, temp jobs, part-time jobs, zero-hour jobs, etc.–and working only one hour per week in such a job is sufficient to put one in the “employed” column–it strikes me that we need improved terminology to accurately assess how well the economy is meeting the basic human need to earn a living. What if a group of economists, interested in exploring quality as well as quantity, created a new category called adequate or meaningful or substantive employment, which would require the opportunity to work full-time with decent pay and benefits and with a reasonable expectation of job security? That’s what “employment” generally meant when I was a young man in the states, and I’d be very interested in knowing how many people today are “employed” in this sense both there and elsewhere.
I agree with Newton on this. It is time for labor economists to push meaningful/substantive employment as the default term, something that can grab the average person. The others could be lumped under some passable equivalent for shit employment. We obviously can’t use this term, however much I would love to.
It could be that the word “substantive”, in relation to employment has become historic for some. At the gym this morning there were quite a few old-dears who, having to work past the former pension age of 60, prefer part-time employment these days.
In fact the gym car park bore testament to the number of people who don’t work 9-5 nowadays – and monthly gym subscriptions are not that cheap, either. And you won’t catch me arguing with these muscular women over the few bikes that are unclaimed.
The forecast this week is for snow – I wonder if my small neighborhood squad of construction agency workers expect to get paid if they fail to turn up at a site 50 miles away, (like you would expect full-time employees to). I do suspect they know of their holiday entitlements etc, however – though some agency workers suffer in ignorance of these.
The Resolution Foundation (https://www.resolutionfoundation.org/publications/the-good-the-bad-and-the-ugly-the-experience-of-agency-workers-and-the-policy-response/) published a paper on 30th November 2018 entitled The good, The bad and The ugly which highlights the downside of much agency work (low grade and comparatively low paid, for instance).
In a way Larry highlights this by referring to the plight of Tesco workers, who now face an uncertain future in a sector that is being crushed by consumer and technological changes. In recent times food has become readily available in enticing pre-packaged format, defeating the purpose of in-house preparation.
The problem for governments is to identify changes across a whole swathe of sectors and adjust policy in time to avoid employment upheavals – an almost impossible task. But in Tesco’s case, Larry, we need to be wary of where our sympathies lie – Bill is a fully paid-up vegan.
Larry & Newton – Is there any reason why Underemployment does not show what you are talking about?
Matt, certain data tables organize data in accordance with our and additional categories, but they are not thereby as attention grabbing as some would like. Groupings need to be added akin to the ones we suggest above to garner this attention, say. Care must be taken so that theoretical objectives of the Labour economist are not impeded. Such data is organized in matrix form. Bill has used them before. Does this make sense to you?
Matt, my guess would be that the current unemployment rate in America, for example, if the analysis were limited to good steady jobs with decent pay and benefits (the kinds of jobs prevalent in the America of my youth), would be a SHOCKINGLY high number, one that would stick indelibly in people’s minds, as opposed to trying to ferret out so-called underemployment information from a maze of statistics. If we’re to mobilize the masses struggling under neoliberal austerity, and reclaim a progressive state as Bill and Tom urge us to do, then I believe we need these kinds of startling, unflinching numbers that speak loudly and clearly all by themselves.
I’ve always thought that housing costs should somehow be brought to bear on wage statistics as shifts in housing costs revalue the real wage.
The rise in housing costs are not uniform, of course, so there would have to be a way of representing this. I don’t have the skills in statistics to do this but I’m sure one could measure the impact.
Talking about wage rise without factoring in housing costs must give a skewed picture.
I would have thought that one could graph the impact of housing costs and also show the flow of financial assets from wages to those siphoning off these costs. This wealth transfer is vital to see what is going on in the UK.
I probably nee a three year intensive econometrics course!