The recent extreme weather in the northern hemisphere, the twin monster tropical storms in Japan,…
Bias toward low-wage job creation in the US continues
Last Friday (June 6, 2016), the US Bureau of Labor Statistics (BLS) released the latest – Employment Situation Summary – May 2016. I analysed that data release in this blog – The US labour market continues to weaken. The message from the data is that while the unemployment fell to 4.7 per cent, employment growth is virtually non-existant and the unemployment rate fell to 4.7 per cent only because the participation rate fell by 0.2 percentage points (in other words, hidden unemployment rose as people dropped out of the labour force). The sharp slowdown now evident in the US labour market has meant that the US Federal Reserve Bank will have to rethink their so-called interest rate normalisation strategy. In the downturn that began in January 2008, there were 8.7 millions jobs lost (up to December 2009) and 86 per cent of them were in sectors that paid above average weekly earnings. Since the recovery began in January 2009, the US labour market has added 14.1 million jobs (in net terms). The question this blog explores is whether these jobs have been predominantly low paid jobs or not. I found that the jobs lost in low-pay sectors in the downturn have more than been offset by jobs added in these sectors in the upturn. However, the massive number of jobs lost in above-average paying sectors have not yet been recovered in the upturn and do not look like being so, given the labour market is slowing again. In other words there is a bias in employment generation towards sectors that on average pay below average weekly earnings.
Is there a bias towards low-pays jobs in the recovery in the US?
That question cannot be immediately answered from the summary report provided by the BLS and needs further analysis (and lots of data manipulation).
But while updating all my datasets for the US labour market this week, I did the calculations necessary to answer the question: Is there a bias towards low-pays jobs in the recovery in the US?
Answer: clearly!
Effectively, since the recovery began in January 2009, there have been 14,120 thousand net jobs added to the US labour market (in the non-farm sector).
Of those net employment additions, 28.3 per cent have been what might be considered low-pay, where that is defined as less than 75 per cent of average weekly earnings.
Previously, I have calculated what happened in the downturn with respect to the jobs lost in net terms and their pay characteristics (at a sectoral level).
Please read my blog – US jobs recovery biased towards low-pay jobs – for more discussion on this point.
Peak US non-farm employment occurred in January 2008 (138,432 thousand) and the trough occurred in December 2009 (129,774 thousand).
Using the top-level North American Industry Classification System (2012 NAICS), we can calculate that:
1. Since the trough (December 2009), total non-farm employment has grown by 14,120 thousand with:
2. Total private employment has grown by 14,513 thousand.
3. Government employment has fallen 393,000 after growing by 94,000 during the peak-trough period (January 2008 to December 2009).
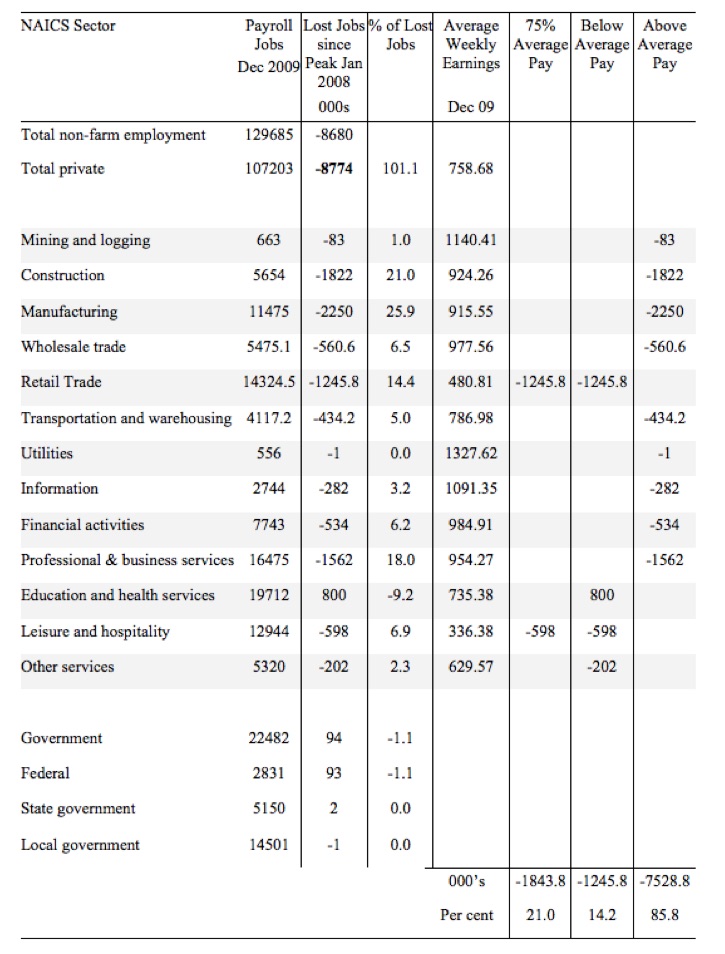
The following table summarises what happened in the Peak-trough period.
The first column shows the NAICS sector with the first two rows summarising relevant totals. Total non-farm employment is the sum of total private employment plus Government employment.
The second column shows the total employment in each sector as at December 2009, which was the trough of the downturn following the peak in January 2008.
The third column shows the lost jobs (in thousands) between the Peak and the Trough (these are net losses). So overall 8.7 million jobs were lost – with 8.8 million lost in the private sector and they were only partially offset by the 94,000 net jobs added in the government sector.
The next column shows the percentage of those lost jobs per sector, which allows you to see where the downturn impacted mostly. The next column shows average weekly earnings as at December 2009 in US dollars.
The final three columns then distribute the jobs lost according to whether the sector pays 75 per cent or less than average pay, below average pay (the first being a subset of the second), or above average pay as at December 2009.
The totals are below the last three columns and the percent indicates the percent of total jobs lost in each of the pay categories.
So in the downturn, from January 2008 to December 2009, 21 per cent of the jobs lost (net) were in sectors that paid on average below 75 per cent of the overall private sector average pay.
The last two columns divide the total job losses in net terms between above and below average pay and you can see that 85.8 per cent of the total jobs lost in the downturn were in sectors were paying above average pay.
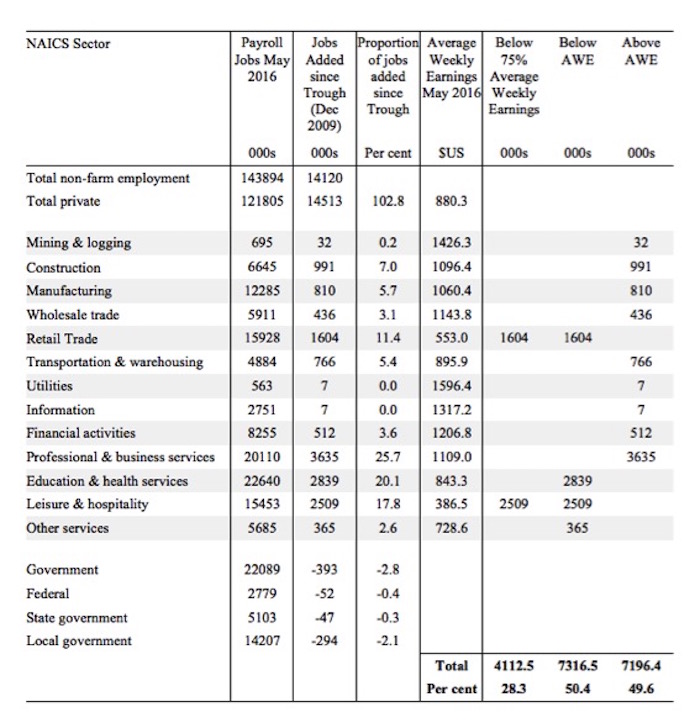
The next table summarises what happened in the period from the trough to the most recent monthly data observation (May 2016).
The columns now have a slightly different interpretation, given that we are discussing a growth period rather than a period of contraction.
The second column shows the latest BLS payroll employment data as at May 2016. The next column shows the number of net jobs (in thousands) that have been added by each sector since the trough in December 2009.
The next column shows the percentage of those total jobs added by sector. You can see that with the Government sector in contraction the total jobs added in the Private sector are 103 per cent of the total net jobs added.
The fourth column shows the Average Weekly Earnings for each sector as at May 2016.
The final three columns split these job additions into their pay characteristics using the sectoral average weekly earnings and the same criteria as in the previous example.
The summary statistics for each ‘pay category’ (75% of Average Pay, Below Average Pay, Above Average Pay) are at the bottom of each column.
We find that:
1. Government employment has contracted in the expansion, particularly at the Local Government level as fiscal austerity has been imposed.
2. 28.3 per cent of the total jobs added could be considered low-pay, that is, in sectors that pay on average weekly wage 75 per cent below the total private sector average weekly earnings.
3. 50.4 per cent of the jobs created (net) since the recovery began pay below average weekly earnings. That proportion has increased over the last 6 months.
The data shows that the low-paid jobs that were lost in the downturn have been more than added back (in net terms) in the upturn so far.
However the above average pay jobs that were lost in the downturn have not yet been recovered.
This analysis shows a bias in the recovery towards low-paid in the US, which would have to be considered a disturbing trend given the implications for long-term productivity growth and material prosperity.
Conclusion
Clearly, this analysis is at the aggregated NAICS level and a richer story could be told if we used the two-digit and three-digit typed drill downs into the industry classification.
That sort of analysis is more time-consuming than is feasible for a blog post, where the topic is not one of my primary and current research projects.
Paperback version of my Eurozone book now available
My current book – Eurozone Dystopia: Groupthink and Denial on a Grand Scale (published May 2015) – carries an on-line price of £99.00.
It is now available in much cheaper paperback form for £32.00.
Also the eBook is available 36.27 US dollars from Google Play or 61.45 Australian dollars from eBooks.com.
That is enough for today!
(c) Copyright 2015 William Mitchell. All Rights Reserved.
The low labour participation rate must also be attributed to the fact that most new jobs being added are low-pay ones.
http://www.philipji.com/item/2016-04-16/what-explains-changes-in-the-labour-participation-rate
There is so little income support for unemployed US citizens I wonder how the people who have given up looking for work are surviving.
The growth in low paid jobs is happening in Australia too through increasing labour casualisation.
Kathy Heyne,
They are spending down savings for as long as it lasts. Younger people move back with parents and grandparents. I have seen people living out of their cars in shopping mall parking lot’s etc; peripatetic, looking for work.
This is a real kick in the teeth for the middle class, many of whom worked very hard to get to were they had been.
If this nonsense isn’t ended soon, the US and other developed nations will reach third world economic status in just a few years.
“both middle and high-skill jobs are being steeply replaced with low-skill jobs, and have been since the 1970s”
huffingtonpost: 08/20/2015
J Christensen,
“If this nonsense isn’t ended soon, the US and other developed nations will reach third world economic status in just a few years.”
That’s the “plan”, you know… competitiveness and all that crap. Race to the bottom, and then? Corporate feudalism.
Ignacio at June 10 2016 15:33,
There definitely seems to be a huge push on toward the replacement of nation states in favour of some sort of new world order. Analysis of the language of people in important positions as strategists or politicians and the now revealed content of major trade agreements tends to support the idea that corporations could become more powerful than democratic governments should the “plan” be permitted to continue unfolding.
It’s no longer possible to conceal that these organizations already run things quietly from the shadows. The difference that seems to be coming is that their power may soon be exercised more openly.
Kathy Heyne, J Christensen, Ignacio (an other one):
Kathryn Edin & H. Luke Shaefer’s recent book $2.00 A Day: Living On Almost Nothing In America addresses these questions. This Is What It’s Like To Live On $2 A Day is a review & interview.
The $2 (per person per day) is from the World Bank’s standard for third world poverty.
“Since the recovery began in January 2009”
June 2009 Bill?