The recent extreme weather in the northern hemisphere, the twin monster tropical storms in Japan,…
US jobs recovery biased towards low-pay jobs
Last Friday (December 4, 2015), the US Bureau of Labor Statistics (BLS) released the latest – Employment Situation Summary – November 2015 – which showed that “Total nonfarm payroll employment increased by 211,000 in November, and the unemployment rate was unchanged at 5.0 percent”. According to the press reports the data was above expectations and will probably help the US Federal Reserve Bank decide to increase the policy interest rate when it next meets on December 15 and 16. The revised data for September and October also indicated that the US economy had added (net) employment above what had originally been reported. On average, the US labour market has added 237,000 net jobs per month over the last 12 months. What I was curious about was whether these were predominantly low paid jobs or not. I found that the jobs lost in low-pay sectors in the downturn have more than being offset by jobs added in these sectors in the upturn. However, the massive number of jobs lost in above-average paying sectors have not yet been recovered in the upturn. In other words there is a bias in employment generation towards sectors that on average pay below average weekly earnings.
That question cannot be immediately answered from the summary report provided by the BLS and needs further analysis (and lots of data manipulation). But curiosity got the better of me late today and this is what I came up with. Effectively, since the recovery began in January 2009, there have been 13,712 thousand net jobs added to the US labour market. Of those net employment additions, 28 per cent have been what might be considered low-pay, where that is defined as less than 75 per cent of average weekly earnings.
I was also curious about what happened in the downturn with respect to the jobs lost in net terms and their pay characteristics (at a sectoral level)
Peak US non-farm employment occurred in January 2008 (138,365 thousand) and the trough occurred in December 2009 (129,685 thousand).
Since then, total non-farm employment has grown by 13,215 thousand and total Private employment has grown by 13,712 thousand with government employment falling by 497,000 after growing by 94,000 during the peak-trough period ( January 2008 to December 2009).
Using the top-level North American Industry Classification System (2012 NAICS).
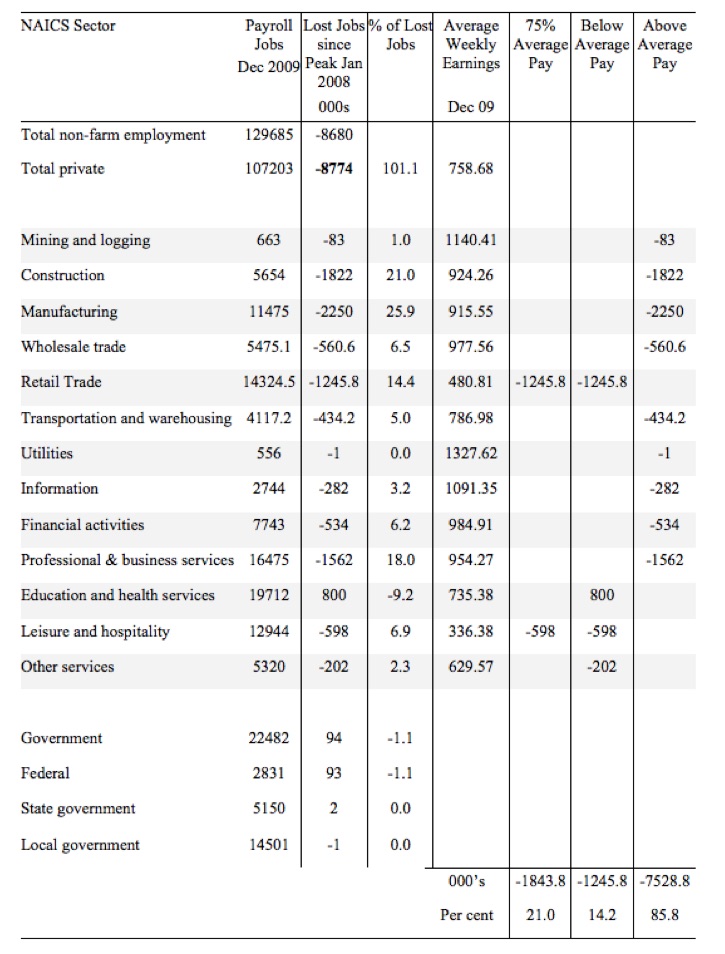
The following table summarises what happened in the peak-trough period.
The first column shows the NAICS sector with the first two rows summarising relevant totals. Total non-farm employment is the sum of total private employment plus Government employment.
The second column shows the total employment in each sector as at December 2009, which was the trough of the downturn following the peak in January 2008.
The third column shows the lost jobs (in thousands) between the Peak and the Trough (these are net losses). So overall 8.8 million jobs were lost in the private sector and they were only partially offset by the 94,000 net jobs added in the government sector.
The next column shows the percentage of those lost jobs per sector, which allows you to see where the downturn impacted mostly. The next column shows average weekly earnings as at December 2009 in US dollars.
The final three columns then distribute the jobs lost according to whether the sector pays 75 per cent or less than average pay, below average pay (the first being a subset of the second), or above average pay as at December 2009.
The totals are below the last three columns and the percent indicates the percent of total jobs lost in each of the pay categories.
So in the downturn, from January 2008 to December 2009, 21 per cent of the jobs lost (net) were in sectors that paid on average below 75 per cent of the overall private sector average pay.
The last two columns divide the total job losses in net terms between above and below average pay and you can see that 85.8 per cent of the total jobs lost in the downturn were in sectors were paying above average pay.
The next table summarises what happened in the period from the trough to the present day (November 2015).
The columns now have a slightly different interpretation, given that we are discussing a growth period rather than a period of contraction.
The second column shows the latest BLS payroll employment data as at November 2015. The next column shows the number of net jobs (in thousands) that have been added by each sector since the trough in December 2009.
The next column is just the percentage of those total jobs added by sector. You can see that with the Government sector in contraction the total jobs added in the Private sector are 103 per cent of the total net jobs added.
The final three columns split these job additions into their pay characteristics Using the sectoral average weekly earnings and the same criteria as in the previous example.
28 per cent of the total jobs added could be considered low-pay, that is, in sectors that play on average weekly wage 75% below the total private sector average weekly earnings.
If we just consider whether the new jobs added are below or above average weekly earnings then the split is almost exactly 50-50.
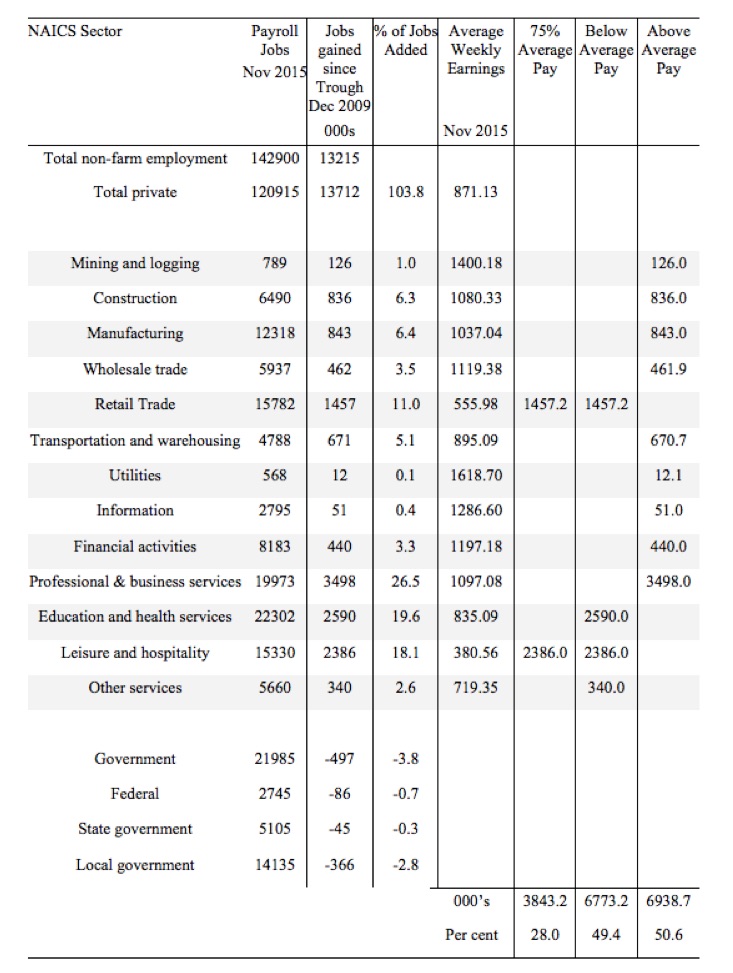
The data shows that the low-paid jobs that were lost in the downturn have been more than added back (in net terms) in the upturn so far.
However the above average pay jobs that were lost in the downturn have not yet been recovered.
This analysis shows a bias in the recovery towards low-paid in the US, which would have to be considered a disturbing trend given the implications for long-term productivity growth and material prosperity.
Conclusion
Clearly, this analysis is at the aggregated NAICS level and a richer story could be told if we used the two-digit and three-digit typed drill downs into the industry classification.
That sort of analysis is more time-consuming than is feasible for a blog post, where the topic is not one of my primary and current research projects.
That is enough for today!
(c) Copyright 2015 William Mitchell. All Rights Reserved.
Adding more low paid jobs just exacerbates the situation. Hence furore in UK over working tax credits originally targeted for poverty prevention now corporate welfare.
Bias toward low paid jobs is right, and both the US and the UK officials are speaking as if a real recovery is underway. Yellen is considering raising interest rates, again, and if she does, no doubt Carney will follow. Pathetic, and infuriating.
The hollowing out of the middle class continues apace.Joyous news for the 1 % as their oligarchic
control of land and labour consolidates.
Chris longs in the current UK Labour market working tax credits are the only defence against poverty.
You cannot have discretionary cuts in welfare without increasing poverty or decreasing growth.
The Lords did Osbourne a massive favour ,the sudden loss of 12 billion income would have likely
precipitated recession.Still it’s only a matter of time and when it comes the middle class can be
eroded further the new gilded age arrives.
How would a JG help create a high wage economy.
Jobs are out there these days,its just that pay vis a vis the cost of living is not great at all.
Kevin,
Agreed just highlighting difficulty of using tax/universal credits when job guarantee better option.
Unfortunately highly paid jobs scarce and endangered using technology etc.
Using job guarantee in UK next problem as trade agreements used to block favouring UK citizens
Yes we’re all becoming “frogs slowly and cozily boiled in oil”. That’s how the delusions of DSGE become truth…and eventual rebellion, frustration and war become “human nature”. That is indeed the nature of homo economicus. Homo sapiens would have almost entirely different reactions…if it were ever given the economic and monetary chance with policies of abundance instead of austerity.
This confirms what some of what US economists have been reporting for some time now. The “typed drill downs” are worrying. Among the “business and professional services” jobs added are many related to employment locating services. The retail job numbers must be questioned when aggregate demand is so low. The health sector jobs on the increase also seem to be the ones at the lower end of the pay scale.
There are other concerns as well; such as the flawed overall economic picture that develops when the unemployment rate does not reflect the massive numbers of discouraged workers who have simply dropped off the BLS radar, despite every measure being taken to inflate the reported number of employed, and that there seems to be a failure to properly factor in the correct “birth-death model” into the statistical analysis.
There is “growth in material prosperity” alright; it’s just that it’s only accessible to fewer and fewer people by the day. How long can increasing numbers of bar tending and server (leisure and entertainment) jobs continue in the absence of growth in the higher paid jobs once tightly associated with production? is the question asked.
It certainly looks as though the monetarist model has allowed the simple masking of the underlying distributional issues that could once be identified as stagflation by holding interest near zero and forgetting about unemployment as the world draws on savings or borrows. How much longer are they willing to pay the social costs of this thing that can’t act on either supply or demand side realities?