I started my undergraduate studies in economics in the late 1970s after starting out as…
What else but a fiscal stimulus?
Today the ABS released the May 2009 Retail Sales data which showed that retail spending is continuing to grow despite the gloom that surrounds the economy. The main culprit – the fiscal package. While the jumps in retail sales earlier in the year were tentatively ascribed to the fiscal intervention it was clear we had to wait a few more months before we could be more definite in our assessment. As of now we can confidently say that the early interventions by the Government have had positive impacts on the economy. Whether they will last depends on what happens to unemployment. If it continues to rise then ultimately this will undermine the positive spending trend. Then significantly more fiscal intervention will be needed.
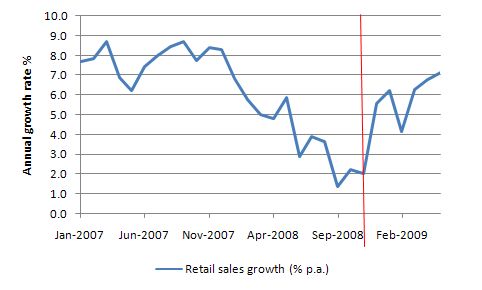
The following graph shows the annualised growth (% per annum) in Australian retail sales since January 2007. The vertical red line is at November 2008, which according to the ABS is the last observation month that is not “contaminated” by the fiscal stimulus packages. It looks like a major turnaround to me. In the 12 months leading up to the first stimulus package in December, retail sales growth averaged 4.4 per cent but was in decline. In the 6 months since November 2008, retail sales growth has averaged 6 per cent and it is actually gathering pace rather than slowing.
Unless you can pinpoint other factors, the elephant in the room for all those neo-liberals that have been wheeled out in recent months to say that fiscal policy is not effective … is the fiscal package!
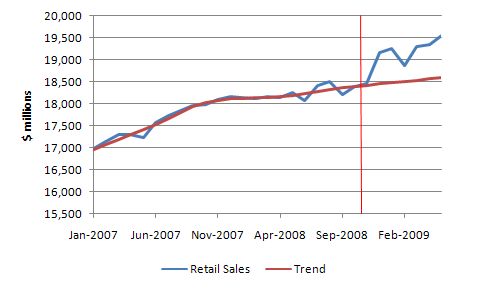
Another way of thinking about this is to compare the trend series with the actual series to see if the current behaviour is above what the might be expected given underlying trends.
Unfortunately, the ABS suspended its trend series in November 2008. In the December 2008 edition of the series they explained why they were suspending the trend estimates:
Spending behaviour in subsequent months may also be influenced by the December stimulus package and it may be some time before the underlying behaviour of the series can be accurately estimated. The retail trend series has therefore been suspended as at November 2008.
Which is curious because they have previously computed trends when “abnormal” events have affected sales (such as, OPEC oil price hikes and the period surrounding the introduction of the GST).
Anyway, I decided to estimate my own trend after November 2008 using some econometric modelling techniques. Various ways are available to do this and all came up with around the same result. Finally, to make it easier for you to repeat the exercise I just extrapolated out the last annualised growth rate (November 2007-November 2008 = 1.9 per cent) on monthly basis. The formal dynamic forecasts coming from a time series regression model were not that different anyway. The same story applies no matter which trend estimation technique I used. Of-course, it is just a game to provide something to look at!
The following graph shows the results from January 2007 to May 2009. The vertical red line is at November 2008 and prior to that the red trend series is the ABS official trend. After that the red line is my trend estimate up to May 2009.
The results are clear enough. Something quite different occurred around the time of the first stimulus package and has endured since then. The impact is definitely a direct impact of the extra dollars being pumped into pockets of consumers but it could now be starting to be of an expectational impact. In other words, the fiscal support may be impacting positively on consumer confidence. We will have to wait for a few months before we can conclude that though.
Comparison with the US
The fiscal stimulus in the US has been very different. The latest news reports suggest that there has been very little cash has actually been spent yet by Federal agencies. Research done by MSNBC business economists indicates that:
When the government enacted a $787 billion package of tax cuts and new spending this spring, there was much talk about how all that money would help pull the economy out of a deep recession. But readers are asking: Just how much of this money has been actually spent? Turns out the answer is not much.
The Australian stimulus has put $s into consumer hands first and later there will be infrastructure investments.
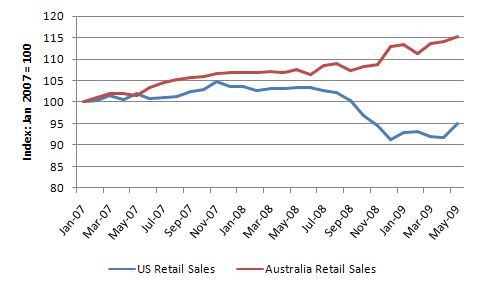
The following graph compares the US retail sales to Australian retail sales indexed at 100 in January 2007. The tale of two economies is clearly shown. It seems that the US is starting to bottom out though as their fiscal stimulus has put a floor in aggregate demand. In our case, the stimulus has probably done more than put a floor into the economy.
Manufacturing down still
While the stimulus package might be helping retail sales, in labour market terms this will translate into an expansion of part-time jobs which will benefit females mostly and also see underemployment rising.
Meanwhile full-time male employment will continue to fall if today’s other data from the Performance of Manufacturing Index is any guide. The PMI is produced by Australian Industry Group and PricewaterhouseCoopers and the June results show that while the contraction is abating the manufacturing sector is continued to decline.
A Key Finding of the Report was that:
The decline in manufacturing continued to ease in June, though activity fell for the 13th consecutive month.
The fiscal stimulus was thought to have helped a bit in four of the 12 sectors surveyed (more than 500 companies are included in the sample). The Report says that:
Four of the 12 sectors (machinery & equipment; textiles; basic metal products; and fabricated metal products) reported an easing in declines, with two sectors (food & beverages and clothing & footwear) recording increases in activity in June, reflecting the boost provided by the Government’s second stimulus package and lower interest rates.
Despite the continued weakness in new orders (raising doubts as to whether the improvement will be sustained in the months ahead), employment, deliveries and inventories all declined at a slower pace. Capacity utilisation rose marginally to 67.4%.
Continued weakness in the automotive, transport and construction industries was commonly cited by firms as impeding manufacturing production in June.
Conclusion
Is our stimulus effort enough? As long as unemployment remains above 2 per cent (and underemployment exists at all) then aggregate demand is deficient. A persistent deficiency (as we have suffered for some years now – like since 1975) is a sign that the fiscal position is too contractionary.
Further, the positive impact of the current stimulus packages will decline if unemployment continues to rise. The spending contraction that will accompany the lost incomes associated with the joblessness will ultimately undermine the positive spending trend. Then significantly more fiscal intervention will be needed.
So the Australian government needs to do more. They can start … yes … by announcing a universal and unconditional job offer at the federal minimum wage to anyone who wants to work in community development and environmental care service projects. That would be a really good place to start and would require an investment of around $A10 billion in the next 12 months and maybe add a per cent or so to the Deficit/GDP ratio.


This Post Has 0 Comments