It is my Friday Lay Day blog and it is going to be relatively quick. There was an article in the Wall Street Journal (December 23, 2015) – Economists Say ‘Bah! Humbug!’ to Christmas Presents – that says a lot about how my profession struggles to appreciate reality in all its dimensions. Every year, it…
Friday lay day – more Intergenerational Report nonsense
Its my Friday lay day blog which is designed to divert my attention elsewhere. I have now had a chance to read the 170-page – Intergenerational Myth Report 2015, issued by the Australian Treasury yesterday. The whole nation has become caught up in the doom and gloom that the conservatives are putting out about the projected deficits for the next 40 years. Not a fiscal surplus in sight. But at the same time, all this is based (using their own logic) that we will be back in a steady inflation, full employment Australia within 5 years and sustain that state for the projection period out to 2054-55. Question: What would be so wrong with that? Of course, that statement just assumes their own logic. The projections however are not mutually consistent and there is insufficient information about net export trends for us to understand whether a fiscal deficit of 6 per cent of GDP in 2054-55 (on current legislation) is suitable or not. But again, if that size deficit is producing full employment and price stability why all the ‘sky is about to fall in’ unless we produce fiscal surpluses as quickly as possible? Answer: this is a nonsensical political exercise and has little to do with economics.
Given I like numbers and relationships between aggregates etc and as a Modern Monetary Theory (MMT) proponent I am trained to see things in stock-flow consistent terms rather than make up projections without checking them for internal consistency or sense, I did some calculations this morning based on the assumptions in the IGR 2015. Just to see as they say!
First, the IGR just assumes away the problem of unemployment and says:
As a result of the constant unemployment assumption, employment growth from 2020-21 onwards (where the economy is projected to return to full employment) reflects growth in the labour force.
What is this constant unemployment assumption?
The unemployment projections in the IGR are based on the flawed NAIRU concept:
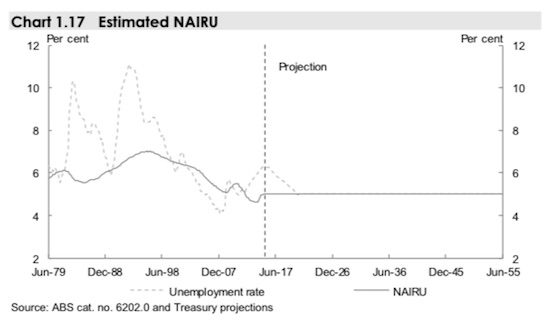
While employment growth depends on the dynamics of the labour force and the wider economy, the assumption of 5 per cent unemployment is based on estimates of the Non-Accelerating Inflation Rate of Unemployment (NAIRU). The NAIRU is the lowest sustained unemployment rate that does not cause inflation to increase.
They claim that “The NAIRU cannot be measured directly and is typically estimated using economic models (Chart 1.17). There is a wide range of uncertainty around estimates for the NAIRU, of the order of 1⁄2 to 1 percentage point”.
The variability of the estimates is a heroic assumption.
Very few authors in this area of work have dared to publish the confidence intervals around their point estimates of the NAIRU
There was one noted exception (mainstream econometricians Staiger, Stock and Watson in 1997) and their so-called “state-of-the-art” estimation of NAIRU models led them to conclude that:
… these estimates are imprecise; the tightest of the 95 percent confidence intervals for 1994 is 4.8 to 6.6 percentage points. If one acknowledges that additional uncertainty surrounds model selection and that no one model is necessarily ‘right’, the sampling uncertainty is prudently considered greater than suggest by the best-fitting of these models.
What they came up with (Page 39) was 95 percent confidence intervals of 2.9 percent to 8.3 percent. In other words, they were claiming that they were equally confident that the NAIRU was 2.9 per cent or 8.3 per cent.
This range of uncertainty about the location of the NAIRU is clearly too large to be useful for policy purposes.
With the current unemployment rate at 6.3 per cent, if we took the lower confidence interval bound (2.9 per cent) estimated by Staiger, Stock and Watson to be true, then this would allow for a major fiscal expansion without inflationary consequences (using the flawed NAIRU logic).
But if the NAIRU was actually at the upper confidence interval bound (8.3 per cent), then according to the same (flawed) logic such a fiscal expansion would be highly inflationary.
The econometricians were unable to discriminate between the two possibilities – they were equally confident that both were true.
In other words, totally unusable for policy making purposes.
The IGR 2015 provides this graph (Chart 1.17) which shows how ridiculous the projections are. The official unemployment rate falls steadily from around 6.5 per cent from now until 2020-21 and thereafter Australia is back to “full employment” with an unemployment rate of 5 per cent.
Please read my blogs – The dreaded NAIRU is still about! – Why we have to learn about the NAIRU (and reject it) and Full employment is still low unemployment and zero underemployment – for more discussion on this point.
Economists use rules of thumb to simplify projections. One such rul of thumb was provided by the late Arthur Okun, a US economist who is famous (among other things) for estimating the relationship that links the percentage deviation in real GDP growth from potential to the percentage change in the unemployment rate – the so-called Okun’s Law.
Please read my blog – Okun’s Law survives 50 years – trouble for the neo-liberals – for more discussion on this point.
The algebra underlying this law can be manipulated to estimate the evolution of the unemployment rate based on real output forecasts.
From Okun, we can relate the major output and labour-force aggregates to form expectations about changes in the aggregate unemployment rate based on output growth rates. A series of accounting identities underpins Okun’s Law and helps us, in part, to understand why unemployment rates have risen or why they might fall.
Take the following output accounting statement:
(1) Y = LP*(1-UR)LH
where Y is real GDP, LP is labour productivity in persons (that is, real output per unit of labour), H is the average number of hours worked per period, UR is the aggregate unemployment rate, and L is the labour-force. So (1-UR) is the employment rate, by definition.
Equation (1) just tells us the obvious – that total output produced in a period is equal to total labour input [(1-UR)LH] times the amount of output each unit of labour input produces (LP).
Using some simple calculus you can convert Equation (1) into an approximate dynamic equation expressing percentage growth rates, which in turn, provides a simple benchmark to estimate, for given labour-force and labour productivity growth rates, the increase in output required to achieve a desired unemployment rate.
Accordingly if we assume working hours to be constant, then the approximate rule of thumb is:
If the unemployment rate is to remain constant, the rate of real output growth must equal the rate of growth in the labour-force plus the growth rate in labour productivity.
It is an approximate relationship because cyclical movements in labour productivity (changes in hoarding) and the labour-force participation rates can modify the relationships in the short-run. But it provides reasonable estimates of what happens when real output changes.
The IGR 2015 considers working hours per week will decline slightly over the next 40 years but their graphs indicate hardly any shift at all and so it is not violating their projections too much to assume they are more or less constant. It certainly doesn’t substantially change the point I am making here.
The sum of labour force and productivity growth rates is referred to as the required real GDP growth rate – required to keep the unemployment rate constant.
Remember that labour productivity growth (real GDP per person employed) reduces the need for labour for a given real GDP growth rate while labour force growth adds workers that have to be accommodated for by the real GDP growth (for a given productivity growth rate).
The IGR 2015 makes the following assumptions for the period to 2054-55:
- Real GDP growth to average 2.78 per cent per annum.
- The labour force to reach 20,388,000 by 2054-55.
- Labour productivity growth to average 1.5 per cent per annum
It also publishes various decade by decade estimates up to 2054-55.
I took these various decade aggregates provided in the IGR 2015 for population, working age population, the labour force, labour force participation rates and hence employment, and then simulated the within-decade years assuming linear shifts.
That gave me the dataset that is necessary to then apply this rule of thumb.
Have a look at this graph, which I created by simulating the assumptions built-in to the IGR 2015 using the actual 2015 values (or late 2014 values) as starting points.
It shows the projection of the national unemployment rate from 2015 (where it is currently 6.3 per cent) out to 2055 (blue line) and the IGR 2015 unemployment rate projection (noted above and shown in the graph above).
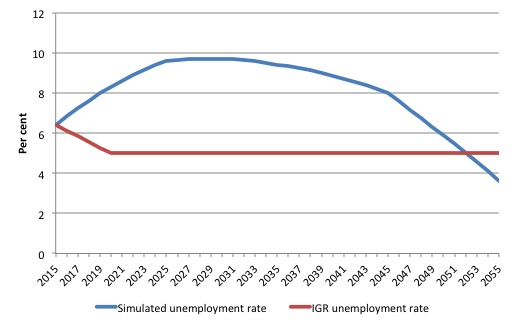
So if you tie together all the aggregates they are working with and render them more or less consistent with the underlying economic relationships that govern their movement (summarised by the rule of thumb above), then the real GDP growth projection coupled with the labour productivity and labour force projections would give you something like the blue line.
The unemployment rate rises steadily over the period 2015 to 2031 to reach a peak of 9.7 per cent and then as the participation rate drops slightly and the labour force growth rate drops but real GDP growth and labour productivity growth maintains the average rates, the unemployment rate steadily drops.
That is quite a different story to that told in the IGR 2015.
Given the aggregates, it is virtually impossible to conjure up a steady 5 per cent unemployment rate from 2020 to 2055.
This is just one of several examples I could have provided to show how the IGR 2015 doesn’t make much sense even on its own assumptions.
Which should give you cause to reflect on whether there is anything that is consistent in these projections.
Fourth Clyde Cameron Memorial Lecture – February 18, 2015
Here is the video of my presentation on February 18, 2015 marking the Fourth Clyde Cameron Memorial Lecture. The lecture was given in Newcastle, NSW. The audio is not of high quality initially due to a microphone placement issue. It improves as time passes.
The question time has been edited out due to audio issues.
Australian metadata laws
A policy activist campaign has begun – Please Pledge To Help ‘Curious George’ – which aims to help the Australian Attorney-General George Brandis find out:
… what we are up to online. And the phone … Email, Facebook, Twitter. Calls, Texts, Skype. Friends, Family, Politics. The lot!
As a start the campaign urges us to help George by cc’ing “senator.brandis@aph.gov.au” into every E-mail you send.
This is in response to the Australian Government’s nightmare legislation that will enforce all ISPs to retain all data for two years of its customers.
There are already a number of known ways of getting around the retention, which just makes it a rather futile policy.
But while it might be futile in protecting Australia from terrorist attacks which is the overall aim, it will increase ISP costs and they will be passed onto end-users like us.
In this article (March 2, 2015) – Australians harass George Brandis as the true cost of metadata retention is revealed – we learn that the proposed changes will cost “between $188.8 million and $319.1 million”.
The Attorney-General declined to draw any attention to these estimates via a standard press release, despite a document from an accounting firm being available on the Department’s homePage.
The article says:
The true cost of the Abbott government’s new metadata retention laws has been revealed, with the government quietly publishing the estimated price tag without announcing it.
Apparently, the cost estimates are understated.
The last execution under the death penalty in Australia
Ronald Joseph Ryan – was the last person to be legally executed in Australia. It occurred on February 3, 1967 in Melbourne’s Pentridge Prison (now a housing estate).
He mistakenly shot a prison warder as part of an successful escape in December 1965. The evidence was quite confused and later in the 1980s, a former warder admitted he probably fired the shot that killed the warder. Whatever, it was clear that Ryan, if his gun was involved, never intended to kill the warder. He was a petty burglar.
The Premier of Victoria at the time was the conservative Henry Bolte who insisted that Ryan be hanged. He was a nasty corrupt bastard of a politician.
I recall the morning well. He was hung at 8.00. I was young and it was school holidays (last week). It was one of those hot, blowy February days in Melbourne (a Friday) where the temperature was above 37 degrees Celsius, and the start of a very hot few days (above 40 degrees Celsius).
I was out early that morning and was down a local park and was sort of stupefied that they could do that to someone. State murder!
There was a nationwide three-minute silence at the exact time of the execution. As the gallows went into operation, the pigeons that lived on the roof of the area of the prison where he was hung, took flight and the protesters who were maintaining a vigil outside the prison knew that the murderous act had been followed through.
It was a very sad day.
A short time later, an Anglican church in St Kilda East (a suburb of Melbourne) – St James the Great, St Kilda East – installed its “Epiphany Window” and blessed it in February 1967 as a memorial for Ronald Ryan.
The artist Miroslav Dismas Zika “etched a Latin inscription into the glass near the base of the window which can be translated as “Dismas made this in 1967 at the beginning of the month when Bolte, scandalous, arrogant, was demanding Ryan suffer capital punishment.”
The Premier freaked out and demanded it be removed. The sycophantic Anglican Archbishop of Melbourne apologised to Bolte and said that the words would be removed.
The inscription was ‘removed’ by filling “the etching with a soft leaded pencil”.
If you visit the Church today you can once again see Zika’s entirely accurate Latin message to the people – that Bolte was a vindictive character who gained political ground by murdering Ronald Ryan.
Here is a photograph of the etching on the window:

This article – The necking of Ronald Ryan – written in February 1967 by the journalist – Evan Whitton – is an evocative piece that brings back harsh memories.
Clearly, the Indonesians have not reached the level of sophistication that tells them that there is no right to State sanctioned murder no matter the crime. Not that the Indonesians are alone in that maintaining that barbarism.
Saturday Quiz
The Saturday Quiz will be back again tomorrow. It will be of an appropriate order of difficulty (-:
That is enough for today!
(c) Copyright 2015 William Mitchell. All Rights Reserved.
“Which should give you cause to reflect on whether there is anything that is consistent in these projections”
There doesn’t need to be. It just has to be impressive enough and weighty enough to convince people of the solid ‘science’ behind the political rhetoric.
It’s the same trick outsourcers use when bidding for outsourcing contract. The size of the bid document and it looking impressive with the right sort of soothing phrases in the executive summary (which is the only bit that gets read if that) is all that matters. The people reading it just want a warm fuzzy feeling that their preconceived ideas are justified. Accuracy and engineering are less important. Those will be fudged later and smoothed over by warm words from the contract managers.
There is no rationality in all of this. It is pure psychological manipulation based upon standard sales and marketing techniques. Given that they only have to nudge a pre-conception it’s easy.
The clever trick in economics over the last few decades is to dress more and more politics up as economics. The more I read, the more preconceived ideas dressed up with post-hoc justifications I find. All with no hope of being subjected to any scientific test to show their validity. Or worse using ‘scientific’ statistical tests with dubious applicability.
I do not support judicial murder in any shape or form.
Neither do I support stupid and greedy scumbags running drugs into Australia.
I do not support the AFP passing their responsibilities to the Indonesian police in some sort of cute act.
I do not have any time for Indonesia,Indonesians,Indonesian military,paramilitary and police who are notoriously corrupt and brutal in a notoriously corrupt nation. Australian has been training and supporting the activities of these people. Most notably in West Papua and Timor Leste.How is that for hypocrisy?
However,we can’t choose our neighbours and Indonesia has the right to make its own laws and apply them to whoever they choose. If you don’t like the laws or politics or whatever of a country then don’t go there.
The spectacle of numerous Australians,some in very prominent positions, virtually begging Indonesia to refrain from shooting 2 Australians has been quite sickening. By all means make it clear,once and once only, that we don’t agree with this behaviour. But this shameful crawling makes my skin crawl.
Will any of this noise result in empty seats on the Bogan Bus,Brisbane- Denpasar?
I doubt it.
Dear Bill
Have a great weekend!
The chart IGR 2015 1.17 is quite something. Imagine any other discipline (science, mathematics, engineering) with a predictive process with so far reaching social concequences having methodology that produces such output as this.
I have just been reading the IGR. It says that tha GNI per person will rise from $66,000 now to $117,000 in 40 years time. So what’s the problem?
tonyw – And you believe that?
You have the problem,laddie.
Well, I have just decided that the discussions in this blog are not at a sufficiently high level to make it worth reading and so this is my last visit. All the best.