The recent extreme weather in the northern hemisphere, the twin monster tropical storms in Japan,…
CEO pay still out of control
On September 15, 2014, the Melbourne Age article – Workers can forget about big pay rises for some time to come – summarised the wages outlook that workers can expect in the coming year as the labour market weakens. Its bleak. Meanwhile, CEO pay while down from the peaks of 2007 remains excessive according to a major survey released in Australia this morning. Depending on how one measures it, the average CEO of the Top 100 companies earns between 65 and 84 times what the average worker takes homeeach year. And these bosses lead the cheer squad when industry leaders and government ministers claim workers have to take pay cuts and surrender penalty rates and that the minimum wage should be abandoned. The neo-liberal obscenity survived the GFC and has now reorganised. Woe be us!
I considered the plight of workers and the now falling real wages outlook in this blog – Real wages falling and Treasury continues to deceive.
The following graph summarises the situation and shows the annual hourly real wage change for the private sector (blue bars) and the annual hourly productivity growth (green line) since the March-quarter 2001.
Productivity growth is booming at present, which is one reason why employment growth is so flat. For each extra dollar of real output, less workers are needed when productivity growth rises.
The usual payoff is that the rising productivity growth is shared out to workers in the form of improvements in real living standards. Higher rates of spending then spawn new activity, which soaks up the workers lost to the productivity growth.
The problem is that the payoff has been clearly absent over the last 3 years with real wages growth lagging productivity growth.
Real wages growth overall has been negative for the last three quarters (driven by the private sector).

The Melbourne Age article earlier this week said that:
When it comes to pay rises, it is a sorry state of affairs confronting many wage-earners at the moment.
Average wages are growing at near their slowest pace since the early 1990s recession and are failing to keep up with inflation. That means “real” wages are shrinking – and the experts reckon this will continue for a while yet.
It may come as a surprise when you consider that we’re neither in a recession, nor recovering from one.
The rest of the analysis suggests that the coming off the mining boom has left a very weak labour market, which means that the bargaining power of workers has fallen as unemployment rises again.
The outlook is that the real wage cuts will continue for another 2 years as Australia joins “the ‘slow wage growth’ club of countries including the United States, United Kingdom and those in Europe, where pay rises have been miserly for years.”
The rising gap between productivity and real wages means that the wage share in national income continues to fall.
Where does the real income that the workers lose by being unable to gain real wages growth in line with productivity growth go? Answer: Mostly to profits. One might then claim that investment will be stimulated.
As the real wage declines and the gap between productivity rises, the Investment ratio (percentage of private investment in productive capital to GDP) has barely risen over the course of the crisis period (since February 2008) and since the June-quarter 2013 it has fallen from 24.4 per cent to 22.1 per cent. Quite a drop.
Some of has gone into paying the massive and obscene executive salaries that we occassionally get wind of.
Some will be retained by firms and invested in financial markets fuelling the speculative bubbles around the world.
For workers, the problem is that they rely on real wages growth to fund consumption growth and without it they borrow or the economy goes into recession. The former is what happened around the world in the lead up to the crisis (and caused the crisis).
The latter is more or less what is happening now.
One of the essential changes that needs to happen to ensure that another bout of financial instability doesn’t hit soon is that real wages have to grow in proportion with productivity growth – exactly the reverse of what is happening now.
Overall, the dynamic that, in part, created the GFC – suppression of real wage rises in line with productivity growth and the resulting reliance on private debt to maintain consumption spending, is back and the world is building up again for GFC Mark 2.
So what about executive pay? Are they really doing that well?
Today, the Australian Council of Superannuation Investors (ACSI), the body that “provides independent research and advice to assist its member superannuation funds to manage environmental, social and corporate governance (ESG) investment risk”, released the results of its annual survey of CEO pay in Australia – CEO Pay in the Top 200 Companies: 2013.
The related press release – Cords cut on golden parachutes – suggests that times are somewhat tougher for CEOs because of “continued investor scrutiny, and increased vigilance by the boards of ASX100 companies”.
The result has been that termination payouts have fallen below the legal limits that were introduced in 2009 by the revised Corporations Act.
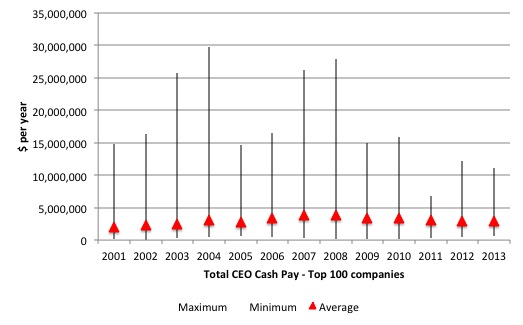
The first graph shows the average total CEO Cash Pay in the Top 100 companies (red triangles) and the maximum and minimum values for each year.
The ACSI define the total cash pay as “fixed pay, cash bonuses and accrual of entitlements”, so more or less what an average worker might receive each year (the bonuses if they are lucky).
There is considerable disparity within the ranks of the CEOs (from max to min). There are some sensationally large salaries and some rather modest ones (in relative terms).
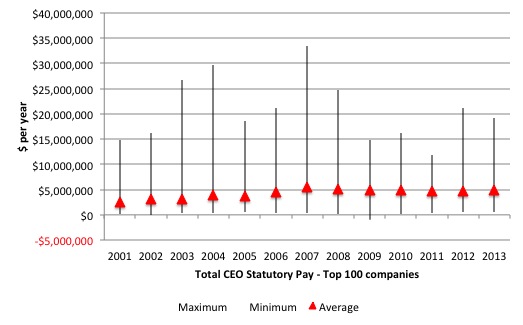
The next graph shows the average total CEO Statutory Pay in the Top 100 companies (red triangles) and the maximum and minimum values for each year (see accompanying table for actual dollar values).
The ACSI define statutory pay as “the total remuneration disclosed for a CEO in a company’s remuneration report, as required by Australian law. It therefore includes the value of share-based payments expensed under accounting standards”.
Don’t be fooled by the different scale of the axes in each graph – the statutory pay is a huge step up on the total cash pay.
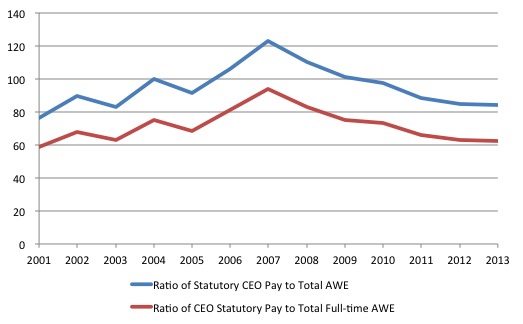
The next graph shows the Ratio of CEO Statutory Pay to Total Average Weekly Earnings (blue line) and Total Average Weekly Full-time Earnings (red line) from 2001 to 2013.
The ratio for the former started at 76.2 in 2001, peaked at 123.1 in 2007 at the height of the ‘greed is good’ frenzy and is now back to 83.9 and is stabilising.
The ratio for the latter started at 58.6 in 2001, peaked at 93.7 in 2007 and is now back to 62.5 and is stabilising.
One Fairfax commentator this morning wrote – Pay for Australian CEOs is down, but it’s still too high.
He commented that in terms of all the talk at present “about what sacrifices should be made to ensure Australia grows and prospers” that:
You just cannot expect everyone to take you seriously when your top spokesperson pulls an eye-watering 63 times average earnings.
These differentials are always justified by the conservatives and the business lobby as being essential to attract top quality executives. But then we know that company performance is not closely linked at times to the pay that the CEOs get, which puts a hole in that argument.
The Fairfax article notes in relation to the huge pay disparities that:
The boom that lit the fuse of the global crisis then overwhelmed commonsense and decency … Pay was out of control at that time in almost every way. Short-term bonus hurdles were too low, shares were vesting too quickly and on terms that were too generous, and termination payments were too big.
Company leaders offered various excuses, all of them lame.
This is the ‘greed is good’ frenzy that was associated with the total failure of the financial market and associated labour markets to self-regulate along the lines that the mainstream economics and finance textbooks claimed.
The Fairfax analyst considers the excuses the corporate sector proffer in their attempt to justify the massive discrepancy.
1. “companies were only paying what the market demanded”. He dismisses this and says that there was “ineffective shareholder scrutiny” and “Those asking for ludicrously high pay deals were often being rewarded by people in boardrooms who had hopped on the same gravy train to get there”.
2. “rising profits and sharemarket valuations justified the fat base pays, short-term cash bonuses and long-term share incentives that were being handed out”. He notes that the whole ‘growth train’ leading up the GFC was unsustainable and CEOs were rewarded for pushing the train on faster.
3. “criticism of CEO pay was unfair when others, including actors and sports stars, were celebrated for making fortunes”. He says that excessive CEO pay is dangerous because of the contagion possibilities – as evidence by the GFC.
The ACSI report presents some graphs showing comparisons with Average Weekly Earnings and movements in the CPI, which are perhaps misleading.
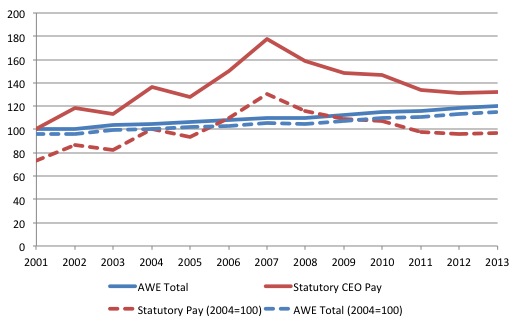
One thing to know about indexes is that the result can be easily manipulated by the choice of the base year (when you set the time series to 100 or 1).
The ACSI, for example, present an indexed comparison by setting the base year to 2004, whereas the data goes back to 2001. The following graph I produced shows the difference. The solid lines are indexed at 100 in 2001 (the first observation in the data series), whereas the dotted lines are indexed to 100 in 2004.
The data is also deflated using the Consumer Price Index, so reflects real growth.
I also use Average Weekly Total Earnings (which provides some measure of the shift towards part-time work) and a better indicator of the central tendency in the labour market.
You can see that the CEO Statutory pay has grown over the period in real terms by 32 per cent whereas the average worker enjoyed only a 20 per cent increase over the 12-year period.
Of course, the CEO real pay exploded in the financial market frenzy before the crisis and by 2007 their real pay had risen by 77 per cent since 2001, compared to the average worker’s real wage rise of 10 per cent over the same period.
If we index at 100 at 2004, then the picture for CEO pay changes. Since 2004, their real Statutory pay has falllen by 3.4 per cent whereas average worker’s annual wage has risen by 14.9 per cent. A totally different picture using the same data.
Which is correct? They both are! It all depends on what you are attempting to understand.
But the situation is different to that in the US
The ratio of executive pay to average earnings in the US is of a different scale to that in Australia.
Last year (April 30, 2013), Bloomberg published the results of its survey of CEO pay in the US – see CEO Pay 1,795-to-1 Multiple of Wages Skirts U.S. Law .
They showed that:
Across the Standard & Poor’s 500 Index of companies, the average multiple of CEO compensation to that of rank-and-file workers is 204, up 20 percent since 2009.
Compare that to Australia’s 85.
Bloomberg produced this graphic – Top CEO Pay Ratios and you will see that the top CEO (from JC Penney Co) earned 53.3 million in the fiscal year to 2012 compared to the average work in 2012 in his company who earned $29,688.
The arithmetic is almost breathtaking – the Pay Ratio was 1,795! Obscene.
Bloomberg reported at the time that under the Dodd-Frank law, the US government required “companies to reveal actual CEO-to-worker pay ratios” but after 3 years, “the numbers remain unknown”. It outlines how the Washington lobby, led by the so-called “HR Policy Association” has been fiercely opposed to making this information public.
They quoted the organisation “which represents top human resources executives at about 335 large corporations” as saying:
We don’t believe the information would be material to investors.
It beggars belief that shareholders would not find this sort of information useful. It would also be very useful to workers and consumers. The unions could use it to improve pay and conditions for their members and consumers could strategically boycott companies that offended their sense of decency.
Conclusion
While the Pay Ratio has falling in Australia, in part because federal legislation since the GFC has given shareholders more power to vote down proposed CEO pay deals, the ratios have been going in the opposite direction in the US.
It seems almost unbelievable that given the depth of the crisis in the US that this should be so.
A triumph for the neo-liberals in a nation that pretends everyone is free with equal opportunity and therefore lets the elites get away with murder. Delusion on a national scale.
But the ratio in Australia is totally out of proportion and further limits should be imposed.
Scotland’s big day out
On September 27, 2012, I wrote – Scotland should vote yes in 2014 but only if …
Then on August 18, 2014, I wrote – I would be voting NO in Scotland but with a lot of anger
The flip-flop between YES-NO were totally consistent given the qualifications I noted in each blog about the YES case’s failure to articulate the need for their own currency and to avoid talk about joining the Eurozone.
I was also aware that the YES case was being made by those as besotted with flawed neo-liberal economic thinking as those making the NO case.
Today, I hope they all vote YES. I accept that these big political shifts have to be done in stages. They will never get their own currency and be able to set their path to self-managed prosperity if they vote NO.
They may never achieve that with a YES vote but one would hope they would see the light eventually and realise that trying to keep the pound would force their country into a spiral of recession and rising despair.
Perhaps that rising despair would then be the catalyst to go truly independent like Argentina in 2002 after its crisis.
Either way, hanging around with the rest of Britain that is caught in the destructive grip of austerity is no place to be.
And, the dominance of neo-liberal ideas is a finite process – eventually we will jettison that ideology and hopefully a more progressive public will empower governments to get back to creating full employment and strong public services.
So VOTE YES bonny Scotland and be proud to stand free.
That is enough for today!
(c) Copyright 2014 Bill Mitchell. All Rights Reserved.
In the 1960s and 70s the major companies in Australia determines staff salaries from front line supervisors to the CEO on the basis of Hay Points. There were three components of the rating scale for each position.
The first component was the training requirement and it was generally accepted that the superintendent of a major production department, say the Superintendent of a Blast Furnace Department at a steel plant site needed a technical type degree. The second component was personal relationship skills and certainly a supervisor coping with semi-skilled operators and maintenance tradesmen needed to be competent in that respect. The third component was the value added. The superintendent had a direct contribution and responsibility for the value added in his department.
Other people could have a contributory contribution.
It was generally also accepted that about six hierarchical steps were all that were required for a very big industry each step was also worth a salary step in the ration of 10 to 7 or about 1.4 : 1.
So the ratio of the CEO to a front line supervisor was accepted as being about 1.4^6 ; 1.
That would give a multiple of about 7.5
In the late 70s the brass decided that was not enough.
Minus reception of the appropriate feedback from the “controlling” interdependencies, any system metric is “out of control.”
Which feedback channels could/would/should be exerting the needed control … and why aren’t they operating as needed?
The more I read about current political economics, the more it reminds me of cancer biology.
I’m hoping they vote NO. The SNP are just the Scottish equivalent of the Tory party. They are only promising extra public services to get a yes vote. They are supply-siders who believe in balancing the budget over the cycle. The Scots will simply get a different centre-right (hard neoliberal) party to contend with.
It is howver possible that Scotland would have to reapply to the EU on independence, but sadly most Scots seem to want to be in the EU with all its mindless EU directives and fiscal constraints.
@Charles J
EU directives and fiscal constraints are not mindless – they are anything but.
Never forget that.
Its a great pity Western Scotland will vote yes as they are the one people self aware enough to top themselves rather then give up their freedom for the banks dubious comforts.
Somebody somewhere must tell them that there are forces in London which want to turn Scotland into a maoist nightmare – much like Ireland post 1979.
The unionists in the lower ranks of the British state who campaign for the old dastardly union simply have not got the mail from the big bank.
These dull unionist functionaires remain shocked by it all – much like when Ireland left the gaff in 22 only to become a even greater money spinner for London – funny that.
London wants us to do the River Dance thing.
To get all excited about this or that and believe in something or other and therefore produce for them.
The last thing they wnt to see is Rab C nesbitt like cycnism.
It’s looking like a NO if the bookies know anything.
It does make you wonder though what the position would have been had they read up on MMT beforehand.
The sheer vitriol in some /most of the media against Scotland has surprised me.
The lunatics are still in control.
CEO remuneration ? Greed exceeds need and ability. Joyce of Qantas infamy is just one of many.
Scotland the brave – As I am predominantly of Irish Celtic extraction I have some sympathy for the Scots. But nationalism and tribalism generally only lead into a deeper hole unless accompanied by realism.
I’m not sure whether the Scots have thought this independence thing through realistically.