I grew up in a society where collective will was at the forefront and it…
US national accounts – growth but for how long?
Last Friday (April 26, 2013), the US Bureau of Economic Analysis – published the – US National Income and Product Accounts – for the March-quarter 2013 (the advanced estimates – subject to later revision). The US economy continues to grow despite the fiscal drag coming from the government sector, principally the federal government. But the outlook is not that bright given that this data does not include the impacts of the “sequester”, which will start to reveal themselves more clearly in the June-quarter data. The signs are not good, however. Most recent data, which will feed into the second-quarter result is suggesting the economy is slowing under the weight of the fiscal drag. The point is that there is still a huge output gap in the US (my estimate – around 10 per cent) and no signs of an inflationary surge. Combining that information with the parlous state of the labour market indicates that the US federal government should be increasing their net spending rather significantly at present. The fact that all levels of government are now retarding growth is not a responsible act.
The BEA said in the release that:
Real gross domestic product – the output of goods and services produced by labor and property located in the United States – increased at an annual rate of 2.5 percent in the first quarter of 2013 … In the third quarter, real GDP increased 0.4 percent … The increase in real GDP in the first quarter primarily reflected positive contributions from personal consumption expenditures (PCE), private inventory investment, exports, residential investment, and nonresidential fixed investment that were partly offset by negative contributions from federal government spending and state and local government spending. Imports, which are a subtraction in the calculation of GDP, increased.
The following sequence of graphs captures the story.
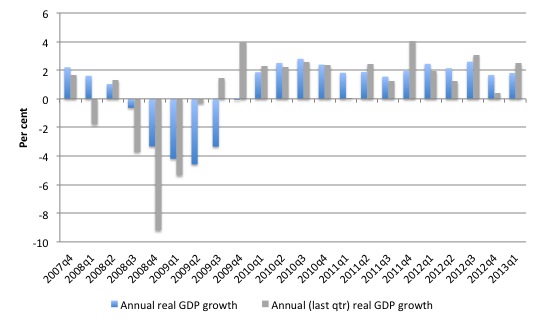
The first graph shows the annual real GDP growth rate (year-to-year) from the peak of the last cycle (December-quarter 2007) to the March-quarter 2013 (blue bars) and the annualised last quarter growth rate (grey bars).
The year-to-year growth rate was only 1.8 per cent and the trend is falling. The annualised version of the March-quarter 2013 growth rate (2.5 per cent). There is considerable volatility in the data (partly due to Hurricane Sandy), which is smoothed out by the year-to-year growth calculation. Overall, the economy is maintaining below-trend growth but is facing contractionary forces.
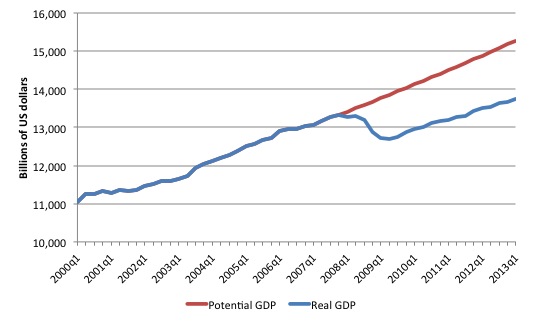
The next graph shows the actual real GDP for the US (in $US billions) and my estimate of the potential GDP. There are many ways of estimating potential (given it is unobservable). There is a whole industry involved in this endeavour and while the various techniques developed are interesting to characters like me who like econometric and statistical puzzles I am sure a detailed treatment would leave most readers wanting less.
I chose a method based on extrapolation – starting from the most recent real GDP peak (December-quarter 2007). For a more detailed discussion of how I did this, please read this blog – US problems are cyclical not structural
The projected rate of growth was the average quarterly growth rate between 2001Q4 and 2007Q4, which was a period (as you can see in the graph) where real GDP grew steadily (at 0.62 per cent per quarter) with no major shocks. If the global financial crisis had not have occurred it would be reasonable to assume that the economy would have grown along the red line (or thereabouts).
The gap between actual and potential GDP in the first-quarter 2013 is around $US1,523.4 billion (about 10 per cent of potential GDP). I have seen estimates of this around $US1 billion. The truth is somewhere in between these two estimates. Qualitative assessment? Enormous gap representing a massive permanent loss of national income every day the gap continues.
This is a cyclical problem. If the gap was due to structural factors then it not have fallen as sharply as it did in early 2008. Structural deterioration is gradual and cumulative not sudden and sharp.
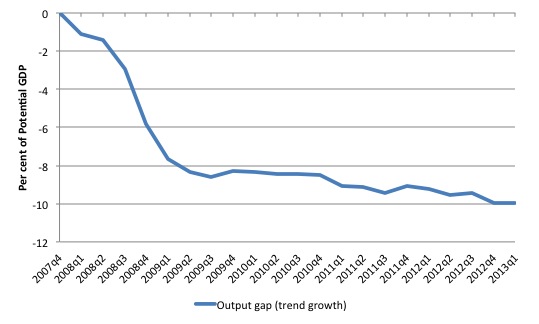
The second graph shows the percentage output gap (percentage deviation of actual from potential real GDP) that is derived from the above graph. It is in fact more accurately called the incremental output gap because I would not presume that there was full employment in the December-quarter 2007.
In other words, my incremental output gap depicts the increase in whatever gap existed at December-quarter 2007.
The output gap rose from 9.9 per cent in the December-quarter 2012 to 10 per cent in the March-quarter 2013, indicating that the current growth rate is still relatively weak and provides much more scope for expansion.
Contributions to growth
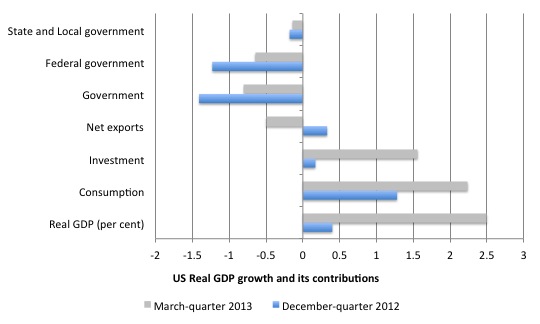
The next graph compares the December-quarter 2012 contributions to real GDP growth at the level of the broad spending aggregate with the previous quarter. The main aggregate source of growth came from private consumption spending, which contributed 2.24 points (up from 1.2) to the overall real GDP growth figure of 2.4 per cent.
Private investment also contributed strongly – 1.56 points (up from 0.17).
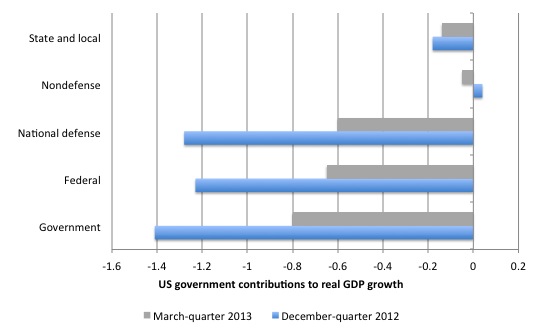
The contraction of the government sector scythed 0.8 points of real GDP growth in the March-quarter 2013, with the largest component of that coming from the federal level (-0.65 points).
Net exports were responsible for 0.5 points contraction (down from 0.33 points last quarter). Last quarter, it was a case of the contraction in imports being greater than the contraction in exports. In the March-quarter 2013, exports contributed 0.4 points, while imports drained 0.9 points from real GDP growth. That reflects the strengthening of private spending overall.
The next graph decomposes the government sector into its parts and reveals that it was the contraction in military spending that did the damage as in the December-quarter 2012.
As I noted when I considered the December-quarter 2012 National Accounts, the world is a better place (in my “peacenik” view) with less US military spending. But the macroeconomist in me says that with unemployment as high as it is and growth is insufficient to make significant dents in to that huge pool of unemployed workers, then the conclusion is that – now is not the time to be cutting overall federal spending in the US.
It would be better if the US government carved into its military spending but at the same times expanded spending on job programs, public infrastructure, public education, public health (and the destruction of the hold that the private insurance industry and the pharmaceutical companies have on health spending in the US), and environmental investments in renewable energy.
Overall, an expansion is required whatever the composition of spending that they choose.
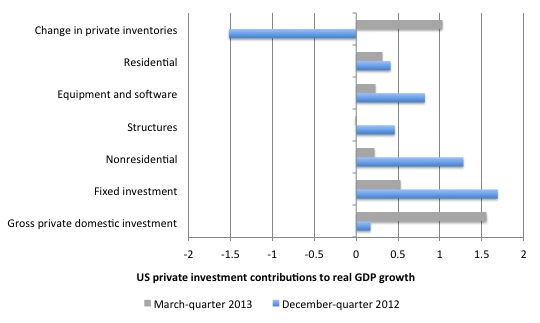
We noted that private investment spending made a strong comeback in the March-quarter 2013 – 1.56 points. However, that is not the full story. The next graph decomposes the spending categories that constitute total gross capital formation.
While overall investment contributed to growth, fixed investment added 0.53 points (down from 1.69), non-residential added 0.22 points (down from 1.28), structures dragged -0.01 points (down from 0.46), equipment and software added 0.23 points (down from 0.82), residential added 0.31 points (down from 0.41), and the change in private inventories added 1.03 points (up from -1.52).
So investment growth was all down to the big swing in inventories, which can be interpreted as an indicator of the start of an inventory cycle that reflects weak demand and a further contraction in output and income in the coming year.
I did some further analysis using – Table 5.6.5B. Change in Private Inventories by Industry – in the BEA’s Interactive Data. The data tells us that there was a huge swing in Farm inventories in the March-quarter 2013 (up by 11.7 per cent) after many quarters of rundown. I cannot tell you which crops actually have been stockpiled (Americans out there – what would farmers stockpile in the depth of winter?).
Manufacturing inventories also rose by 15.5 per cent. Wholesale Trade inventories showed steady growth and down from early growth rates, whereas growth in Retail Trade inventories were also steady over the last 12 months in the 2011 there were several negative quarters.
What does it mean? Farm produce should be plentiful. Overall, it suggests some weakness but then consumption is strong.
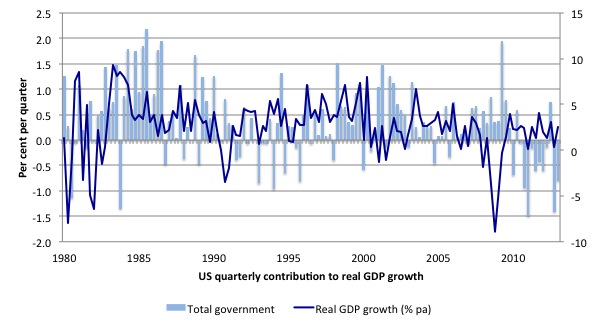
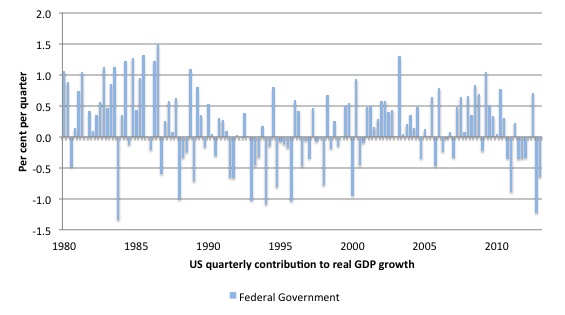
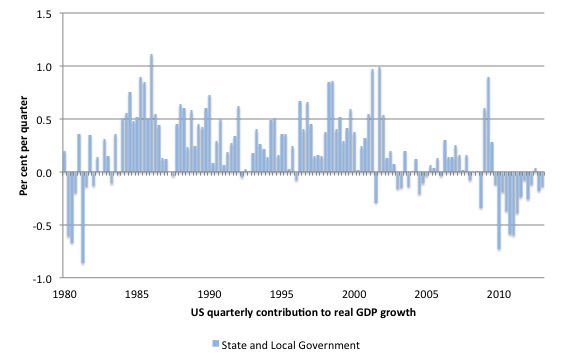
The following sequence of graphs show the contributions to quarterly real GDP growth in the US since the March-quarter 1980 to the December-quarter 2012 by government level (total, federal and state/local in order).
It allows us to see the behaviour of government during the very severe 1982 recession relative to its current behaviour. In the first graph I have superimposed the quarterly percentage real GDP growth (right-axis) to let you see the turning points in the cycle and the recovery aftermath over the course of recent history.
The 1982 downturn began after real GDP growth peaked in July 1981 and it took 16 months to reach the trough in November 1982. There had been an earlier official recession – (see NBER cycle dating) – from January 1980 to July 1980 (a 6-month descent).
The data shows that the US government sector consistently supported growth through the recession (one quarter of contraction) and, importantly, maintained that support in the recovery phase.
That stands in stark contrast to the behaviour of the federal government in the current downturn and recovery.
Since late December 2010, the overall government sector in the US has been undermining real GDP growth. The US government overall started to drag on real growth almost immediately after it had begun. Overall real GDP growth turned positive again in September 2009.
The federal level has been a negative contributor to quarterly real GDP growth for 8 of the last 12 quarters. That should put in perspective the claims that “we tried aggressive fiscal policy and it didn’t work”.
The correct statement is that the US government injected a stimulus throughout 2008 and maintained it until September 2009, whereupon it got pressured by conservative forces to cut back.
The situation is even worse at the State and Local government levels.
Since March 2008, state and local governments together have been negative contributors to real GDP growth in 16 of the 20 quarters, and every quarter since September 2010.
If you consider the previous recession periods, both levels of government were running counter-cyclical strategies (contributing positively to growth) in contrast to the present recession.
This is especially so when you consider the State and Local governments. However, in recent quarters it is the Federal government that is draining growth more than its state and local counterparts.
Conclusion
Is the real GDP growth rate fast enough in the US? That depends on what the aim is. In relation to the output gap, the answer is no! In relation to productivity and labour force growth the answer is probably no (although labour productivity growth has slowed a little).
But the current growth rate is below that necessary to make serious inroads into the massive pool of underutilised labour.
The US government is choosing to allow long-term unemployment to continue to rise. There is no fiscal justification for that. They should explain why they consider undermining growth and deliberately maintaining people in a state of unemployment is a sensible option for their nation.
Meanwhile – back in Australia
The Prime Minister came out with the fiscal contraction expansion rhetoric today. The revenue expected for the 2012-13 fiscal year is now much lower than they have expected when the May 2012 budget was brought down – some $A12 billion lower.
That should come as no surprise given external developments and the fact that GDP growth here is falling and is now well below trend. In part, that is due to the government’s own austerity program as it obsessively pursued a budget surplus for this year.
Given the state of private domestic demand and the external drain on demand they were never going to be able to achieve a surplus anyway. They ignored that advice and tried anyway, and, in doing so, they further damaged the economic prospects such that unemployment is now starting to rise sharply.
Today the PM said that (reported by ABC – Gillard flags budget of spending cuts and tax hikes) that her government will have to make “urgent and grave” budget cuts – both in the form of tax hikes and spending cuts.
Then she lied:
… the Government will not “artificially chase” the revenue downgrades in a way that would put jobs and growth at risk.
Of-course they will cuts jobs growth and overall growth if they cut spending and increase taxes. Of-course unemployment will continue to rise. Of-course national income will, initially not grow as fast, and may even contract altogether if they cut hard enough.
Why lie about it?
Why not admit they are in the sway of neo-liberal advisers who think it is better trying to run a surplus and failing than creating work and reducing unemployment?
That is enough for today!
(c) Copyright 2013 Bill Mitchell. All Rights Reserved.
Bill,
Did you see Ross Garnaut on the 7:30 Report this evening.
He’s either a fool or one of the most evil individuals in the country.
Here’s some Ross Garnaut quotes from the 7:30 Report:
“we should be saving two or three per cent more of GDP in budget surpluses or we’d end up in the dog days when the resources boom ended.”
“We’ve been spending too much ever since the terms of trade started to rise with the sole exception of the year after the depths of the Global Financial Crisis.”
“I don’t want to get into individual payments, but across the whole level of government expenditure there needs to be a reduction in real terms, across the whole level of incomes after tax, there needs to be a reduction.”
The producers of the 7:30 program should kill themselves if Ross Garnaut is the best they can do when seeking expert economic comment.
‘
About all you can say is that in the race for biggest idiot the Europeans have got us beat so far.
Bill :
I hope you saw Krugman this morning in the New York Times. He’s basically singing from our song sheet: “the economy is not like an individual family”, “government borrowing doesn’t crowd out private investment”, “my spending is your income and your spending is my income.” Of course, it’s not all good as he also states, “by all means let’s try to reduce deficits and bring down government indebtedness once normal conditions return…”
But the key takeaway is “the drive for austerity has lost its intellectual fig leaf, and stands exposed as the expression of prejudice, opportunism and class interest it always was.” So the fallout from the Rogoff/Reinhart debacle continues. I think we in the MMT crowd have something to smile about right now. The NYT editorial from yesterday echoes your position in this blog the US GDP increase masks a greater underlying problem. Briefing.com on Friday stated that “More worrisome, the breakdown of the data shows a severe deceleration of trends during the second quarter as nearly all of first quarter gains came from sectors, namely consumption and inventories, which are likely to experience a pullback over the next three months. Furthermore, government spending, which fell 4.1% in the first quarter after declining 7.1% in Q4 2012, is set to fall by a larger amount in the second quarter as the effects of the sequestration become more pronounced.”
The problem is I doubt the GOP deficit terrorists will draw anything other than the exact opposite conclusion.
Yes Alan, and how about this (from the transcript):
“Well, interest rates at extremely low levels and that’s been augmented over the last couple of years in the United States and over the last six months in Japan by what’s called quantitative easing, special policies to push out into the economy huge amounts of money, which has had the effect of reducing their exchange rates”
Every dollar/yen/pound of which is safely sequestered in central bank reserves. Maybe some shonky bank’s toxic MBSs got converted into reserves that could be handy for paying tax but my understanding is that it was mainly gilts and treasuries.
It’s been a trying week for anybody with a grasp of the monetary realities, with worse to come.
Gillard’s equating “John’s” household budget with the national accounts was excruciating, just a more convoluted version of that moron Hockey’s “living within our means”.
Melia,
On the ABC’s “Insiders” last Sunday “Global Mail” journo Mike Seccombe made similar comments. He even referred to Reinhart/Rogoff, which his fellow guests probably thought was a cake recipe.
After declaring Austerity and the Thatcher/Reagan/Chicago school trickledown economics era over, he said “we were now looking for something new”
I sent him an email suggesting where he might find it.