I am late today because I am writing this in London after travelling the last…
Australian Labour Force data – bad news again
I have very limited time today as I am heading to the airport soon and have a full set of commitments once I get to where I am going. But today the Australian Bureau of Statistics (ABS) released the Labour Force data for December 2010. As usual the bank economists got it wrong and grossly overestimated the growth in employment (last month they grossly overestimated it). Today’s data shows that the labour market has falling in a heap – employment growth is barely above the zero line and the participation rate fell sharply. While this combination led to a decline in unemployment and the unemployment rate it just meant that we have traded unemployment for hidden unemployment – not a good option. The situation is now very unclear and the impact of the natural disasters that have consumed Queensland and are heading south will clearly cause a contraction in real economic activity in the coming months before the reconstruction phase gets into gear. If the Federal government continues with its moronic line that it will see oversee a net contraction in fiscal policy despite promising billions for the reconstruction phase then the labour market will contract. This will mean that the modest gains in reducing labour underutilisation that we have seen in the recovery period to date will probably be lost – mining boom notwithstanding. Today’s data definitely doesn’t support the claims by the Government and the RBA that there is an inflation threat building and fiscal and monetary policy should contract. The data tells me exactly the opposite is the case. There is still plenty of slack in the Australian labour market and employment growth is doing nothing to mop it up.
The summary ABS Labour Force (seasonally adjusted) estimates for December 2010 are:
- Employment barely increased – 2,300 (+0.02 per cent) with full-time employment increasing by 1,700 and part-time employment increasing by 600. For all intents and purposes there has been no net job creation in Australia during December.
- Unemployment decreased 25,400 to 598,700.
- The official unemployment rate fell by 0.2 points to 5.0 per cent.
- The participation rate fell by 0.2 percentage points to 65.8 per cent and reverses the trend in recent months. It suggests that the labour market is slackening again as the pace of economic growth slows.
- Aggregate monthly hours worked decreased 3.4 million hours (0.2 per cent) – a fairly sharp drop
- The quarterly labour underutilisation estimates for November showed that underemployment fell from 7.3 per cent in the third-quarter to 7.1 per cent as a result of the growth in full-time employment. Total labour underutilisation (computed by the ABS as the sum of underemployment and unemployment) was estimated to be 12.4 per cent down from 12.5 per cent in the August quarter. This data is released quarterly with the next release due in February. But with a virtually flat-line employment situation and hours worked decreasing in December I expect underemployment to edge up a little since the November quarter figures were published. Still an appallingly high rate of labour underutilisation though.
So the summary tells us that there has been virtually no employment growth and hours worked has decreased. The fall in unemployment is largely due to the participation rate declining which means that the officially unemployed have become hidden unemployed. Overall, today’s data release is not good news and tells us that the Australian economy is not growing as strongly as many thought it would.
The news at the moment in Australia is being dominated – as you would expect – by the massive floods in Queensland which have now engulfed Brisbane. The flooding is heading south and more towns will be submerged in the coming weeks.
The ABC news report carried the headline – Fewer people sought work in December while the Sydney Morning Herald report chose to run with the misleading headline – Jobless rate sinks to 5% .
News Limited – via The Australian – also chose to misrepresent the situation with the headline – Jobless rate falls to two-year low and accompanied the story with a large picture of a “construction site in central Sydney” despite the construction industry contracting in recent months.
The ABS report was the most accurate saying that despite the fall in unemployment:
… the data was not seen as good news by financial markets because the lower rate came from a decline in the number of people looking for work.
Despite the headline that conjured up good tidings, the SMH article did quickly tell its readers that “drop in the unemployment rate came mostly as a result of fewer people looking for work at the end of 2010”. This is not accurate. The drop in unemployment came purely because of the drop in participation.
But then the SMH article chose to highlight what it called “robust jobs figures … in recent years”. I don’t consider anything I have seen in recent years with respect to labour market data being “robust”. Theh data has not been disastrous as we have in the US and Europe but hardly robust. Unemployment is still 1 percentage points higher and underemployment has sky-rocketed.
And yes, the bank economists got it wrong – predicting that employment would rise by at least 25,000.
The other uncertainty at present (given the floods etc) is that yesterday’s ABS Job Vacancies, Australia data (for November) which was released yesterday showed a strong growth in vacancies. I am considering that data at present in the light of today’s release. What the vacancies data does show us is that there are sharp regional differences in the implied growth performance of the economy with unemployment-vacancy ratios being lower in the mining states than elsewhere. But today’s data shows that the static employment growth outcome is spread across all states and is more recent data than the vacancy data (which was for the November quarter).
Employment growth plunges to zero
The December data shows that employment growth was up by the barest margin – 0.02 percentage points while the labour force contracted by 0.2 points, which meant that unemployment fell a little but for the wrong reasons.
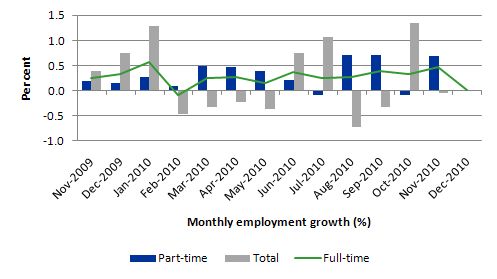
Neither full-time or part-time employment growth was strong.
The following graph shows the month by month growth in full-time (blue columns), part-time (grey columns) and total employment (green line) from November 2009 to December 2010 using seasonally adjusted data. The picture has been mixed over the last 12 months with employment growth averaging 0.3 points (full-time 0.3 points ; part-time 0.2 points).
The data is indicating that there is no growth trend emerging although if the investment intentions of the private sector for 2011 remain (as recorded by the ABS) and are realised then this flat situation should improve.
The real worry is the declining labour force growth rate (more about which later) which saved us from a worsening unemployment situation. Much more employment growth is needed if unemployment and underemployment are to fall significantly given that participation will rise if there are signs of stronger growth.
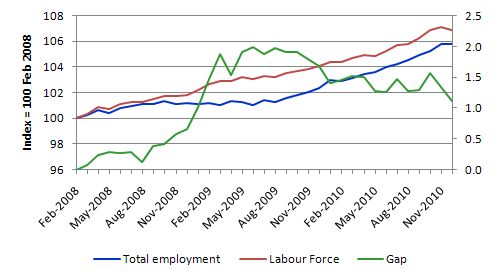
To put the recent data in perspective, the following graph shows the movement in the labour force and total employment since the low-point unemployment rate month in the last cycle (February 2008) to November 2010. The two series are indexed to 100 at that month. The green line (right-axis) is the gap (plotted against the right-axis) between the two aggregates and measures the change in the unemployment rate since the low-point of the last cycle (when it stood at 4 per cent).
The Gap series gives you a good impression of the asymmetry in unemployment rate responses even when the economy experiences a mild downturn (such as the case in Australia). The unemployment rate jumps quickly but declines slowly.
It also highlights the fact that the recovery is still not strong enough to bring the unemployment rate back down to its pre-crisis low. You can see clearly that the unemployment rate fell in late 2009 and no improvement has been made in the course of this year although that is in part because of the rising participation rate.
However, the decline in unemployment in December is mostly due to a decline in the participation rate (see the plunge in the Labour Force). So while the unemployment rate fell to 5.0 per cent in December, this is nothing to be happy about given that hidden unemployment almost certainly rose (with the declining participation rate).
Employment growth for teenagers
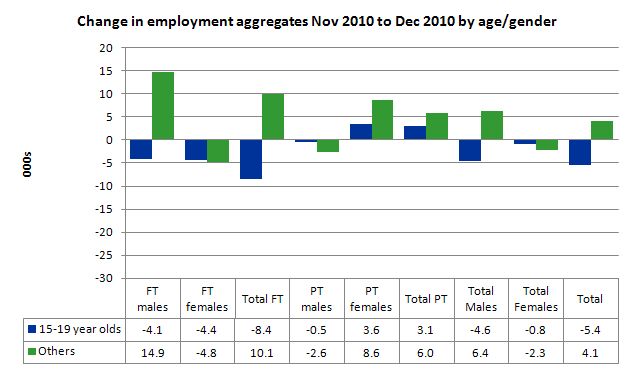
After some signs in November that teenagers (15-19 year olds) were experiencing modest employment growth after several months of zero or declining growth (although it was mostly part-time in nature), the data for December shows a sharp drop in net full-time employment (for both males and females) and a modest rise in part-time work (exclusively female).
At a time when we keep emphasising the future challenges facing the nation in terms of an ageing population and rising dependency ratios the economy still fails to provide enough work (and on-the-job experience) for our teenagers who are our future workforce.
The following graph shows the distribution of net employment creation in the last month by full-time/part-time status and age/gender category (15-19 year olds and the rest).
While adult employment growth was positive but just, teenage employment contracted overall in December by 5.4 thousand jobs.
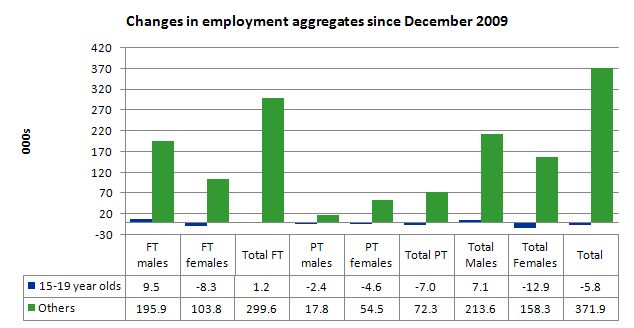
To put this month’s figures in perspective though, the following graph shows the change in aggregates since December 2009. There you see that in the recovery period of the last 12 months, teenagers have gone backwards – the jobs market has been shrinking for them.
There is no good spin you can put on that performance.
While some will point to the fact that the teenage unemployment rate fell in November from 16.9 per cent in November 2010 to 16.5 per cent the other fact that drove that result is that the participation plunged by 0.6 points (seasonally adjusted). This was also a period when the school year had finished so it is hard to construct this decline in participation as a return to education.
I also note that the November broad labour underutilisation data from the ABS recorded an underemployment rate for 15-24 year olds of 13.7 per cent (and increasing from the September quarter). With the only employment growth for teenagers being part-time I expect this figure to rise when the data is released next in February.
The fact that there is around 25 per cent for under 24 year olds (who are seeking work) idle at present (sum of unemployment and underemployment) then you realise there is still a lot of excess capacity that can be tapped via the creation of appropriate job/training slots.
At present, my summary is that the recovery that is occurring in the Australian economy is not providing any significant opportunities for our youngest workers. These workers are our future. We talk of the intergenerational demands on public spending and rising dependency ratios. But then we allow 25 odd percent of our active youth to remain idle and outside the skill development process. This waste ensures our future productivity growth will be lower than it otherwise could be.
How can we be happy about an economy that shuts out our youth from the recovery?
Unemployment
The unemployment rate fell by 0.2 points in December r rising sharply from 5.1 per cent to 5.4 per cent in October 2010. While employment growth had been faltering in recent months and failed to outstrip the growth in the labour force the situation improved this month.
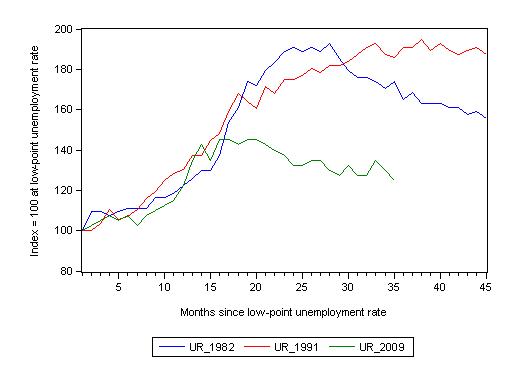
The following graph updates my 3-recessions graph which depicts how quickly the unemployment rose in Australia during each of the three major recessions in recent history: 1982, 1991 and 2009 (the latter to capture the 2008-2010 episode). The unemployment rate was indexed at 100 at its lowest rate before the recession in each case (June 1981; November 1989; February 2008, respectively) and then indexed to that base for each of the months as the recession unfolded.
I have plotted the 3 episodes for 45 months after the low-point unemployment rate was reached. (although the current episode has only endured for 35 months). For 1991, the end-point shown is the peak unemployment which was achieved some 38 months after the downturn began although the recovery was painfully slow. While the 1982 recession was severe the economy and the labour market was recovering by the 26th month. The pace of recovery for the 1982 once it began was faster than the recovery in the current period.
It is significant that the current situation while significantly less severe than the previous recessions is dragging on given the lack of private spending growth.
The graph provides a graphical depiction of the speed at which the recession unfolded (which tells you something about each episode) and the length of time that the labour market deteriorated (expressed in terms of the unemployment rate).
From the start of the downturn to the 35-month point (to November 2010), the official unemployment rate has risen from a base index value of 100 to a value 125 – peaking at 145 after 21 months. At the same stage in 1991 the rise was 185 (and decreasing) and in 1982 – 174 (and falling in spurts).
So while the current downturn has been a very different type of episode relative to our previous experiences the trend in unemployment is far from being downwards.
Note that these are index numbers and only tell us about the speed of decay rather than levels of unemployment. Clearly the 5.0 per cent at this stage of the downturn is lower that the unemployment rate was in the previous recessions at a comparable point in the cycle although we have to consider the broader measures of labour underutilisation (which include underemployment) before we draw any clear conclusions.
At the same period in the recovery (using quarterly data), the broad labour underutilisation rate (unemployment plus underemployment) had an index value of 156 in the 1982 recession (absolute value of 12.5 per cent); an index value of 184 in the 1991 recession (absolute value of 18 per cent); and an index value of 125 in the current period (absolute value of 12.4 per cent).
So while the level of unemployment is much lower now than in the 1982 recession (at a comparable stage), underemployment is now much higher and so the total labour underutilisation rates are similar.
Commentators who think of the 1982 recession as severe, rarely see it in these terms. Joblessness is probably worse than underemployment but both mean that labour is wasted and income earning opportunities are being foregone. For a worker with extensive nominal commitments, the loss of income when hours are rationed may be no less severe than the loss of hours involved in unemployment, if the threshold of solvency is breached.
Aggregate participation rate down
The participation rate fell by 0.2 percentage points in December 2010 which explained why unemployment also fell given the static employment growth.
The labour force is a subset of the working-age population (those above 15 years old). The proportion of the working-age population that constitutes the labour force is called the labour force participation rate. So changes in the labour force can impact on the official unemployment rate and so movements in the latter need to be interpreted carefully. A rising unemployment rate may not indicate a recessing economy.
The labour force can expand as a result of general population growth and/or increases in the labour force participation rates.
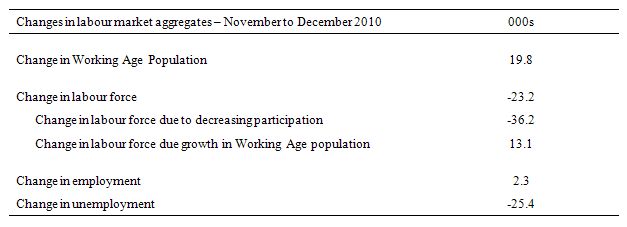
The following Table shows the breakdown in the changes to the main aggregates (Labour Force, Employment and Unemployment) and the impact of the fall in the participation rate.
In December 2010, employment rose by 2.3 thousand while the labour force fell by 23.2 thousand which meant that unemployment fell by 25.4 thousand. The impact of the fall in the participation rate on the falling labour force was equivalent to an decline of the magnitude of 36.2 thousand workers who would otherwise have been actively looking for work. The offset to the participation impact on the labour force was the extra 13.1 thousand workers looking for work as a result of growth in the working age population which is steady from month to month.
So this month the labour market was spared a worsening unemployment situation given the static employment situation. While the economy did not add any net jobs (virtually) the population growth component of the growth in the labour force was more than offset by the falling participation rate (rising hidden unemployed). The result is that the labour market traded unemployment workers for hidden unemployment which is no gain at all.
If the participation rate had have remained at the November 2010 level then the unemployment rate would have been 5.3 per cent – that is a rise of 0.1 per cent on the November figure. Instead it dropped to 5 per cent. But the real dynamic in the labour market is a rise in labour underutilisation although some of that rise has been disguised (0.3 points).
Hours worked fall in December
Monthly hours worked barely rose (0.04 per cent) in November 2010 which suggested a slowing economy. The outcome worsened in December with Aggregate monthly hours worked decreasing by 3.4 million hours (0.2 per cent). The ABS data suggests the trend is up in December but the reality is that the situation is flat if not declining.
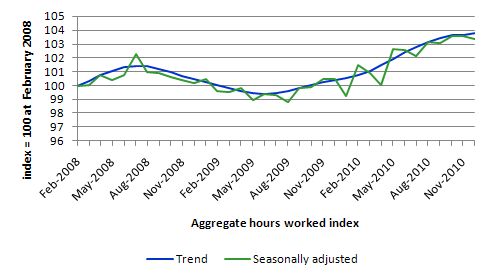
The following graph shows the trend and seasonally adjusted aggregate hours worked indexed to 100 at the peak in February 2008 (which was the low-point unemployment rate in the previous cycle).
The graph shows that the pace of the recovery is slow but barely positive.
Conclusion
While last month’s Labour Force estimates were good the struggle was always going to be to maintain the trend given many other indicators were signalling otherwise. The situation is now very unclear and the impact of the natural disasters that have consumed Queensland and are heading south (it is pouring as I type this in Melbourne) will clearly cause a contraction in real economic activity in the coming months before the reconstruction phase gets into gear.
If the Federal government continues to run its moronic line that it will see oversee a net contraction in fiscal policy despite promising billions for the reconstruction phase (that is, it is mindlessly reciting the mantra that despite the need for recovery relief it will still record a surplus in 2012-13) then the labour market will contract. This will mean that the modest gains in reducing labour underutilisation that we have seen in the recovery period to date will probably be lost – mining boom notwithstanding.
There is still a lot of slack left to be mopped up and employment growth is clearly not strong enough at present to make any serious dent in the pools of idle labour.
The static employment growth this month combined with the sharp decline in participation is a bad combination. I agree that we do not want to put to much spin on the month-to-month movements in this data given the sampling variability that pervades the ABS exercise but there are several indicators which are pointing in the same direction at present (for example, the net exports figures released earlier this week by the ABS).
The biggest fear I have is that the Federal government will actually try to reduce the budget deficit by discretionary cuts in spending (notwithstanding the disaster relief it will have to provide given the scale of the flooding). If they do pursue that course of action – and the signs are that they will – then the labour market will deteriorate with the declining economic growth that will follow.
Must rush to the airport. It has been a fun way to spend my lunch break – typing.
That is enough for today!
I don’t know how you do it Bill. You have limited time on many occasions yet you still are able to construct extremely insightful and detailed analysis of events as and when they occur and I am guessing from an airport lounge or on a tarmac. 😉
As an aside, and I know this does not really conform to the purposes of this blog (MMT economics) however would be very interested to read your take on how the economy will deal with the flood disaster and probably more importantly how you feel the government will respond. Australia is in for an interesting couple of years with regards construction, inflation and employment as a result of the floods while dealing at the same time with the mining boom.
Your view is often quite aside from mainstream economists and as such I enjoy reading your daily take on important matters.
regards,
neale
Interesting. Thanks. What does 2011 hold for us? Should I give up my recent short bout of optimism?
Lo and behold, Australians are “fully employed” once again as the unemployment rate now stands at 4.98%. Well, at least that is what the papers are telling us today with their quotes from the economists.
Kind of more predictable than a dog salivating at the sound of a bell, the mainstream calling for higher rates during the year (although those pesky floods may spare us for a few months yet).
I wonder how the thousands of poor sods without homes at the moment (and many without specific and expensive flood insurance) feel about their welfare?
There is a perfect opportunity to reduce youth un/underemployment this year during the flood rebuilding process but I am guessing that just because the headline hit 5% both the Government and RBA will think the job is done.
I am sure Bill is considering closing the CofFEE shop too now that utopia has been attained. lol
Dear Neale M (at 2011/01/14 at 8:09)
Yes I read the reports and they singularly fail to mention that if the participation rate had not have fallen then the unemployment rate would have risen in December. The nuances of the labour force framework are not something the journalists want to worry about – although instead of quoting the endless line of bank economists – they could actually fill up their copy with some educative material for their readers.
best wishes
bill
I enjoy reading your website because the official figures are at variance to what I directly observe and know about my local community.
Flipping through the financial press for signs of any MMT lessons learned usually reveals…nothing. It’s getting tiresome trying to keep up! Felix Salmon this week has a straight-faced discussion on his blog about why “the US won’t default, even if the debt ceiling stays.” It’s truly amazing how embedded the gold standard groupthink is in the economics press. I can only scratch my head so much!
http://blogs.reuters.com/felix-salmon/2011/01/13/the-us-wont-default-even-if-the-debt-ceiling-stays/
Bill, I’d like to hear your views on this paper on a blog sometime:
http://www.sciencedirect.com/science?_ob=ArticleURL&_udi=B6WJ3-4XFGJK2-3&_user=10&_coverDate=11%2F30%2F2009&_alid=1607694802&_rdoc=9&_fmt=high&_orig=search&_origin=search&_zone=rslt_list_item&_cdi=6867&_sort=r&_st=4&_docanchor=&_ct=313756&_acct=C000050221&_version=1&_urlVersion=0&_userid=10&md5=59dd16c8f53f449dcee16ad267173d81&searchtype=a
What – or who – started the great depression?
By Lee E. Ohanian
Herbert Hoover. I develop a theory of labor market failure for the Depression based on Hoover’s industrial labor program that provided industry with protection from unions in return for keeping nominal wages fixed. I find that the theory accounts for much of the depth of the Depression and for the asymmetry of the depression across sectors. The theory also can reconcile why deflation/low nominal spending apparently had such large real effects during the 1930s, but not during other periods of significant deflation
Thanks for the post Bill.
The Commonwealth Gov response to the Floods is so off the mark. No one would hold them to the surplus promise after an unforeseen event of this size occurs. It is moronic to continue to talk about surplus budgets in the face of disaster.
My friend Barb lives in a town house complex in Long Street Chelmer Brisbane. Water entered the first floor from the west and exited via the ground floor garage door after making its way down the stairs and buckling the garage door. The water damage is one thing, the mud that is in the water is the real damage agent. When I arrived in Barb’s Street to help her I was in shock for about 20 min, after that it was OK to work in.
As part of the mud army 15 volunteers worked all day last Saturday to “clean the townhouse”. Carpet came out first. Petrol driven high pressure hoses were used along with brooms and hands to de-mud the townhouse. Once the mud was out the plaster board walls and ceiling were removed and the electrical made safe for when it gets turned back on in a few months time. The kitchen came out and then the yard was squeezed of mud 5cm thick. The mud smells like an old style pig pen. So my friend Barb is left with a townhouse shell that will hopefully dry out over the next few months. We hope the floor will be ok and perhaps some of the electrical will be ok after test. 90% of Barb’s personal possessions including funiture, all apliances and clothing ended up in a big pile outside the townhouse ruined by mud. The mud is so fine it gets behind the plaster walls coating the inside of every wall with a fine layer of stinking mud. The mud must be super fine like dust to get in the walls the way it does. Anyway while we were working on Barb’s place every townhouse in the complex of 27 had at least 10 volunteers working on the clean up. Thats over 300 people working like ants making ever increasing mounds of wet muddy possessions in front of each townhouse. The mounds of ruined possessions eventually joined up into one long windey line of (now) rubbish two meters high. The same exercise was been undertaken in every flooded street in Brisbane all on the same day.
The solution to the funding problem offered by Swan is to ask big private business to donate more money. He must be DELUDED if he thinks that is what he was elected for. A bit of leadership puting Barb’s needs first is whats needed not stuffing the country up by not printing a few billion to rebuild the communities devestated by the floods. I am dissapointed that we have no leaders that will put the peoples needs first. Instead our leaders have both eyes on getting re-elected on the “we returned to surplus” mantra. Idiots. I will try and post a photo of Barb’s for you.
Cheers Punchy