Today (January 22, 2026), the Australian Bureau of Statistics (ABS) released the latest labour force…
Australian Labour Force data – nothing to be happy about
According to everyone (bar me) we have an economy that is facing major skill shortages and going gang busters under the steam of the once-in-a-hundred-years mining boom. Today the Australian Bureau of Statistics (ABS) released the Labour Force data for January 2011 which would seem to contradict that impression. Today’s data shows that the labour market is anything but strong and bursting at is capacity seams. Total employment growth was modest and not strong enough to absorb the labour force growth and as a result unemployment rose. But the really telling news is that full-time employment declined sharply as did total working hours. Employment growth was driven solely by part-time employment and that means underemployment will have risen as well. Today’s data definitely doesn’t support the claims by the Government and the RBA that there is an inflation threat building and fiscal and monetary policy should contract. The data tells me exactly the opposite is the case. There is still plenty of slack in the Australian labour market and employment growth is doing nothing to mop it up. Its not my opinion – just take a look at the data! There is nothing to be happy about in today’s data.
The summary ABS Labour Force (seasonally adjusted) estimates for January 2011 are:
- Employment increased – 24,000 (+0.2 per cent) but full-time employment declined by 8,000 and part-time employment increased by 32,000.
- Unemployment increased 8,900 to 606,500.
- The official unemployment rate was static at 5.0 per cent.
- The participation rate rose by 0.1 percentage points to 65.9 per cent which indicates more workers are looking for work.
- Aggregate monthly hours worked decreased 12.7 million hours (0.8 per cent) – a fairly sharp drop and the third consecutive monthly drop. This trend is accelerating.
- The quarterly labour underutilisation estimates for November showed that underemployment fell from 7.3 per cent in the third-quarter to 7.1 per cent as a result of the growth in full-time employment. Total labour underutilisation (computed by the ABS as the sum of underemployment and unemployment) was estimated to be 12.4 per cent down from 12.5 per cent in the August quarter. This data is released quarterly with the next release due in February. But with a virtually flat-line employment situation and hours worked decreasing in December I expect underemployment to edge up a little since the November quarter figures were published. Still an appallingly high rate of labour underutilisation though.
So the summary tells us that employment growth is modest and total hours worked continue to decline. The rise in unemployment is due employment growth being too weak to absorb the new entrants.
Overall, today’s data release is not good news and tells us that the Australian economy is not growing as strongly as many thought it would.
As many readers will realise Eastern states in Australia are weathering the effects of severe flooding. As a cautionary note, the ABS reported that the massive floods in Queensland, particularly, have interrupted the Labour Force Survey in the last month and some of the estimates may be unreliable. We will have a better idea of that in next month’s release.
The ABC News carried the headline – Unemployment rate steady at 5 per cent and among the quotes from the bank economists (who got it wrong again) was this astounding piece of nonsense from one “senior” economist:
This is a pretty healthy labour market and it’s getting tighter and we are getting pretty close to full employment … “It’s very consistent with the RBA’s tightening bias and we still expect them to deliver two [rate] hikes this year … late in the second quarter and then [again] in the fourth quarter.
Sorry, the data shows that the labour market became looser – falling full-time employment, falling total hours worked, rising underemployment, rising unemployment.
And what does being very consistent with the RBA’s tightening bias mean? And economy that is slowing is indicative that any demand effects from the RBA’s previous interest rates hikes are having their effect (whether it is the rate hikes that are slowing the economy down is another matter and is disputable). So why would the RBA want to slow it down even further when all the quantity and volume indicators are pointing south – including inflation.
These bank commentators are like those dolls that you turn a key in their back and they prance around awkwardly for a few moments until the next time the key is turned. The mantra is always the same … closer to full employment, rate hikes coming.
The Australian economy is nowhere near full employment!
Employment growth not strong enough to absorb new entrants
The January data shows that employment growth barely rose – 0.2 percentage points and was exclusively driven by part-time employment. Full-time employment fell. The labour force grew by 0.3 points, which means that employment growth was not strong enough to absorb the new entrants and as a result unemployment rose.
The rising part-time employment will certainly signal a rise in underemployment (that data will come out next month).
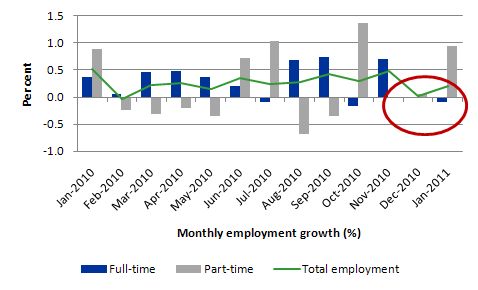
The following graph shows the month by month growth in full-time (blue columns), part-time (grey columns) and total employment (green line) from January 2010 to January 2011 using seasonally adjusted data. The picture has been mixed over the last 12 months with employment growth averaging 0.2 points (full-time 0.3 points; part-time 0.2 points).
The data is starting to indicate a declining trend in full-time employment growth – with 3 of the last four months being either negative or zero. See red circle for emphasis. So the economy is adding jobs net but this is being dominated by part-time employment which means increased casualisation and a growing number of low-skill, low-paid, underemployed jobs. Not the sign of a tightening labour market at all.
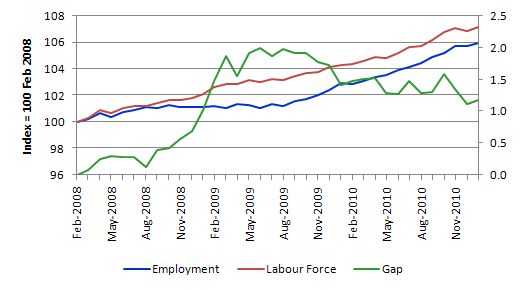
To put the recent data in perspective, the following graph shows the movement in the labour force and total employment since the low-point unemployment rate month in the last cycle (February 2008) to January 2011. The two series are indexed to 100 at that month. The green line (right-axis) is the gap (plotted against the right-axis) between the two aggregates and measures the change in the unemployment rate since the low-point of the last cycle (when it stood at 4 per cent).
The Gap series gives you a good impression of the asymmetry in unemployment rate responses even when the economy experiences a mild downturn (such as the case in Australia). The unemployment rate jumps quickly but declines slowly.
It also highlights the fact that the recovery is still not strong enough to bring the unemployment rate back down to its pre-crisis low. You can see clearly that the unemployment rate fell in late 2009 and no improvement has been made in the course of this year although that is in part because of the rising participation rate.
We are now in a period where the recovery has weakened and employment growth is struggling to reduce the pool of unemployed – the gap is now flattening as we limp along.
Negative employment growth for teenagers
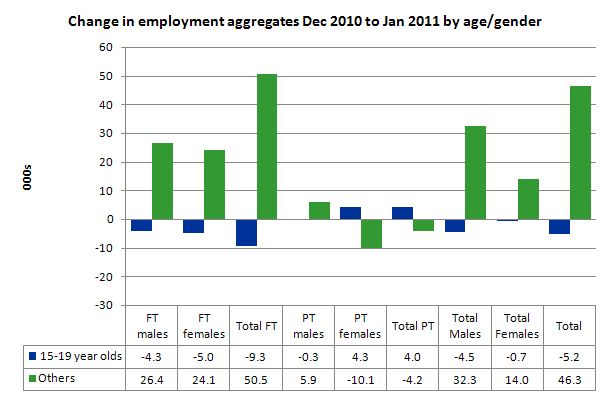
The evidence continues to show that the Australian labour market is excluding teenagers (15-19 year olds) from any employment growth. Teenage employment growth in the last month was negative losing 5,200 jobs (net) and that has been a continuing trend over several months.
There was a sharp decline in net full-time employment (for both males and females) – 9,300 jobs lost and a less than compensating rise in part-time work (exclusively female). Young males lost out absolutely.
At a time when we keep emphasising the future challenges facing the nation in terms of an ageing population and rising dependency ratios the economy still fails to provide enough work (and on-the-job experience) for our teenagers who are our future workforce.
The following graph shows the distribution of net employment creation in the last month by full-time/part-time status and age/gender category (15-19 year olds and the rest).
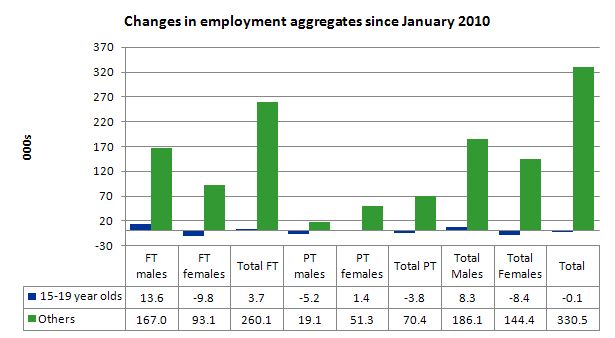
To put this month’s figures in perspective though, the following graph shows the change in aggregates since January 2010. There you see that in the recovery period of the last 12 months, teenagers have gone backwards – the jobs market has been shrinking for them.
There is nothing good that you can say about that performance. It makes a mockery of those (like the bank economists and our politicians) who claim we are close to full employment. An economy that excludes its active teenagers from any employment growth at all is not one that is using its existing capacity to its potential.
The longer-run consequences of this teenage “lock out” will be very damaging.
I also note that the November broad labour underutilisation data from the ABS recorded an underemployment rate for 15-24 year olds of 13.7 per cent (and increasing from the September quarter). With the only employment growth for teenagers being part-time I expect this figure to rise when the data is released next in February.
The fact that there is around 25 per cent for under 24 year olds (who are seeking work) idle at present (sum of unemployment and underemployment) then you realise there is still a lot of excess capacity that can be tapped via the creation of appropriate job/training slots.
At present, my summary is that the recovery that is occurring in the Australian economy is not providing any significant opportunities for our youngest workers. These workers are our future. We talk of the intergenerational demands on public spending and rising dependency ratios. But then we allow 25 odd percent of our active youth to remain idle and outside the skill development process. This waste ensures our future productivity growth will be lower than it otherwise could be.
How can we be happy about an economy that shuts out our youth from the recovery?
Unemployment
The unemployment rate remained unchanged in January at 5 per cent. This is was the combination of a slight rise in the participation rate not being absorbed by the very modest employment growth. Overall, the labour market is still weak with significant excess capacity available in most areas.
The following graph updates my 3-recessions graph which depicts how quickly the unemployment rose in Australia during each of the three major recessions in recent history: 1982, 1991 and 2009 (the latter to capture the 2008-2010 episode). The unemployment rate was indexed at 100 at its lowest rate before the recession in each case (June 1981; November 1989; February 2008, respectively) and then indexed to that base for each of the months as the recession unfolded.
I have plotted the 3 episodes for 45 months after the low-point unemployment rate was reached. (although the current episode has only endured for 35 months). For 1991, the end-point shown is the peak unemployment which was achieved some 38 months after the downturn began although the recovery was painfully slow. While the 1982 recession was severe the economy and the labour market was recovering by the 26th month. The pace of recovery for the 1982 once it began was faster than the recovery in the current period.
It is significant that the current situation while significantly less severe than the previous recessions is dragging on which is a reflection of the lack of private spending growth and declining public spending growth.
The graph provides a graphical depiction of the speed at which the recession unfolded (which tells you something about each episode) and the length of time that the labour market deteriorated (expressed in terms of the unemployment rate).
From the start of the downturn to the 36-month point (to January 2011), the official unemployment rate has risen from a base index value of 100 to a value 125 – peaking at 145 after 21 months. At the same stage in 1991 the rise was 191 (which was close to its peak) and in 1982 – 164 (and falling in spurts).
So while the current downturn has been a very different type of episode relative to our previous experiences the trend in unemployment is far from being downwards.
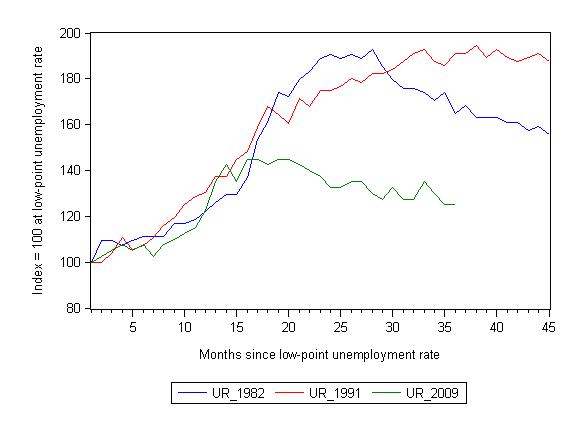
Note that these are index numbers and only tell us about the speed of decay rather than levels of unemployment. Clearly the 5.0 per cent at this stage of the downturn is lower that the unemployment rate was in the previous recessions at a comparable point in the cycle although we have to consider the broader measures of labour underutilisation (which include underemployment) before we draw any clear conclusions.
At the same period in the recovery (using quarterly data), the broad labour underutilisation rate (unemployment plus underemployment) had an index value of 156 in the 1982 recession (absolute value of 12.5 per cent); an index value of 184 in the 1991 recession (absolute value of 18 per cent); and an index value of 125 in the current period (absolute value of 12.4 per cent).
So while the level of unemployment is much lower now than in the 1982 recession (at a comparable stage), underemployment is now much higher and so the total labour underutilisation rates are similar.
Commentators who think of the 1982 recession as severe, rarely see it in these terms. Joblessness is probably worse than underemployment but both mean that labour is wasted and income earning opportunities are being foregone. For a worker with extensive nominal commitments, the loss of income when hours are rationed may be no less severe than the loss of hours involved in unemployment, if the threshold of solvency is breached.
Aggregate participation rate rises
The participation rate rose by 0.1 percentage points in January 2011 which helps to explain why unemployment increased despite the modest employment growth.
The labour force is a subset of the working-age population (those above 15 years old). The proportion of the working-age population that constitutes the labour force is called the labour force participation rate. So changes in the labour force can impact on the official unemployment rate and so movements in the latter need to be interpreted carefully. A rising unemployment rate may not indicate a recessing economy.
The labour force can expand as a result of general population growth and/or increases in the labour force participation rates.
The following Table shows the breakdown in the changes to the main aggregates (Labour Force, Employment and Unemployment) and the impact of the fall in the participation rate.
In January 2011, employment rose by 24 thousand while the labour force rose by 32.9 thousand which meant that unemployment rose by 8.9 thousand. The impact of the rise in the participation rate was to push the labour force up by 20.4 thousand extra workers actively looking for work. The other impact on the labour force was the extra 12.5 thousand workers looking for work as a result of growth in the working age population which is steady from month to month.
So this month the labour market saw a worsening unemployment situation despite the employment growth. The population growth component of the growth in the labour force was more than offset by the net employment growth but the extra workers looking for work (via the rising participation rate) meant that the labour market hidden unemployment for visible unemployment – which is no real gain.
If the participation rate had have remained at the December 2010 level then the unemployment rate would have been 4.8 per cent – that is a fall of 0.2 1 points on the December figure. Instead it was static at 5 per cent.
Hours worked fall in January – again
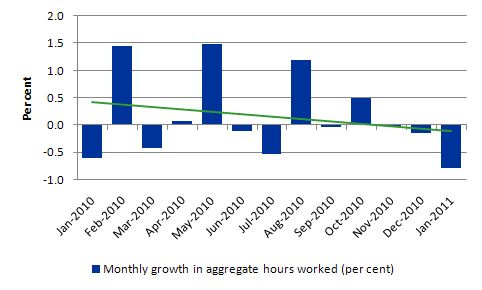
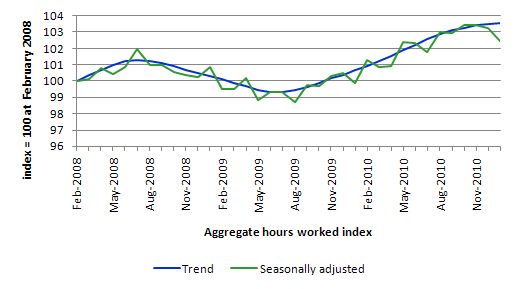
The data shows that total monthly hours worked have fallen for the last three months and the rate of decline is accelerating. In December 2010, aggregate monthly hours worked decreased by 2.6 million hours (0.2 per cent). The downward trend accelerated in January 2011 with aaggregate monthly hours worked decreasing by 12.7 million hours (0.8 per cent).
The official ABS data suggests the trend remains up in January 2011 (on December 2010) but that result is hard to square with the reality.
The following graph shows the trend and seasonally adjusted aggregate hours worked indexed to 100 at the peak in February 2008 (which was the low-point unemployment rate in the previous cycle).
The graph shows that the pace of the recovery is slow but barely positive.
The next graph shows the monthly growth (in per cent) since January 2010. The green linear line is a simple regression trend and it is suggesting monthly growth rates have been in decline all year.
Once again the data doesn’t support the notion of a fully employed labour market.
Why are some people employed?
The conservatives often claim people are unemployed because they lack the skills necessary to meet the available jobs. If that is so, can someone please explain why this person is currently employed?
The Federal Treasurer Wayne Swan wrote an article in the News Limited paper, The Australian today (February 10, 2011) – Levy helps us to pay as we go where he outlined the case for a flood levy.
Swan wrote:
In these circumstances, the best way to fund the vast reconstruction task is to pay as we go. And that’s what we’re doing through a combination of spending cuts, delaying some infrastructure programs and introducing a temporary levy.
As the Prime Minister has said, borrowing to fund the public reconstruction would be the soft option. Instead, by applying some fiscal restraint now, we free up resources to make room for the recovery, so that it doesn’t add to pressure on our growing economy. That makes our plan to bring the budget back to surplus by 2012-13 the right one.
Our strategy has been backed by the Financial Times newspaper and international rating agencies such as Moody’s, which commended Australia’s strong fiscal discipline in dealing with the floods recovery. Fiscal responsibility is also about keeping our budget in a position where it can deal with surprises in the future. Getting back to surplus gives us the firepower to deal with future battles. During the global financial crisis, our strong balance sheet – built in part on difficult savings in our first budget – meant we were immediately able to respond to the crisis with a stimulus program that helped our economy weather the storm.
I could have made that statement a focus for Saturday’s Quiz – like, write an essay of one or two words the second starting with N and finishing with ONSENSE the first whatever profanity you prefer on the day.
First, by cutting back on net public spending (fiscal restraint) the Government only creates “extra room for recovery” by deliberately creating unemployed resources elsewhere and redeploying them. That would only be sensible if it was considered that the flood reconstruction was more important than the present activities that the real resources are tied up in and if the economy was at full employment already and there were idle resources.
I won’t comment on the first of those conditions but the second condition – economy already at full employment – is patently false – as we discussed above.
Second, a growing economy needs pressure to keep growing and ensuring that growth is fast enough to create full employment. Again – economic growth in Australia is well below that rate and so the Government is admitting to deliberately constraining growth and entrenching unnecessary unemployment.
Third, who would suggest that the “Financial Times newspaper” or the “international rating agencies” are arbiters of good judgement when it comes to prudent and responsible fiscal policy.
Fourth, the budget of a sovereign government like in Australia always has the capacity to “deal with surprises”. Running budget surpluses doesn’t improve that capacity. The government can always buy real resources that are for sale in Australian dollars should it need to. The past or present budget status doesn’t increase or decrease that capacity. It is a plain straight-out lie for Swan to say otherwise.
Fifth, when the government runs a surplus it does not save. How can the issuer of the currency (with unlimited issuance capacity) save in its own currency. Saving is about postponing current consumption in favour of a higher capacity for future consumption. A sovereign government never has to worry about whether it can consume later. In that sense, it can “have its cake and eat it too” whereas a non-government entity (household, firm) is financially constrained (being the users of the currency) and so has to save out of today’s consumption possibilities to expand their future consumption (by earning interest).
Earlier in the article, Swan had said that “the job of rebuilding the homes, the businesses and the community infrastructure is immense” and would “require countless tradies and other skilled workers, and thousands of tonnes of material”.
Yes, the same significant volumes/quantities/amounts of real resources will be required whether the government imposes a levy or not.
Anyway, Treasurer Swan clearly doesn’t have the skills for the job. Why is he still employed in it?
I also wonder why this guy has his job. In the Sydney Morning Herald article (February 7, 2011) – Myer boss slams flood levy – the CEO of the Myers shopping empire Bernie Brooks had this to say:
Remember there has been nearly $200 million of donations already made by the general public to assist people in difficulty in the floods and therefore a flood levy to me is not only unnecessary but would take away funds that would be spent elsewhere.
The levy (which I do not support) is for public infrastructure repair – not helping private persons rebuild their homes and regain possessions.
If you don’t know something it is better not to throw your weight around or if you do and mislead then …
Conclusion
The last few month’s Labour Force estimates have now consolidated my impression that the labour market is not growing very strongly. When will all and sundry stop claiming that the labour market is close to bursting and see the trends in the data for what they are?
The situation is also more unclear given the impact of the natural disasters in the last month (floods, bushfires and cyclones).
There is still a lot of slack left to be mopped up and employment growth is clearly not strong enough at present to make any serious dent in the pools of idle labour.
The modest employment growth this month is worrying but the sharp declines in full-time employment and total working hours is very significant and should disabuse those who are claiming the economy is close to full capacity.
The real fear is that if the Federal government continues to run its moronic line that it will oversee a net contraction in fiscal policy despite promising billions for the reconstruction phase (that is, it is mindlessly reciting the mantra that despite the need for recovery relief it will still record a surplus in 2012-13) then the labour market will begin to deteriorate.
Crafty strategy update!
In yesterday’s blog – Destructive economic myths – I outlined a strategy I had devised as a service to humanity, whereby I ripped off the title for my blog yesterday from an article that was published on Monday (February 7, 2011) in the Washington Times – Destructive economic myths. That article was written by a right-wing ideologue and was deeply flawed.
I noted that my blog is highly rated by Google and so if some innocent bystanders happened to go searching for the Washington Post article they might also bring up my blog, get confused, click my link instead and learn some facts that will help them oppose the political nonsense that both sides of politics in the US is engaged in at present.
24 hours later I just checked Google and check out the results. Plan A might just work 🙂 All readers please do the same and click my link like hell!
For those who are never sure whether I am joking or not, I filed this picture under a directory on my computer called FUN!
That is enough for today!


Bill,
I am curious to know how (and if) you would alter the (un)employment statistics and measures to accomodate Job Guarantee. Although those who work under JG would not be unemployed, would you have headline measures which exclude JG employment etc?
Kind Regards
Charlie
Rahn didn’t get much comments on his article but those there was instil some hope in humanity.
RAHN: Destructive economic myths
By Richard W. Rahn
–
The Washington Times
5:44 p.m., Monday, February 7, 2011
Reader Comments
Pete says:
13 hours, 6 minutes ago
More madness from “so-called” experts! Get a time machine and return to 1955 and then “get a clue”!!
yo says:
20 hours, 35 minutes ago
Anyone that starts an article about government finances by equating them to their our personal finances is a moron.
But this guy isn’t just a moron he is a dangerous lunatic.
The reason any economy works is based on trust and faith in the system. Dangerous lunatics like this want to erode that trust and faith to fulfill their fanciful delusions like a suicide bomber believing in how much better their lives will be dead.
New User dd9a3 says:
20 hours, 58 minutes ago
The US Government spends money on sporting events & expensive restaurants? I’m confused…I thought the US Government spent money mainly on soldiers’ salaries, retirees’ pensions & heathcare for the elderly…stuff like that.
Your analogy to household finances misses a basic economic reality of monetary policy, but I’m not going to go into it here since you wouldn’t understand anyway.
fastboat says:
1 day, 17 hours ago
So much for all the “Chicken Littles” running around the air waves.
Roy Morgan’s ‘more accurate’ figures now put unemployment at 7.9%
http://www.roymorgan.com/news/polls/2011/4629/
Anyone know why there’s such a discrepency (or is that just the method)? This seems fairly significant – wouldn’t a lot of the ABS’s other figures be unreliable if this figure is wrong?
Thank you for all italian for clean articles that take apart the terrorist of the deficit. For italy ther’s bad momentmthe terrorisy claim a return of deficit from 120% to 60.
We live in a total reversL worth of Orwell’s novels who cut spending income ande serivic are considerate of the population heroes.
Sorry i use google for traslate.
I hope you analis of italy..
Always interested in your articles on labour markets because the published statistics don’t correlate with my observations [in a well connected inner-urban area]
Myer CEO, Bernie Brookes, seems to be grasping at any straw to explain why people won’t shop at Myer
1. crummy overpriced stock
2. utility bills have risen, reducing disposable income
3. higher proportion of income spent on housing [rent or mortgage payments]
4. changed spending patterns, the money young women used to spend on clothes is now spent on mobile phone bills, grooming,
5. increase in part time and casual employees have lower incomes
6. online shopping – that’s about 3% of consumers have completed an online overseas transaction [Choice survey]