I started my undergraduate studies in economics in the late 1970s after starting out as…
Creeping along the bottom only
Today the Australian Bureau of Statistics released the September quarter National Accounts data which gives us the rear-vision mirror view of how the economy has been travelling while we have all been speculating. The good news is that real GDP continued to grow. The bad news is that the Australian economy is creeping along the bottom. It just managed to keep its head above zero line in the September quarter courtesy of the strong public investment associated with the now, daily-maligned, fiscal expansion. The labour market was clearly spared the worst by declining productivity. As productivity returns to more reasonable rates of growth, unemployment will rise unless GDP growth turns significantly upwards … quickly. Having said all that – there is nothing in today’s data to warm the frozen hearts of the conservative deficit-haters. They should just find a ship to get on and boost our exports.
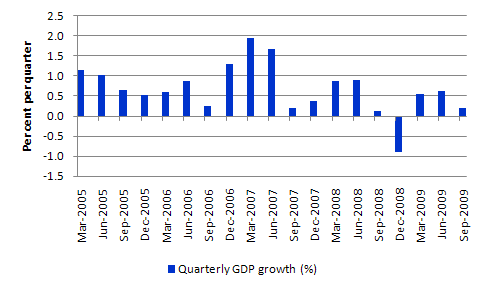
The data shows that economic growth in the Australian economy has actually been slowing down in the three quarters from March (see the following graph). In the March quarter, GDP grew by 0.5 per cent and this sped up in June to 0.6 per cent. We are now down to 0.2 per cent in the September quarter.
On an annualised basis the ABS data shows that Australia grew by 0.5 per cent in the year to September 30, 2009. We had advance warning of this last week when the Balance of Payments data was published and showed that exports had fallen and our net exports position was “expected to detract 1.8 percentage points from growth in the September quarter 2009 volume measure of GDP.”
The following graph shows the quarterly percentage growth in real GDP from March 2005 to September 2009 and demonstrates how weak the recovery is at present.
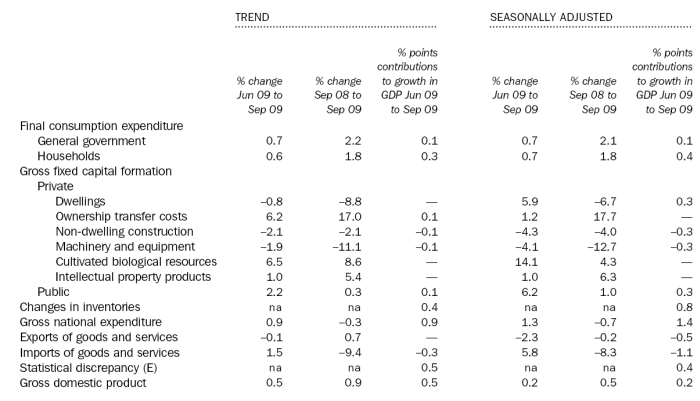
The following table is taken from the ABS September Quarter National Accounts – Main Features, Page 4.
Looking at the seasonally adjusted series (last three columns) you can see that public investment grew by a significant 6.2 per cent and added 0.3 percentage points to the overall GDP growth outcome.
The point should be very clear – we would have gone backwards if the stimulus packages had not been driving aggregate demand.
The stimulus packages also probably drove the household consumption growth of 0.7 per cent in the September quarter which added (because of its overall dominance as an individual component in total expenditure) 0.4 percentage points to the GDP figure.
It is clear that private investment subtracted 0.6 percentage points from the GDP growth outcome in the September quarter.
The other component that suggested activity is picking up is the 0.8 percentage points contribution by inventories as firms clearly are now rebuilding stocks.
The 5.8 per cent growth in imports was dominated by capital machinery and other investment items. That is a good sign for the future. However, when combined with the decline in exports, our external position drove GDP growth down by 1.6 percentage points.
Note the statistical discrepancy of 0.4 percentage points contribution – this is the error that arises between the three ways of assessing the national accounts. The ABS define it as being “calculated as the differences between aggregate incomes, expenditures, or industry products respectively and the single measure of GDP”.
The ABS also say (page 70) that:
Prior to 1994-95, and for quarterly estimates for all years, the estimates using each approach are based on independent sources, and there are usually differences between the I, E and P estimates. Nevertheless, for these periods, a single estimate of GDP has been compiled. In chain volume terms, GDP is derived by averaging the chain volume estimates obtained from each of the three independent approaches.
So given the relative size of the Expenditure-based statistical discrepancy, don’t be surprised if there are not some revisions next quarter to the current estimates. These are survey results after all and put together from a number of different sources of survey information, some of which is only guessed at the time of publication and firm up afterwards (and therefore comprise the basis of the revision).
Looking back
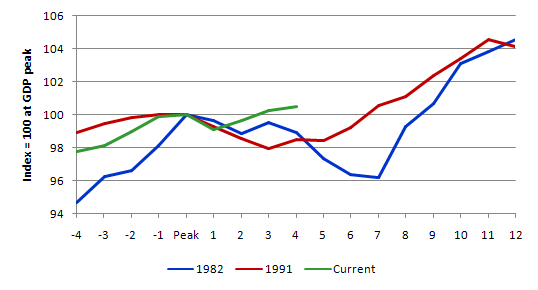
The following graph compares the current period with the 1982 and 1991 recessions in Australia. The lines show real GDP indexed to 100 at the peak for each of the 1982 (peak at September 1981, trough at June 1983); 1991 (peak at September 1990, trough at June 1991); and 2009 (peak at September 2008, trough December 2008) downturns. The graphs start 4 quarters before the peak and then go out 12 quarters (3 years) after the peak.
The graphs tell you about the growth path leading into the downturn, the relative rate and duration of the decline (peak to trough) and then the speed and strength of the recovery.
The 1982 peak was followed by 7 quarters of contraction with the GDP contraction ending at an index value of 96.4 (compared to the peak of 100). The 1991 recession was initially more severe but turned out to be shorter (trough was 97.9). However, as you can see (compare blue and red lines) the 1991 recovery was very drawn out compared tot he longer decline but sharper recovery in 1982.
The current downturn-recovery (green) stands out in contrast. The economy was back above the peak value after three quarters but is now growing very slowly.
Looking forward
If we try to deduce what the rear-vision mirror view says about now we have to put together bits of information for other sources.
On November 26, 2009, the ABS published its September quarter (the latest) private capital expenditure survey. While the September quarter expected expenditure (2009-10) was down on the corresponding period in 2008-09, it was showing positive signs on a quarterly basis.
Further, the RBA Minutes of the Monetary Policy Meeting for December conducted an assessment of domestic conditions and concluded that:
Business surveys released over the past month had been strong, suggesting that business conditions were continuing to improve and that capacity utilisation had risen from the relatively low levels seen earlier in the year … Information on the labour market had also mostly been positive. Employment was estimated to have increased in October … Surveys suggested that hiring intentions of businesses were gradually picking up …
Recent data on business investment pointed to a fall in spending in the September quarter, especially for non-residential building. However, investment had held up much better than expected earlier in the year. Engineering construction was at very high levels and likely to rise further as LNG projects picked up. The recent data also suggested strong growth in public-sector investment, with construction spending at high levels, including spending on both educational facilities and broader infrastructure.
On forward-looking international conditions, the RBA said that:
Most economies in Asia were expanding solidly. In China, while there had been a slowing in investment spending after the very rapid growth seen earlier in the year, growth in retail spending had been strong recently. Chinese export volumes were also rising at a solid rate, with broad-based growth to a range of destinations. Growth in Indian GDP in the September quarter had been very strong, and the estimates for Japanese growth had also been firmer than expected. A wide range of other economies in the region had also registered above-trend growth in the September quarter.
This suggests that the decline in exports will ease. So it is unlikely that GDP will slow even further in the December quarter of 2009. However there is absolutely no case to be made in this data for an easing of the fiscal stimulus. In fact, the flat growth scenario suggests that a further stimulus would be appropriate.
Comparing our sick economy to the even sicker rest of world
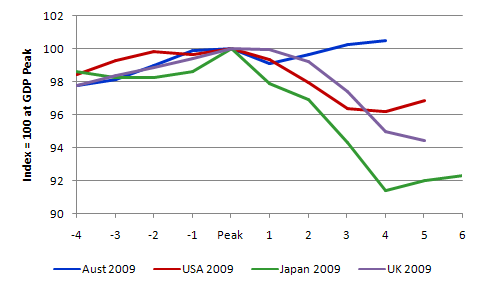
While Australia is creeping along just above the zero growth line, we have clearly fared better than most other developed countries. The following graph is constructed using the same principle as the previous graph (comparing 1982, 1991 and 2009 Australian recessions). The only difference is that it focuses on the current downturn and compares the Australian GDP dynamics pre- and post-peak with the GDP dynamics in the US, Japan and the UK (using official data sources in each case).
Japan has one extra observation compaed to the US because its real GDP peak came one quarter before the US peak (March 2008 compared to June 2008). The latest available national accounts data for the UK is the June quarter whereas the Australian, US and Japanese data goes to the September quarter.
Several features are noticeable. The huge contraction in the Japanese economy is clear (green line). Its trough value (4 quarters after the peak) was 91.4. That is a huge decline in the size of its economy.
The other feature is that the UK economy as at June was still contracting although the pace of decline had slowed a little. Its June index number was 94.4 (compared to peak of 100). The lowest index reading the US recorded after 4 quarters of contraction was 96.2.
Finally, the old-fashioned view that Australia was intrinsically linked to the US and UK economies is no longer a sustainable viewpoint.
Will this ease pressure on interest rates?
The Deputy Governor of the RBA gave an address today to the 22nd Australasian Finance and Banking Conference in Sydney.
While the rest of the speech is interesting and shows that the commercial banks have hiked their mortgage rates higher than their “costs justification” would suggest, the specific section on monetary policy implications was very pointed.
Recall that the RBA shares a notion among central bankers of a neutral interest rate. Please read my blog – The natural rate of interest is zero! – for more discussion on this point.
It is a rate they claim is neutral – neither stimulatory or expansionary. Most commentators (not me!) claim this rate lies between 5 and 6 per cent which suggests that the recent “move back towards neutrality” that the RBA claim they are undertaking (hence 3 interest rate rises in the last 3 months) has some way to go yet.
But the Deputy Governor shed some further light on this in his speech. He said:
As I have noted, over the past couple of years, the interest rates that matter in the economy – the rates on housing and business loans and the rates on deposits and debt securities – have all risen relative to the cash rate … The Reserve Bank has taken these changing relativities into account in its monetary policy decisions.
He then noted that recent cash rates had been historically low and said that at its current level of 3.75 per cent, it was “still 50 basis points below the previous cyclical low of 4.25 per cent in 2001.”
He then clarified the RBA’s position on this:
On the surface this might suggest that the cash rate is still unusually low. However, with other interest rates in the economy having risen by at least 100 basis points relative to the cash rate over the past couple of years, they are now above their previous cyclical lows.
Another way to think about this is that the current level of deposit rates, housing loan rates and business loan rates would have been consistent, before the crisis, with a cash rate of at least 4.75 per cent.
Taking these considerations into account, it would be reasonable to conclude that the overall stance of monetary policy is now back in the normal range, though in the expansionary segment of that range.
In central bank speak that is a significant statement. It means that the RBA is now not necessarily going to continue increase rates much more and certainly it is not likely to continue pushing up towards the 5-6 per cent rate in the foreseeable future.
Today’s GDP figures will further reinforce that view – even if the reasoning is based on a false notion of the importance of monetary policy as a counter-stabilisation policy tool.
But having said that I imagine there will be many very indebted households who will be welcoming the prospect of a levelling out in interest rates.
Labour market implications
While we are all happy that output growth remains above the zero line the thing that really matters is whether people are enjoying more hours of work and increased incomes.
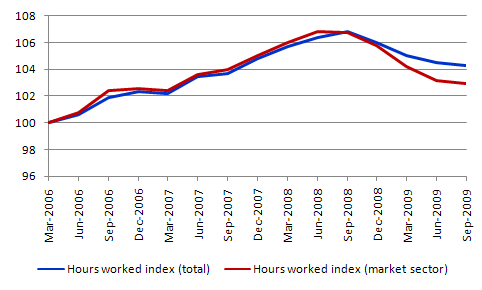
The following graph shows the hours worked index (March 2006 = 100) to September 2009. For the market sector (essentially the private sector) the index peaked over the period shown at 106.9 in June 2009 and has fallen every quarter since then and in September 2009 was 103.0.
So hours worked are still falling overall as GDP slowly recovers although the pace of contraction in hours is slowing. How can that happen you might ask? The simple reason is that labour productivity growth has quickened significantly and is now running at 2.5 per cent per annum in the September quarter. Averaged over the last year, GDP per hour worked in the market sector was 1.5 per cent per annum. Somewhere between 1.5 and 2.5 per cent per annum will be correct.
In part, it has been the hours adjustment that has been protecting the unemployment rate. With productivity growth now gathering pace and new entrants continually coming into the labour market (at about 1.6 per cent per annum), GDP growth at present is not nearly strong enough to prevent unemployment from rising.
The final observation is that GDP per capita continues to decline. GDP per capita declined by 0.6 percent (on a quarterly basis) in the December quarter; then -1.5 per cent in the March quarter; -2.3 per cent in June; and -0.4 per cent in the September quarter. So in national income terms we are all poorer (overall).
Conclusion
Today’s GDP figures really should put a cork in the increasing calls for a sharp cut-back in the fiscal stimulus. It should also tell the RBA that our economy is still very fragile even though we escaped the worst of the world economic collapse.
Our current growth is not enough to absorb the quickening pace of labour productivity and the new entrants into the labour market. As hours adjustments are exhausted the unemployment rate will rise unless growth gathers pace soon.
As ridiculous as it gets
And this little snippet will confirm how ridiculous … yet how dangerous the deficit-hysteria has become.
The ABC news reported today that Britain axes jobs, air base to fund Afghan choppers. The report said that:
The British Government is to cut jobs and close an air base to raise the money needed to buy more helicopters for the operation in Afghanistan.
Twenty-two Chinook helicopters are on order to boost mobility, speed and safety.
After first denying extra helicopters were needed for the war in Afghanistan, 10 of the new helicopters are due in service by 2012 or 2013.
But, citing acute cost pressures, Defence Secretary Bob Ainsworth says RAF Cottesmore base will be closed and fighter squadrons disbanded or mothballed to pay for the new equipment.
The British Government should be instantly removed for undermining the welfare of its own people and probably the Afghani people although the latter impact requires more complex reasoning than the former. The cutting of jobs to “pay” for something that the government can always afford if available – is in my view a sackable offence.
Dear Bill,
If anyone is running a book on this can I have $10 on Bob Ainsworth to gain a high paying job at Boeing if he loses at the next election?
cheers, Alan.
Here’s a question for MMT: What happens when a gov’t with monopoly control of it’s currency, taxes it’s people for more of the currency than it has spent into the private sector? Do they declare all the people criminals and institute a de-facto dictatorship?
I know it sounds absurd, but the current crop of world leaders does not inspire confidence that it couldn’t happen.
Dear Phil
You mean what happens when a national government runs a budget surplus? The fiscal drag that results (increasing the spending gap) usually results in a short-term reversal of the budget outcome as the automatic stabilisers come into play and the economy slows. The only way the economy can continue to grow under these circumstances is if: (a) there is a net export boom (for example, Norway); and/or (b) the private domestic sector maintains growth in consumption and investment by increasing their debt levels continuously. (a) is possible for extended periods whereas (b) cannot be sustained for very long. Eventually under (b) the economy melts as the private sector seeks to resume saving.
Australia did (b) for 11 years (about) from 1996.
I don’t know what the reference to criminals and dictatorships is all about though.
best wishes
bill
Hi Bill and Phil: nice question, answer, and post. In the case of the USA, Prez Clinton managed a budget surplus for a bit over 2 yrs, killed the economy by sucking away private sector income and wealth, and the budget deficit was restored. Unfortunately, it was restored the “ugly” way–through slow economic growth that lowered tax revenue. We then had a “jobless recovery” for many years. Because the budget stance remained tight all thru the Bush administration, our private sector had to deficit spend. This finally collapsed in 2007–and the rest, as they say, is history. Now we have the budget deficit exploding, in a particularly “ugly” way. It is cushioning the downturn but Americans are now too scared to spend. Unfortunately the Obama admin does not understand MMT and so refuses to take decisive, progressive action. We will, of course, eventually recover because the budget deficit will continue to grow. But meanwhile we are 25million jobs short. Too much suffering. It could get a lot worse before it gets better.