Earlier this year, I analysed how decisions taken by the Japanese Government Pension Investment Fund…
Japan challenges – is there really a labour shortage? – Part 5
I do not have much time to write today as I am moving house later this afternoon and have a few work meetings to attend before that. So the next topic might take two shorter parts. As predicted, Ms Takaichi became the first female Prime Minister for Japan on Tuesday after consolidating a coalition with the unlikely 日本維新の会 (Japan Innovation Party or Ishin for short), who are based in Osaka and is a sort-of right wing group that opposes central government in Tokyo and is a mixture: free market narratives, anti-immigration, mixed with things like government-provided free education for all. It is an unlikely coalition that only a place like Japan could conjure up. But she is now PM and the ailing LDP elite rules on, although for how long is another matter. The new PM is, as I have indicated against using monetary policy as the main macroeconomic policy tool and favours further fiscal expansion under the new heading 責任ある積極財政 (Responsible and proactive fiscal policy), which was a term given to her by my research collaborator here at Kyoto University (Prof. Fujii), who will become one of her senior advisors in the new government. The question I am toying with as we prepare for this major symposium at the Diet on November 6, 2025, is what actual scope is there for fiscal expansion when we are told that there is a drastic labour shortage. That is what I am discussing in this part of the series today.
A few weeks ago I wrote this blog post – Japan – the challenges facing the new LDP leader – Part 2 (October 9, 2025) – which discussed the latest Bank of Japan research work on output gaps and their estimates of labour and capital shortages.
On the face of it, the research suggests that Japan is currently exceeding its labour input capacity, which is usually only a temporary possibility given the stress it places on labour resources and the cost it imposes on employers.
The question I am looking into today is whether we can really trust the ‘official’ research on that topic.
Is there really a labour shortage?
As at the June-quarter 2025, the Bank of Japan estimated that:
1. Output gap -0.32 per cent.
2. Capital Input gap -0.79 per cent.
3. Labour Input gap +0.47 per cent.
That means that the it is estimated that Actual GDP is 0.32 per cent below its estimated potential, that the capital stock (equipment, plant etc) is operating at 0.79 per cent below its capacity, and the aggregate labour input is operating at 0.47 per cent above its full capacity.
In other words, the Bank is basing policy on an assumption that there is over-full employment presently.
The first important point to understand is that these estimation techniques are pretty unsound even if they are conventional.
While the Bank of Japan do not publish their potential GDP estimate in level terms (that is billions of yen), one can reconstruct it from the actual GDP data published in the quarterly national accounts by the Cabinet Office.
The reconstruction uses the formula for the output gap, which the Bank of Japan publishes on a quarterly basis, and applies that to the actual GDP data.
The following graph shows the actual and reconstructed potential GDP from the March-quarter 1995 to the June-quarter 2025.
The actual GDP is the solid line and the Bank of Japan’s Potential GDP is the dotted line.
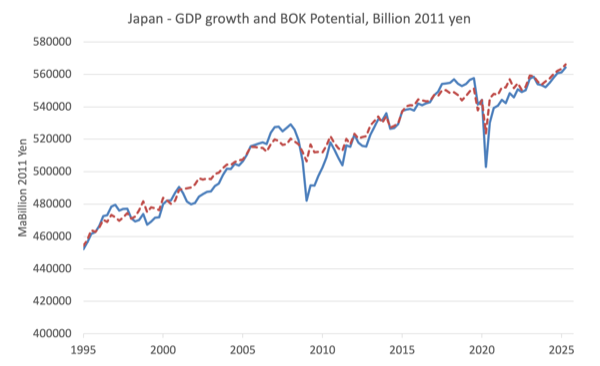
Immediately you will see the problem I hope.
Perhaps not – but the question you should ask is this.
Potential GDP is a reflection of the available productive resources – capital and labour.
Capital is a slow moving aggregate that is fed by new investment and eaten up by depreciation.
And the labour input is based on behavioural practices etc.
So why does the potential GDP behave in a way that makes it look like it tracks the actual pattern over time displayed by the actual GDP?
Actual GDP clearly behaves in a cyclical fashion and follows actual aggregate expenditure – you can see that clearly during the GFC period when Japan’s output growth nosedived.
And again during the period when COVID-19 restrictions were in place.
But why would potential GDP follow a similar, albeit muted cyclical path when the determinants are unlikely to behave in such a cyclical fashion?
The answer is in the estimation technique.
The Bank of Japan uses filters based on the actual GDP path – in other words, the potential just maps out a similar path to the actual.
One such filter (which is not the one used but gives similar results) would be a multi-period moving average.
So the amount of independent information that the Bank of Japan’s potential GDP measure and its output gap measures (and if you want more technical detail you should read the original research paper) provide is moot.
Answer: not much.
The other point to note is that the Bank of Japan has regularly estimated that the Japanese economy is producing above its potential.
For example, between the March-quarter 1996 and March-quarter 1998, the estimated output gap averaged 0.82 per cent. And between the September-quarter 2005 and the September-quarter 2008, the estimated output gap was 1.13 per cent. And more recently, between the June quarter 2017 and the March-quarter 2020, the average was 0.99 per cent.
A sustained period of ‘over production’, which is what a positive output gap in concept represents, would generate cost pressures that should feed into wage and price increases.
During those periods none of those nominal pressures showed up, which is a further hint that the output gap measure provided by the Bank of Japan is not measuring the pressure in the economy very accurately.
Which means that the conclusion that the Labour Input gap is currently over-fully employed has to be treated with considerable doubt.
Which means that the scope for expansion may be larger than the Bank of Japan’s output estimates suggest.
Further, if one studies the previous graph, it looks like when the Japanese economy exhibits positive GDP growth, the growth rate is fairly similar across the phases.
For example, I calculated the following growth phases:
| Period | Average Quarterly growth % | Average annual growth % |
| June-quarter 1999 to March-quarter 2008 | 0.35 | 1.29 |
| June-quarter 2011 to September-quarter 2019 | 0.28 | 0.96 |
| December-quarter 2020 to June-quarter 2025 | 0.25 | 1.24 |
Now obviously one could pick and choose quarters to start and finish the calculation of these averages but some experimentation didn’t really alter the numbers too much.
Leading up to the GFC Japan grew more strongly than it has in the aftermath of the GFC and in the aftermath of the initial COVID-19 impacts, which is understandable.
Large recessions create a lot of damage and it takes some time to recover fully, which is why policy makers should use fiscal policy to moderate them (or avoid them altogether).
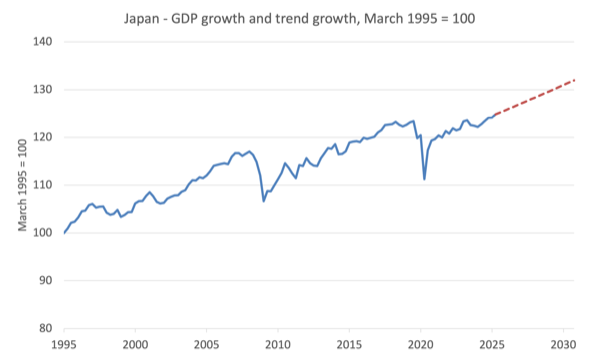
Based on that, I constructed an estimated trend growth (using the last phase averages as the basis of my extrapolation).
The dotted line is the extrapolated trend and can be understood as saying what would happen between the June-quarter 2025 and the December-quarter 2030 if the Japanese economy grew at the average quarterly rate that it exhibited between the December-quarter 2020 and the June-quarter 2025.
The following graph shows what Japan might expect out to the December-quarter 2030 based on that assumption.
Interestingly, if I extrapolated the Bank of Japan’s potential growth rate estimate out to the same end point I would get pretty much the same result, which is no surprise, given the close relationship through construction between the actual and the estimated potential.
The question though is in this time of alleged labour shortage can such GDP growth can be maintained no matter how modest it looks to be?
Productivity again
The next task I am pursuing is to come to terms with the productivity question, which I started in the blog post on Monday – Japan – where will the productivity growth come from? – Part 4 (October 20, 2025).
Trying to estimate productivity accurately is a tough task and many an applied economist has fallen over trying.
There are wildly different estimates of Japan’s productivity and so a definitive statement is difficult.
But that will be the topic of the next part in this series.
If productivity growth in certain sectors is low then more workers are required to produce a given unit of output relative to if there was higher productivity.
So it is important to estimate productivity by sector as accurately as possible in order to assess whether innovation and investment in new technologies etc can ‘free’ up some labour resources currently being used.
I say that with many caveats including cultural practices that are clearly as important as meagre output per unit.
There are some estimates of excess employment in Japan that suggests there is (Source):
… more than 40 percent of current employment is potentially in excess …
The estimate comes from research at the Japan Center for Economic Research, which is a private research institute funded mostly by business organisations.
If that estimate was even remotely accurate then there is no labour shortage in Japan.
What is considered to be a labour shortage is then just a poor allocation of labour resources.
The solution to that problem is quite different to what is required if there is a true shortage.
Conclusion
Examining those issues is where I am heading.
But now I am heading into a few hours of home shifting in Kyoto – carrying things etc. And unlike the task in Australia we will be using bikes a lot!
That is enough for today!
(c) Copyright 2025 William Mitchell. All Rights Reserved.
Thanks for the Japan series of posts!
Would you consider looking into China too?
Could it be the place where “new” economics are being piloted ?
[LINK DELETED BY BILL]
What’s the current ETA for the 2nd edition Macroecon textbook? Still this year or more into next year?
Dear Jon (at 2025/10/27 at 4:58 pm)
Thanks for your enquiry.
The final manuscript is in the last stages of writing – revisions etc. I suspect the 2nd edition will not appear until later in 2026. The publisher is quite slow in the production phase.
Best wishes
bill
Dear Olivier G. (at 2025/10/24 at 3:51 pm)
Thanks for your comment.
I won’t do the same series on China as I have less information available, do not understand the language at all, and do not work there.
I have motivation to do this work in Japan because I am working here and part of a large project.
All the best
bill