I saw a clip from John Stewart's Daily Show yesterday where he showed some Fox…
The hollowing out of the middle class in the US and beyond
The Post WW2 period was marked by the mass consumption boom and the rise of the ‘middle class’, which is a sociological designation that is intended to say that the working class had segments that had experienced better conditions and outcomes than the labouring cohorts. The fact that Capital (as a class) deigned to concede to the rise of this cohort was due to the threat that the Soviet Union and the increasing interest in Marxism in Western nations during the mid-C20th posed to the on-going hegemony of capital. The solution was to share a bit of the booty out with workers, improve pay and working conditions, and provide the basis for a ‘divide and conquer’ strategy, which would effectively segment the working class into ‘individual’ elements that could be played off against each other. And to maintain the profits, sales had to expand and what better way than to encourage the ‘middle class’ households to consume like crazy and fill their ever increasing size homes with stuff. That strategy worked for some decades until the middle class and the trade unions started to get too vocal and demand more at which point something had to give. And in the early 1970s, give it did, and with Monetarism running rife in the academy and industrialists plotting to capture the legislatures (think Powell Manifesto), the conditions for neoliberalism were laid. And the next several decades have seen that ideology become dominant and establish a dynamic that is now likely to implode.
Today, I report on dimensions of that implosion.
I read a report a few weeks ago that motivated a bit of research to see what it was all about.
The news report (February 25, 2025) – The Wealthiest 10% of US Households Now Represent Nearly 50% of Consumer Spending – was reporting on a research report released by Moody’s Analytics and the title says it all.
In the US, the:
… the richest 10% of U.S. households — defined as making about $250,000 or greater — represented 49.7% of all consumer spending. That’s the highest figure on record since data collection surrounding this metric was first measured by Moody’s … also pointed out that consumer spending is responsible for driving approximately 70% of United States GDP
In the 12 months to September 2024, these highest income recipients increased consumption spending by a staggering 12 per cent.
At the other end of the income distribution:
In contrast, spending by both lower-income and middle-income American households declined during that same period.
Commentators have wondered why the US economy did not slow appreciably as the Federal Reserve Bank hiked interest rates.
The answer is, as I have discussed in many earlier blog posts, that the impact of interest rate hikes is not as straightforward as mainstream economics would like us to believe.
At the heart of the impact is a distributional mechanism.
Borrowers are negatively impacted as their income must service higher interest payments.
But creditors are positively impacted as their interest income increases.
Further, those who hold wealth in the form of financial assets benefit.
Low-income households spend more of each dollar they earn whereas high-income households save more of each dollar (because they have so many of them).
But the difference in spending propensity between these different income cohorts just tells us at the margin – what proportion of the extra dollar will be spent by each cohort.
However, in absolute terms, the high income earners may end up spending more overall when they enjoy income shifts because those shifts tend to be larger than any incremental income gains or losses for low income earners.
It is simply a scale issue.
That is why the new article quotes the author of the Moody’s study who wrote
Wealthier households are financially more secure and thus more able and willing to spend their income … That is, they save less than they would otherwise. This is consistent with our estimates of consumer spending by income group, which shows the well-to-do in the top quintile of the income distribution powering the recent growth in spending.
There are two additional facts.
1. Mortgages tend to be mostly fixed-rate in the US, which means that the rising interest rates did not really affect the existing mortgage holders, only new mortgages.
2. The rise in public debt during the pandemic support means that there has been an increase in financial assets in the US economy and so income flows to the bond holders increased substantially during the period that interest rates rose.
So the Federal Reserve was actually acting to stimulate a fiscal expansion via the increase in government interest payments.
Which is why the high-income recipients, who overwhelmingly hold such assets, experienced a big fiscal boost and were able to increase their consumption spending so much.
The Report notes that around 3 decades ago;
… the wealthiest 10% of American households were responsible for about 36% of U.S. consumer spending.
Other data shows that the luxury goods market has boomed in the last year or so:
From designer bags to first-class airline tickets to cruise trips, the top 5% of households spent 10% more on luxury splurges compared to last year … They’re going to Paris and loading up their suitcases with luxury bags and shoes and clothes.
I guess Trump will have to impose some tariff or another to stop those imports 🙂 🙂
The most recent US Bureau of Labor Statistics data – Consumer Expenditure – 2023 (published September 25, 2024) – shows that:
Annual growth in consumption expenditure by quintile – 2022-23
| Income quintile | Annual growth (%) |
| Lowest quintile | 3.6 |
| Second quintile | 2.7 |
| Third quintile | 5.7 |
| Fourth quintile | 7.3 |
| Highest quintile | 6.7 |
The higher-income quintiles thus increased their nominal spending in real terms (faster than the inflation rate) while the lower-income cohorts experienced real cuts in their overall spending.
Those trends changed further in the following year (no exact data yet) and the growth was much higher for the higher-income cohorts and flat to negative at the bottom.
The data shows that:
The bottom 80% of earners spent 25% more than they had four years prior, barely edging out price hikes of 21% over the same period of time. On the other hand, the top 10% of earners spent 58% more.
What does that imply?
The Post WW2 reliance on the ‘middle class’ to drive consumption growth and profit realisation is being eroded by the very system that created that reliance.
Growth and profit reliance in recent years has increasingly required profligate consumption excesses by the wealthy high-income group. The sort of consumption goods and services they purchase are biased towards a narrow range of luxury products.
Any financial market disturbance will also impact on overall spending substantially.
Neoliberalism has steadily been hollowing out the ‘middle class’.
The analysis by the Pew Research Center in the US provides evidence of this for the US – The State of the American Middle Class (published May 31, 2024).
It showed that:
The share of Americans who are in the middle class is smaller than it used to be. In 1971, 61% of Americans lived in middle-class households. By 2023, the share had fallen to 51% …
As a result, Americans are more apart than before financially. From 1971 to 2023, the share of Americans who live in lower-income households increased from 27% to 30%, and the share in upper-income households increased from 11% to 19%.
Thus, 6 out of 10 Americans were classified as middle-class in the early 1970s just before the neoliberal assault.
Now only 5 out of 10.
Two major aspects of this shift are notable:
1. “the growth in income for the middle class since 1970 has not kept pace with the growth in income for the upper-income tier.”
2. “the share of total U.S. household income held by the middle class has plunged.”
The growing inequality is also highly concentrated across ethnic groups and geographic locations.
So the rise of ethnically-biased urban ghettos is increasing.
The conclusion is that the top-end-of-town have become so obsessed with grabbing the booty for themselves – through their influence on government policy and their roles as employers etc – that they have forgotten why the ‘mass consumption’ boom was motivated in the first place.
If an increasing proportion of the population become impoverished and the middle class continues to be hollowed out then the ‘stability safeguards’ that protect capitalism was falling to mass uprisings of the sort seen in the C19th and beyond, will be undermined and social instability will increase.
The US and other advanced nations will be heading towards a situation like we see in nations like South Africa, where the fastest growing employment sector is the security industry protecting the property of the rich from the hungry hordes.
The hollowing out of the ‘middle class’ has been an unfolding story over the last several (neoliberal) decades and the pace of the retrenchment has varied in different nations.
The capture of government by the elites which has marked the shift from the ‘welfare state’ Capitalism of the immediate Post WW2 period up to the 1970s (about) to the austerity-biases in economic policy and the cut backs in public infrastructure provision (including transport, telecommunications, health and education) and social welfare safety nets have been instrumental in that retrenchment.
The attacks on the Welfare State have had varied impacts across nations and where the social support is more pervasive and generous (say in the Scandinavian countries) the retrenchment has been less devastating than it has been in nations like the US, which started with a pretty threadbare social welfare system.
There have also been sequential tax cuts for high income earners and companies that have contributed to the income shifts to the top.
Lower-income women are now less likely to marry their high-income boss and this has contributed to the reduction in social mobility across the income classes which reduced income inequality during the Welfare State era.
And the shifting industrial composition and the related employment changes – from high-paid manufacturing to precarious, low-paid service sector employment has contributed.
As have the attacks in various countries by governments on the capacity of trade unions to defend the wage interests of their memberships.
In America, the curious way that it runs its healthcare system, which is biased against low-income families is a particular contributor in that country.
The Al Jazeera article (March 27, 2025) – The American Dream is officially over: All because the rich must always steal from the poor – notes that:
The War on Poverty/Great Society programmes President Lyndon B Johnson pushed through in 1965 were the final straw for the burgeoning neoconservative movement …
Neoconservatives saw Johnson’s vision of ending poverty and shifting more public tax dollars to truly lift all Americans into prosperity as communist and dangerous. By the time of President Ronald Reagan’s conservative revolution in the 1980s, both the remnants of the Great Society and War on Poverty programmes and even the social welfare system Franklin D Roosevelt built through the New Deal in the 1930s faced attacks and austerity.
We can overlook the slip that “public tax dollars” were shifted into spending, and accept that the hollowing out of the US middle class was not a random event.
It was part of a coordinated and well-funded effort.
I wrote about that, in part, in this blog post – The right-wing counter attack – 1971 (March 24, 2016).
The article from Inequality.org (December 2, 2022) – Tax the Rich? We Did That Once – notes that:
Back at the tail-end of that era, in the early 1960s, America’s richest faced a 91 percent tax rate on income in the top tax bracket. That top rate had been hovering around 90 percent for the previous two decades …
In the 1980s, Ronald Reagan and his friends on Capitol Hill would shove that rate down even further, first to 50 and then to 28 percent …
The current top-bracket rate: 37 percent.
In 1987, the company tax rate was 42.5 per cent for income between $US1 million and $US1.405 million.
And, since 2018, the company tax for all income is now down at 21 per cent.
One should not infer that this reduced the US government’s capacity to support what social welfare system it had in place.
But the tax cuts have transferred massive amounts of disposable income to the top-end of the distribution, which has not only given that cohort increased spending power overall, but more capacity to fund lobbying that advance their own interests.
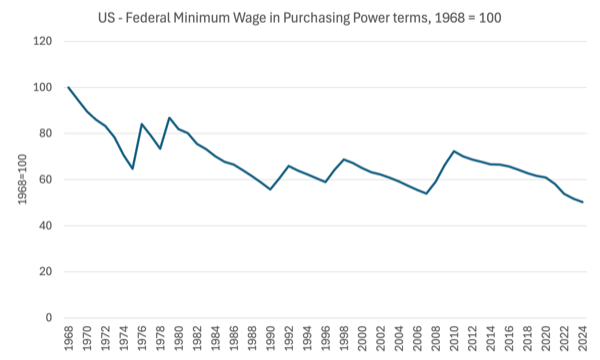
The US Department of Labor (while it still exists) publishes extensive minimum wage data going back to 1968 for the federal and state jurisdictions – Changes in Basic Minimum Wages in Non-Farm Employment Under State Law: Selected Years 1968 to 2024.
The minimum wage in the US, which conditions wage movements at the lower end of the distribution has, at the federal level, been unchanged in nominal terms since 2010 at the hourly rate of $US7.25.
What does that mean in real (purchasing power) terms?
The following graph tells the story.
It is indexed at 100 in 1968 and tracks the real equivalent of the federal minimum wage.
By 2024, the index value was 50.27 points, which means that the real value of the wage has halved since 1968.
Since the last nominal adjustment in 2010, it has fallen by 30.4 per cent in real terms.
Conclusion
So the top end income has boomed in real terms while the bottom end has collapsed.
That is the story of the US after several neoliberal decades.
And it is the story of most advanced nations to varying degrees.
I will write more about the implications of that hollowing out in weeks to come as I do more work on the topic.
That is enough for today!
(c) Copyright 2025 William Mitchell. All Rights Reserved.
Dear Bill, sorry for the nitpicking question, but what defines the middle class? If I follow your links, the articles in question don’t give a clear answer. One method that is mentioned is to divide the population into quintiles, but in that sense the proportion of the population that is middle class can’t change over time, unless it’s just a matter of household composition.
“So the Federal Reserve was actually acting to stimulate a fiscal expansion via the increase in government interest payments. Which is why the high-income recipients, who overwhelmingly hold such assets, experienced a big fiscal boost and were able to increase their consumption spending so much.”
This will be a part of the reason. However, the wealthy don’t park all their spare cash in government bonds. They ‘invest’ in shares, land and real estate.
These have done very well in recent times and are likely to have given them an even larger boost than the return on government bonds which isn’t that large after inflation is taken into account.
Hollowing out of the middle class follows inexorably from the real long term quasi-freeze on earnings growth, with continued downward pressure on pay and standards of living. This first impacts upon the minimum wage cohort, but then seeps upwards, as intended.
With low wage growth household financial pressures now mean continued consumer growth can no longer be fed by growth of personal credit debt as it was in the 80s and 90s after deregulation.
Well qualified and skilled middle class professionals, mostly in the service sector, are far from immune from wage or cost of living pressures.
Wage flatlining started 30 years before the 2008 crash, but has been relentless since. The trends recorded in Bill’s blog are a logical consequence.
In practice it means that working people now have much reduced reason to accept that inculcated Protestant work ethic essential for the functioning of capitalist industrial economies.
This work ethic is being very actively promoted by both Reeves and Starmer in the current UK centre right government as a personal duty, but we have a relatively high level of economically inactive persons who are able to work.
It is to Starmer’s eternal shame, though he has ever been politically amoral, that he is now desperately stigmatising immigrants as well as the disabled and long term sick.
I’d argue the UK’s slowly increasing % of economically inactive, especially since Covid, is partly a manifestation of poor inducements to work and weak job security, reflecting the every day strains of being involved in the jobs market, including those stressful work places within underfunded public services such as health, social care and education – affecting middle class occupations too.
No-one really wants to be a wage slave, or wage serf.
But this is the role identified for working people in the service of capital.
Official monetarist policy across almost all developed industrial nations deliberately aims to depress wages and manipulate unemployment accordingly to sustain capital growth and this is concreted into macroeconomic dogma.
Wealth has been progressively sequestered by the managerial elite, which class includes the political and corporate elite that plutocratic leadership subsidises.
Thus we have increasing inequality. The political goal of that is basically neofeudalism, with a very small oligarchic clique abetted by a praetorian guard whose own wealth gains are often due to receiving share bonuses and other privileges which then ties them to the buyback mentality, and also ensures their loyalty.
This is James Burnham’s managerialist class of technocrats, acting in the service of monopolistic and oligarchic interests.
Oligarchs buy power, and unsurprisingly, use that for self aggrandisement and personal status reinforcement. This is exactly what is happening in the USA now, but also which underpins EU and UK corporate hegemony. As a priority, the work force is a cost to be minimised. That we are then a reducing consumer market is a secondary consideration for those whose main earnings are in capital growth and as rentiers anyway.
In the UK, the Reform Party is actually more a corporate lobby group serving plutocratic interests. It is a mirror image of the 1930s British Union of Fascists – bankrolled by wealthy individuals with fascistic agendas, fronted by well spoken upper middle class and invariably privately educated populists.
Politicians do seem to be pretty cheap to buy these days. The Pavlovian impulse to take large donations to achieve and then sustain power is very strong.
The notion that these donations are ‘pro bono’ and unconditional is a peculiar form of self deception by the recipients.
Both Kotkin and Varoufakis, with his notion of ‘techno feudalism’, have identified the emergence of this new feudal era. It is marked by a massive increase in the concentration of wealth and property, reduced upward mobility and economic stagnation for 80% of the population, with increasing disenfranchisement from social, political and economic influence, let alone power.
This is highly dystopian.
Increased right wing dogmatism, always a powerful influence in the USA, and with the silent Dems now almost totally dominant, means that the rise and embedding of fascism there is seems virtually unavoidable. It’ll make McCarthy look like a pussy cat.
Whether it is resistible elsewhere remains to be seen. Elbows up.
What I’ve learned from history, the history which I have lived, not merely read about, is that regulated capitalism is the best economic system for everyone–rich, poor, and in the middle–that has yet come to earth. As the western Fordist form of regulated capitalism has stupidly and tragically been dismantled, the Eastern form of regulated capitalism seen in China, guided by a communist party, has lifted some 800,000,000 people out of abject poverty. Socialism may be better yet, of course, and so I believe, but it remains an experiment yet to be performed on this planet. At no time in history has there been a society in which the means of production and distribution have been owned and operated democratically.
Bill,
It would be useful if you could comment on the work being put out by Gary Stevenson, for instance his latest piece ‘Why Labour is crushing your living standards’.
His main message is that we need to ‘tax the rich’. But that message is nuanced. It’s not to get their money. It’s rather to take back the assets that they have acquired over the last 45 years.
So it’s kind of in the ‘Reclaim the State’ area.
Hi bill your view on this:
https://new-wayland.com/blog/loan-lock-paradox/
“ Since loans create deposits, Consider a scenario where interest rates rise, and you decide to hold a deposit of £100, living off the interest it generates. In that case, a corresponding £100 loan has to exist permanently somewhere in the system to balance that deposit.
For as long as somebody holds the deposit, a matching loan quantity is locked in place and cannot, in aggregate, be paid off. There are insufficient deposits circulating to cancel the loan.
Increased financial savings, in terms of holding deposits, will stop an equivalent amount of loans from being repaid, forcing them to be refinanced or defaulted”
Agree?
@Kester Pembroke,
I haven’t yet read Neil’s article, but at first glance, doesn’t that scenario ignore the injection of govt spending into the economy, which will account for a good percentage (+/- 40%?) of deposits?
Bank loans aren’t the sole source of money.
Kester, a £100 deposit in a bank is a liability, the corresponding asset can be either a loan (private debt) or central bank reserves / Treasury security (public debt). More likely than not it will be an outstanding loan balance. Both pay interest, but interest on loans is market determined and interest on government liabilities is at the government’s discretion, although most people, including within the government, don’t realize that.
“a corresponding £100 loan has to exist permanently somewhere”
There’s a element of misplaced concreteness in this argument. To steal a line from Spinal Tap, “You can’t dust for money.” It would be a mistake to think that a particular £100 deposit needs a particular £100 loan to balance it out. When we stick to aggregates, the argument holds true.
In light of that, it’s weird to say “a matching loan quantity is locked in place.” What place? Where?
Kester Pembroke: The statement you have quoted is complete garbage. Firstly, about loans creating deposits. I no longer use the term ‘loans’ when referring to credit money created by banks that is subsequently advanced to borrowers. Nothing belonging to anyone is lent, so there is no loan. I use the term ‘advances’ – banks advance new credit money to borrowers.
Secondly, advances create deposits, which in effect are ‘savings’. However, I refer to deposits created by advances as ‘soft’ savings because they are destroyed upon repayment of the principal by borrowers. Hence, they are temporary. The deposits (savings) created by the spending of new base money by a currency-issuing central government (CICG) are ‘hard’ savings because unless and until they are destroyed by CICG taxation, they are permanent.
Thirdly, if person A borrows credit money and uses it to purchase a product from person B, the soft savings will exist as person B’s deposits. When person A repays the principal on the advance, which destroys credit money, person B’s soft savings do not disappear. However, barring person A refinancing the advance with another advance (of which the latter will have to be repaid and is thus delaying repayment of the principal), person A will have to obtain hard savings to repay the principal. That is, person A will have to spend less than he/she earns to obtain the hard savings to repay the advance. Upon completing the repayment of the principal, person B’s soft savings are converted to hard savings, which is why person B’s deposits do not disappear. There is no matching loan (advance) locked into place.
As for any interest paid on the advance, that requires person A to obtain additional hard savings, which is transferred to the bank that has made the advance. This involves a redistribution of hard savings from person A to the bank. In effect, some of person A’s income is being redistributed to the bank, which becomes the bank’s income.
The only permanent money is a CICG’s untaxed base money. That is why the only creator of non-government net financial assets (financial assets less financial liabilities or, equivalently, hard savings) is a CICG.
@Philip Lawn: “Nothing belonging to anyone is lent, so there is no loan. I use the term ‘advances’ – banks advance new credit money to borrowers.”
So you find yourself having to dispute the common terminoilogy that ‘bank loans (to credit-worthy customers) create money’.
So private banks “advance” new “credit” (ie, interest bearing) money when they open an account for a new borrower, money which is nevertheless created out of thin air?
As for public sector “base” money: at the recent ERA meeting you were disinclined to discuss the ability of a C-I-G to issue ‘debt-free’ (so called ‘base’) money ; Ellen Brown has no such disinclinations:
(quote)
“The goal of Elon Musk’s DOGE (Department of Government Efficiency) is to reduce the deficit by reducing budget expenditures. But Musk now acknowledges that the DOGE team’s efforts will probably cut expenses by only $1 trillion, not the $2 trillion originally projected. That will leave a nearly $1 trillion deficit that will have to be covered by more borrowing, and the debt tsunami will continue to grow.
Rather than modeling the economy on McKinley, President Trump might do well to model it on our first Republican president, Abraham Lincoln, whose debt-free Greenbacks saved the country from a crippling war debt to British-backed bankers, and whose policies laid the foundation for national economic resilience in the coming decades. Just “printing the money” can be and has been done sustainably, by directing the new funds into generating new GDP; and there are compelling historical examples of that approach. In fact, it may be our only way out of the debt crisis. But first a look at the tariff issue.” etc.
Note: “printing the money” here implies debt-free money issued by a C-I-G *to achieve specific desired national outcomes* not realized in private-sector freemarkets.
Your statement: “advances create deposits, which in effect are ‘savings’….. I refer to deposits created by advances as ‘soft’ savings because they are destroyed upon repayment of the principal by borrowers. Hence, they are temporary”.
“Soft savings”? Are they savings, whether ‘soft’ or ‘hard”?
I went to my bank for a loan to pay invoices (issued periodically as building progressed) ) to a builder, not to increase my savings.
(PS: my idea for government subcontracting the building industry (at no cost to the CIG government which can create debt-free money out of thin air *for specific purposes* (as noted by Brown) ( ie, when it is non-inflationary) was rejected because it was characterized as ‘authoritarian’. It seems free market ideology is my enemy.)
Neil Halliday: You went to your bank for an advance (credit money created out of thin air by your bank). Of course you didn’t do this to increase your savings. You paid the invoice and it became the builder’s soft savings (deposits).
‘Savings’ is a term used to describe all money in the system yet to be destroyed by taxation (CICG base money) and by the repayment of the principal on advances (credit money). In other words, savings = deposits. In a sense, your borrowing of credit money did increase your savings for a fleeting moment. Presumably, it was quickly transferred to the builder, which reduced your savings (deposits) and increased the builder’s savings (deposits).
You now have to pay back the principal plus interest. As you pay back the principal (gradually?), the credit money created out of nothing and advanced to you will be gradually destroyed. And how are you going to repay the principal? You will need to set aside (not spend) some of your income. The non-spending of your income is savings. That is, you will now have to save (spend less than you earn) to repay the principal. Thus, you are saving and then having it destroyed through the repayment of the principal until the total you save/repay equals the builder’s savings (deposits).
What is the source of your savings (unspent income)? I don’t know the source of your income, so I can only speculate. It could come from spending financed by an advance to someone else. If it is, the credit money created is simply delaying the inevitable. What is that? The hard savings created by the positive net-spending of a CICG (G > T) to accommodate your hard savings (S > I), which you surrender when you pay back the principal, and which converts the builder’s soft savings to hard savings.
You will have to do the same to pay the interest on the advance. The difference is that you will be handing over (surrendering) hard savings which becomes hard savings (income) of your bank. This is distributed to bank shareholders.
In the end, the only permanent savings (deposits) remaining are the hard savings created by the net-spending of the CICG. All credit money (soft savings) created by bank advances is eventually destroyed and thus temporary. However, it has performed a valuable role. It has allowed you to spend money you didn’t have (bring your spending forward), albeit it has required you to spend less than you earn later on (save) to repay the advance. This valuable role is one of the misunderstood (inadvertent) functions of modern money – that is, one of a spending time machine. Unlike pre-modern money (pre-5,000 years ago), humankind had no such thing. It also had no system featuring financial injections and financial leakages. Nor did it have something, and this was the main reason for the advent of modern money and taxation, to facilitate the transfer of real resources from the private sector to the public sector without the need for tyranny (if you don’t consider taxation as a form of tyranny).
You say: “So you find yourself having to dispute the common terminology that ‘bank loans (to credit-worthy customers) create money”.
Reply: Yes and no. Yes, advances of credit money clearly create more money! No, because I don’t consider credit money created out of nothing and subsequently advanced to someone as a ‘loan’ because nothing belonging to someone is ‘lent’. The credit money created by banks is not the banks’ money. Nor is it the money of depositors, which is the standard mainstream economic belief underpinning the money multiplier myth.
You say: “So private banks “advance” new “credit” (i.e., interest bearing) money when they open an account for a new borrower, money which is nevertheless created out of thin air?”
Reply: Yes, because they do! It is not because it is a convenient assumption (the approach adopted by mainstream economists).
As for Ellen Brown’s comment: Whatever the size of the deficit ends up being, it does not have to be recovered. All US Fed Govt spending is paid for the moment the base money created by computer keystrokes at the Fed is spent into existence. There is no reason why the US Govt bonds need to be issued other than it is required under current arrangements (that don’t have to exist) to enable the Fed to control the Fed Funds Rate. In any case, the Fed can repay what is owed on the bonds with computer keystrokes, which is nothing more than the Fed handing back the base money it previously injected into the economy in the form of past US Fed Govt deficit spending that, too, was created with computer keystrokes. Hence:
2022: G > T = S > I (ignoring the external sector) – made possible with computer keystrokes
2022: S > I residing as base money in the reserve accounts of banks is converted to US Govt bonds (financial asset swap) – undertaken with computer keystrokes
2023 (assume all bonds are one-year US Govt bonds – most are repos, but that’s an unimportant matter): US Govt bonds converted back to S > I (financial asset swap) – undertaken with computer keystrokes and we are back to square-one!
All up, the US Fed Govt is not borrowing any money! It is issuing bonds to temporarily drain base money residing in the reserve accounts of banks from the system. It is offering a sufficiently attractive interest rate to banks to expedite the process. Warren Mosler considers central govt bonds as little more than central bank term deposits (or time deposits as they are called in the USA).
Thanks Phil.
But apparently the concept of ‘debt-free’ money (issued by a CIG), is widely disputed even by MMTers – one insisted Mosler said there’s no such thing. And Ross Gittins, at the start of the pandemic, agreed the government didn’t have to sell bonds to support locked-down workers….but several months later changed his mind because a central banker told him “there’s no such thing as a free lunch”, on the basis of the requirements of double-entry book-keeping; he forgot the CIG doesn’t have to ‘balance its books’ in monetary terms, but in resource availability terms.
And then there’s the free market: Bowen and Obrien arguing with one-another today (at the National Press Club) over the ‘cost’ of their respective schemes to realize the green transition, proving the CIG government should fund the transition, because profit-seeking players in the ‘credit money’-based private sector will cook the planet, or ruin low income groups with carbon taxes, if we must reach zero emissions by 2050.
Neil Halliday: Who are the MMTers you are referring to? Were they really MMTers? And what would most central bankers know?
In terms of real resources, there are no free lunches. But a CICG has virtually 100% seigniorage. Seigniorage is the difference between the value of the real stuff you give up to obtain money in order to purchase something else. To obtain $10 million of real stuff, the Australian Fed Govt must create and spend $10 million of base money into existence. It can obtain the $10 million with computer keystrokes. Thus, it gives up virtually nothing real ($0 of real stuff) to obtain $100 million of real stuff.
It is very different for a currency-user. For me to obtain $100 to purchase $100 of real stuff, I have to surrender $100 of something real. It could be my time ($100 of paid work), something I produce worth $100, or something I already possess worth $100. Another currency-user might gift me $100, but then it is the gifter who is surrendering $100, which they must have obtained by giving up something real worth $100. If I borrow $100 (my bank advances me $100 of credit money), I don’t give up something real worth $100 in the present, but I do so in the future, plus a bit more to pay the interest. Currency-users have 0% seigniorage.
Strictly speaking, the total spending of a CICG comes at no cost to it. It is wrong to say that a $100 million project funded by a CICG ‘cost’ the CICG $100 million. That said, the $100 million of real stuff obtained by the CICG to resource the project has cost society $100 million, assuming the $100 million is a reasonable approximation of the opportunity cost (OC) of using the resources. The resources in question, once used for the project, cannot be used for something else. Real resources can only be used in their original form once (second law of thermodynamics).
There is an OC associated with use of all real resources (because there are no free lunches). The customary use of a production possibility frontier (PPF) to explain the concept of OC is flawed. Once a society is on the PPF, it cannot move along the PPF, since it would involve reducing the quantity of something already produced to produce more of something else. In a PPF diagram, you can only move in a northerly direction (more Y and no more of X), a north-easterly direction (more Y and more X), or an easterly direction (more X and no more of Y), neither of which is possible once society is on the PPF (note: moving along a PPF entails a movement in a north-westerly or south-easterly direction).
You can, however, move in a northerly, north-easterly, or easterly direction if you are currently at a point inside the PPF and it represents the idleness of available resources. A PPF represents different possible production combinations when both (a) all available resources have been used and (b) the resources have been used in the technically most efficient manner. It is possible to be at a point inside the PPF; be using all available resources; but be using them inefficiently in a technical sense (not getting the most from the resources used).
If a society is inside the PPF because not all resources are being utilised, it must make choices about how the remaining resources should be used. If they are used to produce X, they are not available to produce Y (in a two-dimensional PPF diagram). Yes, the society can produce more X without having to enjoy less Y, but it can’t produce less Y once a certain quantity of Y (represented by the point inside the PPF) has been produced. Hence, if some of the remaining resources are used to produce more X, they can’t be used to produce more Y and the foregone Y (no additional Y) represents the OC of using some of the remaining resources to produce more X.
Since OCs to society are always present when available (unused) resources are put to use, CICGs need to consider the best use of the resources they acquire not unlike the non-government sector, even though the CICG can acquire real resources at no cost to itself, unlike currency-users. 100% seigniorage does not excuse CICGs from using resources in the best possible manner.
Re carbon prices: If the cost of carbon is reflected in higher prices for carbon-intensive goods, then rich and poor alike are likely to substitute towards low- or no-carbon goods. That takes time (people are unable to immediately substitute entirely towards low- or no-carbon goods), which will harm the poor if CICGs don’t compensate them. But CICGs have all the fiscal power they need to fully compensate the poor. Not a fiscal problem. Only a political problem (lack of political will).
Phil, I would rather not name names, because I don’t want to risk hindering the ‘MMT project’.
But the widespread confusion re terms such as ‘debt-free money’ (eg, did Mosler really deny such money exists?) hinders a simple concept which the public ought to be able to understand,
(compared with more in-depth analysis of ‘soft’ and ‘hard’, credit vs. base money. etc)
“CIGs can issue debt-free money”: a simple concept, if the public know the difference between a c-issuer and a c-user.
You wrote: “the $100 million of real stuff obtained by the CICG to resource the project *has cost society $100 million*, assuming the $100 million is a reasonable approximation of the opportunity cost (OC) of using the resources.”
And that’s what Frontier Economics (the Coalition’s climate advisor) says; they claim the ‘cost to society’ is material in a free market economy; my point is: the “OC to society” is immaterial if we MUST reach net zero by 2050; there are no “alternative” uses of the necessary resources IF the world is required to reach that goal (apart from choosing different technologies to get to that goal), ie, *free-market allocation of resources* is the problem, not the ‘monetary cost to society’ which is zero for the c-i which is governing the society. (I think we agree nuclear might not be necessary in Oz, but will be necessary in some other nations; the choice should not be determined by the ‘invisible hand’ free market, but by informed analysis.
[I thought the BIS was onto something when they said (at Davos, several years ago, reported in the Sydney Morning Herald et al) ): “central banks might have to buy the coal industry”, but of course the Coalition treasurer responded with “we won’t be doing that…”.]
Sorry, Neil, I wasn’t asking you to name names. It was a rhetorical question.
In a couple of my past comments, I have talked about what I consider to be the difference between a ‘debt’ and a ‘liability’. In my opinion, a debt is a liability that, in order to be extinguished, requires giving up something real that usually has some use value/intrinsic value. Using this definition, all debts are liabilities, but not all liabilities are debts. Since a CICG has 100% seigniorage (gives up nothing real to create base money to purchase real stuff), a CICG’s liabilities are not debts. The same doesn’t apply to a currency-user.
When a central bank issues bonds on behalf of a CICG, I believe it is issuing liabilities not debts. Therefore, I don’t talk in terms of CICG debt-issuance, but in terms of CICG liability-issuance.
I think the use of appropriate terms and appropriate framing is crucial to gaining a proper understanding of things. I have found that my use of the terms of ‘base money’, ‘credit money’, ‘debts’, liabilities’, ‘seigniorage’, ‘hard savings’, ‘soft savings’, ‘net fiscal injection’ rather than ‘budget deficit’, and ‘net fiscal drain’ rather than ‘budget surplus’ helps a lot of people. By the way, if they are useful terms, I can’t take credit for some of them. Using these terms, one can make the following distinctions:
▪ CICGs create base money; they incur liabilities (not debts); they have 100% seigniorage; their net-spending (net fiscal injections) creates hard (permanent) savings.
▪ Currency-users incur liabilities, all of which are debts; they have 0% seigniorage.
▪ Banks are a little different. They create credit money; they enjoy some seigniorage (they earn interest income on advances without giving up anything real); the credit money they advance into existence creates soft (temporary) savings which are destroyed upon repayment of the advances.
I think people can see these distinctions clearly once these terms are understood.
Whether banks should enjoy some seigniorage is a moot point. Personally, I believe they shouldn’t. I believe modern money is a public good and seigniorage is a form of economic rent (unearned income). The banking industry should be nationalised and all interest charged on credit money – which, to pay, requires currency-users to acquire hard savings – should be destroyed, just like a tax destroys hard savings. A variable interest rate that fluctuates in line with changes in the inflation rate should be charged on credit money to prevent borrowers from enjoying an economic rent – i.e., preventing them from paying back an amount in real terms (what they give up) that is less than the real value of the credit money they borrow (what they gain when they spend credit money).
As for opportunity cost (OC). I agree with you 100%. I’m first and foremost an Ecological Economist. I believe in the policy trilogy of (1) sustainable scale of the economy; (2) distributional equity (which includes upholding a full employment imperative and other basic human rights); and allocative efficiency. They should be addressed in the order I’ve just given. Distributional equity and allocative efficiency mean nothing in an ecologically unsustainable world.
Ecological sustainability won’t be achieved unless society self-imposes a quantitative constraint on the throughput of matter-energy passing through the economy (the input of low-entropy m/e or what we refer to as natural resources and the output of high-entropy waste or what we refer to as pollution). At the global level, the throughput (Ecological Footprint or EF) is currently 1.75 times global Biocapacity (BC).
Taxes/charges on resource use and pollution generation are important, since they help reduce the throughput-intensity of GDP, but adjusted prices (from imposing throughput taxes) do not limit the growth in GDP. Hence, they cannot prevent the Jevons effect, which is where the throughput rises because the % increase in GDP overwhelms the % reduction in the throughput-intensity of GDP.
If a throughput constraint is imposed, the maximum increase in GDP is determined solely by the % reduction in the throughput-intensity of GDP. Given that global EF = global BC requires a 43% reduction in throughput ([(1.75 – 1)/1.75] x 100% = 43%), an ecologically sustainable Gross World Product (GWP) equal to its current level would not be possible without a 43% reduction in the throughput-intensity of GWP. A 43% reduction cannot be achieved overnight. Sacrifices will need to be made. They should be made those who would be least affected by them.
Mechanisms like a Job Guarantee (JG) are necessary to guarantee full employment as part of achieving distributional equity.
Allocative efficiency comes only after ecological sustainability and distributional equity concerns are first deal with. By then, allocative efficiency would involve making the best of an ecologically sustainable and distributionally equitable set of circumstances. That’s one of the problems with mainstream economics. It puts allocative efficiency first in the belief that achieving it avoids having to worry about the initial set of circumstances. That is, one Pareto efficient outcome is as desirable as any other Pareto efficient outcome. That’s not so. Would a mainstream economist prefer to be enjoying a Pareto efficient allocation of champagne and caviar during the half hour of remaining life on the deck of the Titanic or a Pareto inefficient allocation of blankets and warm clothing on a lifeboat? Of course, once on a lifeboat, a Pareto outcome would be preferred to an inefficient outcome, but then you are talking about making the best of the same (preferred) set of circumstances, not comparing the initial set of circumstances, of which the lifeboat scenario is clearly superior. The initial set of circumstances matter.
When it comes to climate change, as you raised, it matters most that we drastically reduce GHG emissions even if the near-term cost of using resources for mitigation purposes appears to be greater than the near-term cost in terms of sacrificed GDP. Ecological sustainability comes before allocative efficiency. However, the resources used for mitigation purposes still need to be used in the best possible manner, which requires OC comparisons.
It is important to recognise that the prior sustainable scale and distributional equity decisions would affect market prices (e.g., a throughput constraint would limit the supply of natural resources and raise natural resource prices, especially prices of non-renewable resources). Therefore, measures of the OCs of various options would be very different than if the prior scale and distribution decisions were not taken as per the mainstream approach. The OC of delaying mitigation would appear much higher and the most efficient means of achieving mitigation targets would be better promoted.
Ah, thanks for the detailed definitions.
So we can say: a *CICG can issue ‘liability free money’*, full -stop, using your definitions of different types of money (while avoiding the term “debt free money” for a CICG )?
Can we also say that is short-hand for saying: “CICG can issue public-sector ‘debt-free’ money when, and only when, *supply is managed to balance demand* (see below at ***) in the combined public and private sectors, (aka “the resources constraint”)?
Certainly verbose, in comparison with your definition of CICG-issued “liability-free money” – which is, however, difficult to grasp at first (eg, “all debt is liability, but not all liability is debt”, intended to encompass the issue of inflation (I think), an issue which I had to spell out in my proposition of CICG “debt free money”.
***…..a balance which will require a degree of mobilization of the nation’s resources via a dreaded “command economy” , rather than by the ‘invisible hand ‘ free market?
Personally I think a CICG should ‘command’ the resources needed to eg, ensure housing for everyone, in a mixed private-public sector economy, BEFORE the ‘invisible hand’ free-market is allowed to work its magic…
Thanks for a clearly presented interchange Neil and Philip. A few thoughts on words/terminology because I believe that they matter much more than most imagine.
Jargon is used within all silos of knowledge as a shorthand mode of expression of the ideas of art amongst the silo cohort. However, extending in-house language to talking to laypersons about those ideas often reveals how confusing terminology can be when attempting to convey an intended meaning to non-experts.
Philip says: “I think the use of appropriate terms and appropriate framing is crucial to gaining a proper understanding of things. I have found that my use of the terms of ‘base money’, ‘credit money’, ‘debts’, liabilities’, ‘seigniorage’, ‘hard savings’, ‘soft savings’, ‘net fiscal injection’ rather than ‘budget deficit’, and ‘net fiscal drain’ rather than ‘budget surplus’ helps a lot of people. By the way, if they are useful terms, I can’t take credit for some of them.
Using these terms, one can make the following distinctions:
▪ CICGs create base money; they incur liabilities (not debts); they have 100% seigniorage; their net-spending (net fiscal injections) creates hard (permanent) savings.
▪ Currency-users incur liabilities, all of which are debts; they have 0% seigniorage.
▪ Banks are a little different. They create credit money; they enjoy some seigniorage (they earn interest income on advances without giving up anything real); the credit money they advance into existence creates soft (temporary) savings which are destroyed upon repayment of the advances.”
In a long ago blogpost, Bill has called money which passes between government and non-government “high powered money” or HPM and which has also been called “vertical” money as “Only vertical transactions create/destroy assets that do not have corresponding liabilities.” While “horizontal” money describes credit creation money.
I wholeheartedly support getting to a best possible jargon which should be as intuitive/self explanatory as possible for an audience which, in the case of MMT, is likely to be all too ready to find fault, even though there is none to the logic of descriptive MMT.
“This is the origin of modern money as nothing for something on the part of the legitimate user; as something for nothing on the part of the issuer; and as something for a promise to pay it back on the part of the borrower, with sufficient security to whom the issuer transferred the acquisition of the something accruing gratis from the issue.” was how Frederick Soddy described the differing money creation aspects at p.49 of The Role of Money (1934).
Am all in on public banking with public money being a utility of the state. Licensing private banking grants a right to a select few to privately “tax” the non-government for the use of the people’s money.
Thanks Fred.
I’m a great admirer of Soddy, especially his “Wealth, Virtual Wealth, and Debt” (1926), for all its shortcomings. I recommend this book to everyone.
I see things a bit differently to Soddy. I’d consider modern money as “something for something” when a currency user spends modern money they have genuinely earnt (0% seigniorage); “a large something for nothing” when a CICG creates and spends modern money (100% seigniorage); “a small something for nothing” when a financial institution creates and advances credit money and charges interest on it (some seigniorage); “something surrendered now to have something later on” when a currency user saves base money; and “something surrendered later on to have something now” when a currency user borrows credit money.
The more things change, the more they stay the same. 100 years ago in Wealth, Virtual Wealth and Debt, its author wrote: “The people frankly in this respect have given up real hope that Governments, of whatever complexion, will find any solution even for any of the immediate practical problems of the day, and it is a period of marking time.”
And what “respect” was he writing about?
Well, our all engrossing subject, of course: “nobody seems to have any real understanding of how the economic system works at all or why it works so dangerously”.
1925 = 2025 so far as mainstream economics is concerned. Why hasn’t the citizenry risen up against the charlatans within those last 100 years? The power of propaganda is my best guess.
Your copy is available gratis online https://ia800208.us.archive.org/20/items/soddy-f.-wealth-virtual-wealth-and-debt-1925/SODDY%28F.%29-Wealth_Virtual_Wealth_and_Debt_%281925%29.pdf
Fred: Yes, I often tell people we are living in the ’20s – the 1920s but with technological advances and a world now full of human beings and human-made stuff and less natural stuff.
The immediate post-WW2 period was unique in that it was the closest the masses ever got to having governments and the economy operate for the benefit of society (an economy based on oikonomic principles). It was made possible by the impact of two unprecedented back-to-back events – the Great Depression and WW2. For nearly twenty years, vulnerable people were forced to make great sacrifices. A lot of physical wealth owned by the rich and powerful was destroyed by war and/or rundown from inadequate maintenance due to a collapse in spending during the GD. The WW2 spending went towards winning the war. A lot of industries were nationalised and governments and the masses could see for themselves what government ownership could achieve. At the end of WW2, those who made great sacrifices would not accept anything less than a job and a share in the growing wealth. The world also got a dose of moral shock treatment. You had to be seen to be doing the right thing.
The post-WW2 period was far from perfect. The North was still exploiting the South despite the granting of independence to many colonialised nations. Also, the post-WW2 growth, which was needed at the time, was aimless and often purposeless – growth for growth’s sake. It needed to be undertaken with the aim of transitioning from a growth-based industrial society reliant on non-renewable resources (fossil fuels) to a steady-state post-industrial society reliant on renewable resources. This transition should have been completed decades ago. It hasn’t even begun!
Humankind stuffed up in the 1970s. That’s when the writing was on the wall (Ehrlich (1968), “Population Bomb”; Club of Rome (1972), “Limits to Growth”; Daly (1973), “Towards a Steady-State Economy”). Young people enjoying the fruits of their parents and grandparents recognised there was more life than the accumulation of physical wealth. The oil price hikes of 1973 and 1979 revealed that the global economy was too heavily dependent on oil for transportation and coal for electricity generation. The world looked at itself in the mirror, didn’t like what it saw, and chose more of the past.
Economists didn’t help when they confused cost-push inflation with demand-pull inflation and wrongly recommended government spending cuts to quell inflation. The world experienced a decade of stagflation. It wanted a solution. In the background was the neoliberal machine that had been building during the post-WW2 period (e.g., Mont Pelerin Society) just waiting their turn. Their opportunity came when the world was conned into believing that neoliberalism (institutionalised chrematistics) was the solution.
Here we are in the 2020s back where we were in the 1920s, except in a world that is overpopulated, has nuclear weapons, is on the brink of ecological collapse, and has complete nutcases pushing the buttons and pulling the strings. We are much less able to make the required transition to a sustainable and equitable world than we were in the early-1970s – a time when we should have been well on the way to a post-industrial existence.
Fred Schilling writes (April 13th)
“CICGs create base money; they incur liabilities (not debts); they have 100% seigniorage; …”
I’m interpreting that last point to mean: ‘CICGs can issue debt free (ie interest-free) money’ – which seems to contradict the 2nd point about ‘incurring’ liabilities (even though (CICG) liabilities are not debt, (if I understood correctly) .
How many errors have I made – and see how easily the average layman can get bamboozled by all this terminology regarding something (money) which apparently is created ‘ex nihilo’ – assuming I’m not dumber than the average layman who urgently needs to understand the difference between household and CICG budgets, before neoliberloism can ever be displaced from its currently-unassailable position.
Anyway, thanks to you and Phil, whose last post (April 15th) is a brilliant (though depressing) exposition of the course of economic history over the last century, and where we are at today.
What a cracking read is Wealth, Virtual Wealth and Debt. So many “Aha” moments. Should be compulsory for all economists and economics students (as well as technologists and everybody else). How dare a scientist and polymath tell economists what’s wrong with their thinking.
A few extracts follow to provide the essence of Soddy’s thesis and perhaps incite others to read him:
At page 58: “to people who think of wealth not in terms of energy and human endeavour but in terms of money-tokens, there seems to be nothing incongruous in the continuance of the acute economic suffering into which Europe has been plunged…… failure……of government in…… unemployment and poverty at one and the same time.”. An equivalent to Keynes’s “Anything we can actually do we can afford.”
At page 70: “The early economists did, ….., attempt to deal with it (wealth); but the modern school has more and more taken it and its origins for granted and confined themselves to the study of debt, or, as we shall see, with chrematistics rather than economics……… Unlike wealth, which is subject to the laws of themodynamics, debts do not rot with old age and are not consumed in the process of living.
.
It is this underlying confusion between wealth and debt which has made such a tragedy of the scientific era”
At page 71: “Historians of the -let us hope- happier future in store for humanity will probably find it difficult to believe that in a scientific age such an error could have exercised the sway over the human mind that it actually does in this third decade of the twentieth century.”
And personally interesting for me was some discussion of the work of C H Douglas (pp. 255, 258 & 299), which is where I commenced my enquiries into macroeconomics ultimately leading to MMT.
I can’t thank you enough Philip for the reference to Wealth, Virtual Wealth and Debt that joined so many dots in connecting money, energy and economics.
However, you may be interested to learn that a prior to Podolynsky and the thoughts of Frederick Soddy who had linked energy/thermodynamics to economics was Erasmus Peshine Smith https://michael-hudson.com/2012/12/e-peshine-smith-a-study-in-protectionist-growth-theory-and-american-sectionalism/ the key to productivity = energy use/worker (at 1:15:34) – see Michael Hudson’s PhD thesis from 1969 https://michael-hudson.com/wp-content/uploads/2012/12/Hudson-Michael-E-Peshine-Smith-A-Study-in-Protectionist-Growth-Theory-American-Sectionalism.pdf. Hudson explains in his SUMMARY “In attributing economic growth mainly to a man’s control over energy…… Indeed it portrayed capital in a role which the Physiocrats had a century earlier bestowed upon land, namely, as the productive factor which uniquely tapped nature’s productive powers. This energy-theory of capital also represented nature rather than “labor” as the “exploited factor” in production. It was society’s energy-mobilizing abilities, he described, that were responsible in the final analysis for its growing economic surplus – and not any saving from diverting economic resources from labor to capital or from the consumption function to the investment function as portrayed in the British economic literature of the period.”
From page 75 at “Using energy concepts to represent the input and output of productive factors, he …enunciated, portraying the energy surpluses made available by industrial capital as the primary motive force in increasing productivity.”; and
Chapter V from page 78 “In elaborating these concepts he attributed economic growth to man’s growing command of nature’s energy resources.” And following. “Peshine Smith took an industrial engineering approach to political economy. All economic phenomena he described in terms of energy flows.”……. “His measure of value therefore consisted of caloric-energy units rather than the manhours that had formed the basis for the Ricardian value theory.”
“But it was just this ratio of industrial energy to human labor ratio, Peshine Smith emphasised, that represented society’s wealth producing power. Simply stated economic growth consisted of the per capita increase in society’s harnessing of industrial power.”
Both labor and capital were in fact treated as energy converters, whose productivity was determined by the efficiency with which they converted the respective value of their ‘fuels’ into work energy.”
Peshine Smith, the first engineering economist of the modern (industrial revolution) era?
It seems that Peshine Smith was the first link in the ecological economics chain following the Physiocrats and prior to Podolynsky who was then followed by Soddy.