Go back to the headlines in 2010 - – “Countries with debt over 90 percent…
Australia’s inflation rate continues to fall yet some bank economists think further interest rate rises are possible
Yesterday (April 24, 2024), the Australian Bureau of Statistics (ABS) released the latest – Consumer Price Index, Australia – for the March-quarter 2024. The data showed that the inflation rate continues to fall – down to 3.6 per cent from 4 per cent in line with global supply trends. There is nothing in this quarterly release that would justify further interest rate rises. Despite that reality the national broadcaster has wheeled out a few bank and/or financial market economists who claim we cannot rule out further interest rate rises. That is their wish because it improves the bottom line of their companies. But it is arrant nonsense based on the reality and it is a pity that the national broadcaster cannot present a more balanced view on this.
The summary, seasonally-adjusted Consumer Price Index results for the March-quarter 2024 are as follows:
- The All Groups CPI rose by 1.0 per cent for the quarter (up from 0.6 last quarter).
- The All Groups CPI rose by 3.6 per cent over the 12 months (down from 4 per cent last quarter).
- The Trimmed mean series rose by 1 per cent for the quarter (up from 0.8) and 4 per cent over the previous year (down from 4.2 per cent).
- The Weighted median series rose by 1.1 per cent (up from 0.9) for the quarter and 4.4 per cent over the previous year (steady).
- Food and non-alcoholic beverages rose by 3.76 per cent (4.46 per cent in December).
- Clothing and footwear steady at 0.42 per cent (-1.11 in December).
- Housing 4.87 per cent (6.12 per cent in December).
- Furnishings and household equipment 0.17 per cent (-.025 per cent in December).
- Health 4.12 per cent (5.13 per cent in December).
- Transport 3.55 per cent (3.65 per cent in December).
- Communications 1.8 per cent (2.2 per cent in December).
- Recreation and culture 0.2 per cent (0.5 per cent in December).
- Education 5.2 per cent (4.7 per cent in December).
- Insurance and financial services steady at 8.2 per cent.
The ABS Media Release (April 24, 2024) – CPI rose 1.0% in the March 2024 quarter – noted that:
Annually, the CPI rose 3.6 per cent to the March 2024 quarter. While prices continued to rise for most goods and services, annual CPI inflation was down from 4.1 per cent last quarter and has fallen from the peak of 7.8 per cent in December 2022. …
The most significant contributors to the March quarter rise were Education (+5.9 per cent), Health (+2.8 per cent), Housing (+0.7 per cent), and Food and non-alcoholic beverages (+0.9 per cent) …
Rental prices rose 2.1 per cent for the quarter in line with low vacancy rates across the capital cities. Rents continue to increase at their fastest rate in 15 years …
So a few observations:
1. The annual inflation rate continues to fall as the supply constraints across most components ease.
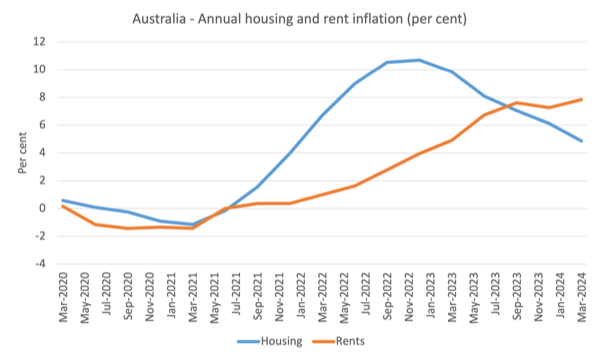
2. Housing inflation has fallen from 10.7 per cent in December 2022 to 4.8 per cent in March 2024, rent inflation continues to rise.
3. While housing contributed 0.23 points to the overall quarterly figure, rents contributed 0.17 points – so the dominant component.
4. The rent inflation is due to tight supply (a combination of a ridiculously fast population growth spawned by much larger immigration numbers over the last year) and a failure by governments to invest in social housing over the last several decades.
5. However, given the tight supply, the rent increases are being driven by the RBA’s own rate hikes as landlords in a tight housing market just pass on the higher borrowing costs – so the so-called inflation-fighting rate hikes are now a significant force in driving inflation.
This graph shows that housing inflation peaked in the December-quarter 2022 and has been steadily declining ever since.
However, the rental sub-component has been rising more or less since the RBA started hiking rates and is now the major reason the housing inflation rate is still around 4.8 per cent per annum.
6. The education component is being driven by the massive hikes in private schooling fees and we can conjecture that the parents are likely to be the recipients of the flush of interest income on their wealth holdings, while the RBA punishes the lower income groups who hold mortgages. A major equity disaster.
4. Note that fiscal policy measures with respect to electricity prices subsidies continue to reduce that pressure. The Federal government could have done much more to relieve the pressure on households of these temporary cost-of-living rises over the last two years.
The general conclusion is that the global factors that were responsible for the inflation pressures are abating fairly quickly as the world adapts to Covid, Ukraine and OPEC profit gouging.
The ABC news report on the data release – Annual inflation slows to 3.6 per cent as higher than expected price rise in March quarter rules out early rate cut hopes (April 24, 2024) – chose to quote an economist from one of the big four banks in Australia who claimed that:
You can’t write off the possibility of the next move being a hike rather than a cut …
And another financial institution economist said:
This inflation data will certainly renew some of that debate around whether we actually need to see higher interest rates …
Of course these characters would sow doubt and suggest another hike would not be implausible.
They are hardly ‘independent’ or neutral commentators, given their employing institutions have benefitted greatly from the recent rate hikes.
I know some readers have been skeptical of my previous statements that the rising interest rates have been good for the banks.
Their argument seems to be that the return on equity has taken a hit since 2022 as a result of the 11 rate hikes since May 2022 by the RBA.
Well the data supports my conclusion fairly definitively.
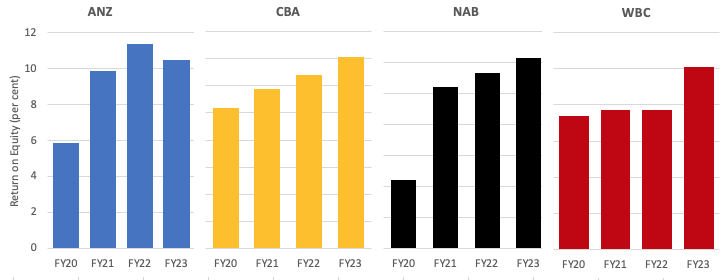
Here is the data for the last 4 fiscal years for the big four banks in Australia who dominate the non-competitive banking sector.
ANZ took a slight dip in rate of return on equity in FY23 but relative to FY20 and FY21 they are still generating massive returns.
Overall, the big four banks increased their return on equity by 125 basis points in 2023 to generate 12 per cent overall.
Their net interest margin rose 11 basis points to 1.85 per cent.
Their earning rose 8.2 per cent to $A31.99 billion.
A 12 per cent return on equity is ridiculously high and tells us that the degree of competition is low in that sector.
The mania for more monetary policy tightening is crazy.
The narrative offered is either that yesterday’s data revealed that the inflation rate was above forecast or that it is not falling quickly enough.
Think about that for a second.
Which forecast? The bank economists who continually get things wrong.
Falling quickly enough – the inflation rate has fallen from 7.8 per cent in the December-quarter 2022 to 3.6 per cent in the March-quarter 2024.
Between that time it has fallen each quarter by:
March-quarter 2023 – 0.8 points
June-quarter 2024 – 0.8 points
September-quarter 2024 – 0.9 points
December-quarter 2023 – 1.3 points
March-quarter 2024 – 0.4 points
The current quarter would have fallen much more if the rents inflation hadn’t accelerated.
Who is to blame for that? See above.
Trends in inflation
Over the 12 months to December the inflation rate was 3.6 per cent (down from 4).
The peak was in the December-quarter 2022 when the inflation rate high 7.8 per cent.
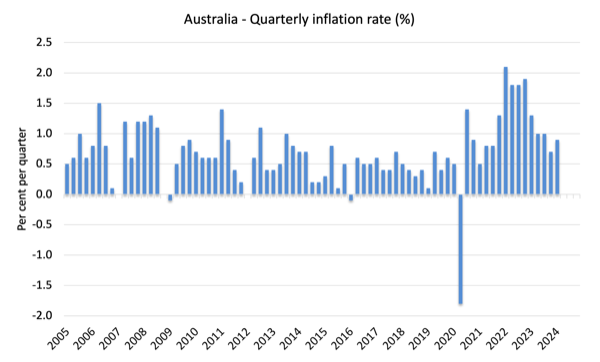
The following graph shows the quarterly inflation rate since the March-quarter 2005.
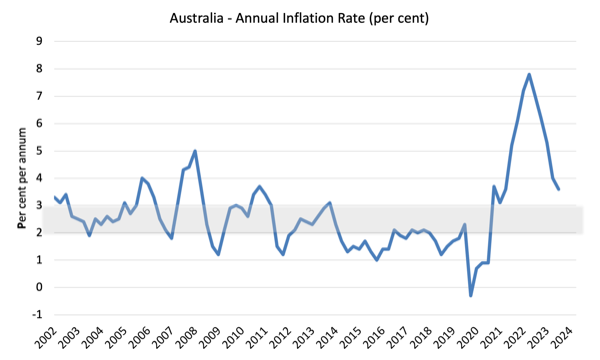
The next graph shows the annual headline inflation rate since the first-quarter 2002. The shaded area is the RBA’s so-called targetting range (but read below for an interpretation).
What is driving inflation in Australia?
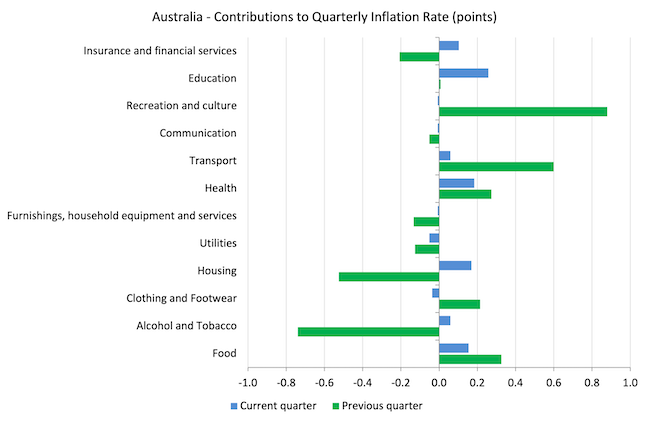
The following bar chart compares the contributions to the quarterly change in the CPI for the March-quarter 2024 (blue bars) compared to the December-quarter 2023 (green bars).
Note that Utilities is a sub-group of Housing and are significantly impacted by government administrative decisions, which allow the privatised companies to push up prices each year, usually well in excess of CPI movements.
One of the main drivers – housing – arises from the supply shortage where the years of neglect by governments in supplying adequate housing for low-income families is now coming home to roost.
However, that contribution fell significantly in the last quarter relative to the September-quarter 2023.
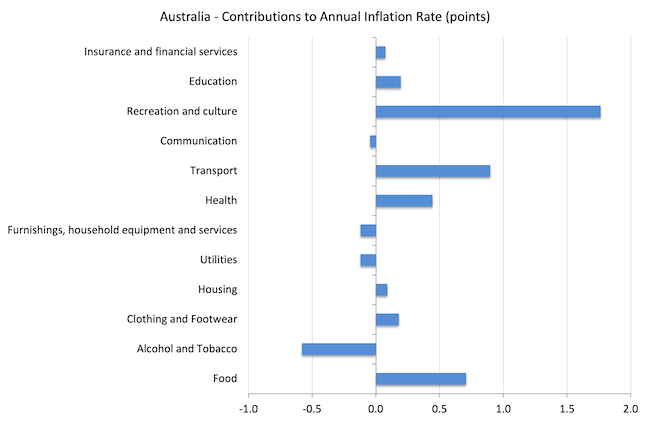
The next graph shows the contributions in points to the annual inflation rate by the various components.
The Recreation and culture components reflects the boom in international travel following the Covid restrictions easing.
It will drop out in the coming quarters which will drive the annual inflation rate down significantly.
Inflation and Expected Inflation
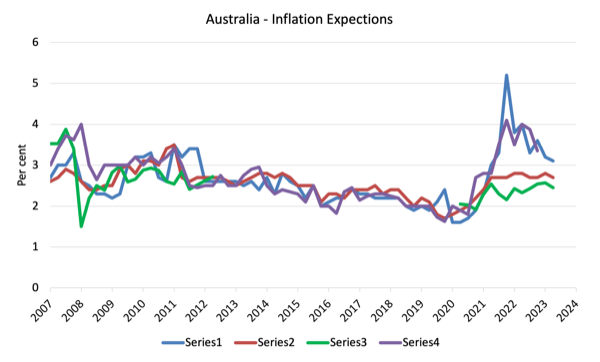
The following graph shows four measures of expected inflation produced by the RBA from the March-quarter 2005 to the March-quarter 2023.
The four measures are:
1. Market economists’ inflation expectations – 1-year ahead.
2. Market economists’ inflation expectations – 2-year ahead – so what they think inflation will be in 2 years time.
3. Break-even 10-year inflation rate – The average annual inflation rate implied by the difference between 10-year nominal bond yield and 10-year inflation indexed bond yield. This is a measure of the market sentiment to inflation risk. This is considered the most reliable indicator.
4. Union officials’ inflation expectations – 2-year ahead – this series hasn’t been updated since the September-quarter 2023.
Notwithstanding the systematic errors in the forecasts, the price expectations (as measured by these series) are now falling.
In the case of the Market economists’ inflation expectations – 2-year ahead and the Break-even 10-year inflation rate, the expectations remain well within the RBA’s inflation targetting range (2-3 per cent) and show no signs of accelerating.
So all the talk now is that inflation is not falling fast enough – and that claim is accompanied by claims that the longer it remains above the inflation targetting range, the more likely it is that a wage-price spiral and/or accelerating (unanchored) expectations will drive the rate up for longer.
Neither claim can be remotely justified given the data.
Implications for monetary policy
What does this all mean for monetary policy?
The Consumer Price Index (CPI) is designed to reflect a broad basket of goods and services (the ‘regimen’) which are representative of the cost of living. You can learn more about the CPI regimen HERE.
The RBA’s formal inflation targeting rule aims to keep annual inflation rate (measured by the consumer price index) between 2 and 3 per cent over the medium term.
However, the RBA uses a range of measures to ascertain whether they believe there are persistent inflation threats.
Please read my blog post – Australian inflation trending down – lower oil prices and subdued economy – for a detailed discussion about the use of the headline rate of inflation and other analytical inflation measures.
The RBA does not rely on the ‘headline’ inflation rate. Instead, they use two measures of underlying inflation which attempt to net out the most volatile price movements.
The concept of underlying inflation is an attempt to separate the trend (“the persistent component of inflation) from the short-term fluctuations in prices. The main source of short-term ‘noise’ comes from “fluctuations in commodity markets and agricultural conditions, policy changes, or seasonal or infrequent price resetting”.
The RBA uses several different measures of underlying inflation which are generally categorised as ‘exclusion-based measures’ and ‘trimmed-mean measures’.
So, you can exclude “a particular set of volatile items – namely fruit, vegetables and automotive fuel” to get a better picture of the “persistent inflation pressures in the economy”. The main weaknesses with this method is that there can be “large temporary movements in components of the CPI that are not excluded” and volatile components can still be trending up (as in energy prices) or down.
The alternative trimmed-mean measures are popular among central bankers.
The authors say:
The trimmed-mean rate of inflation is defined as the average rate of inflation after “trimming” away a certain percentage of the distribution of price changes at both ends of that distribution. These measures are calculated by ordering the seasonally adjusted price changes for all CPI components in any period from lowest to highest, trimming away those that lie at the two outer edges of the distribution of price changes for that period, and then calculating an average inflation rate from the remaining set of price changes.
So you get some measure of central tendency not by exclusion but by giving lower weighting to volatile elements. Two trimmed measures are used by the RBA: (a) “the 15 per cent trimmed mean (which trims away the 15 per cent of items with both the smallest and largest price changes)”; and (b) “the weighted median (which is the price change at the 50th percentile by weight of the distribution of price changes)”.
So what has been happening with these different measures?
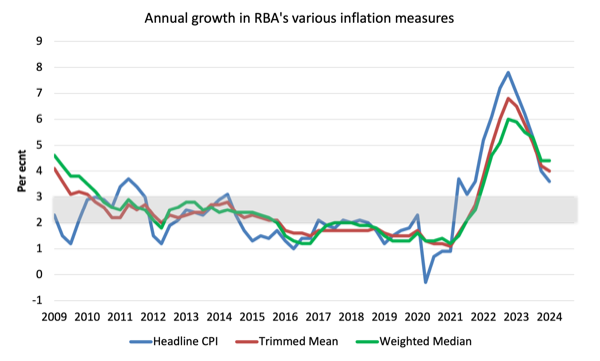
The following graph shows the three main inflation series published by the ABS since the March-quarter 2009 – the annual percentage change in the All items CPI (blue line); the annual changes in the weighted median (green line) and the trimmed mean (red line).
The RBAs inflation targetting band is 2 to 3 per cent (shaded area). The data is seasonally-adjusted.
The three measures are in annual terms:
1. The All Groups CPI rose by 1.0 per cent for the quarter (up from 0.6 last quarter) and 3.6 per cent over the 12 months (down from 4 per cent last quarter).
2. The Trimmed mean series rose by 1 per cent for the quarter (up from 0.8) and 4 per cent over the previous year (down from 4.2 per cent).
3. The Weighted median series rose by 1.1 per cent (up from 0.9) for the quarter and 4.4 per cent over the previous year (steady).
How to we assess these results?
1. The RBA’s preferred measures remain outside the targetting range and they have been using that fact to justify their rate hikes since May 2022 even though the factors that have been driving the inflation until late 2022 were not sensitive to the interest rate increases.
2. They also claimed the NAIRU was 4.25 per cent and with unemployment stable at around 3.9 per cent, they considered that justified further rate rises. However, if inflation is falling consistently with a stable unemployment rate then the NAIRU must be below the current rate of 3.9 per cent.
3. There is no evidence that inflationary expectations are accelerating – quite the opposite and that has been the case for some months now.
4. There is no significant wages pressure.
5. A major contributor to the current situation – rents – are, in part, being pushed up by the interest rate rises.
7. There is no justification for any further rate rises, especially given the slowdown in retail sales noted above.
Conclusion
The latest CPI data showed that inflation continues to decline in Australia in line with trends around the globe.
This was always a transitory, supply-side inflation, which meant that demand-side measures (interest rate hikes) were totally inappropriate.
That is enough for today!
(c) Copyright 2024 William Mitchell. All Rights Reserved
Australia has a transition energy problem.
Highlighted by Longford gas refinery for Victorians being reduced from 2028.
An OPEC supply that continues to be squeezed and a petroleum product storage capacity that is insufficient.
The transition is frankly a mess, i dont know what’s really going on politically behind closed doors.
But the east coast cartel are certainly getting their way with high exports from the north. I doubt they will invest in supplying Victoria.
Coal gets exported in massive volumes yet the domestic energy supply is soaring.
What good is a natural resources inventory when governments favour corporate profits at the expense of voters.
It should be the other way around, no?
Surely SOE, right? Lobby groups are too powerful now I think
I would like to add that insurance premiums are soaring even higher, well above inflation. I have heard of stories where people who cant afford insurance premiums feel that a go fund me is a better alternative. Because of cost burden.
I am not seeing much in the way of fiscal assistance from the commonwealth to deliver a better quality or standard of living. From incompetent handling of climate change that is creating disasters of a more frequent and higher intensity than before.
Favouring the support of wars rather than the securing of supply chain for sustainability.
I am not like where this current form of democracy is heading because it certainly is not delivering what it should be. All i hear is the sound bites from political feathering of nests to get a vote. Why not just get on and do what is needed. This posturing from a politically polarised democracy is why i believe the global north is going backwards by not being able to deliver better public services and employment stability.
MMT certainly shows what is really going on economically.
Surely, there could be a better marriage between politics and economics to deliver a better quality of life for all.
Hey Professor Mitchell
Is there anyway to get your blog updates sent to me via email? I just spent the last five minutes trying to find if I could subscribe but couldn’t see any evident link allowing me to do so.
“The transition is frankly a mess…“
A case of raising false hopes. Despite the seductive promise of limitless, green power to reduce and replace the burning of fossil fuels, there is a growing realisation that such a goal is simply not possible without reliance on oil and other hydrocarbons – and is far from sustainable or desirable.
https://dothemath.ucsd.edu/2024/02/unsustainable-goose-chases/
Imagine for a moment that we discover a magic solution to replace fossil fuels and provides us with more power than we use presently. What would happen? We would use it to prolong our social and economic activities as before, which will simply accelerate our demise. It is human activity that must change – our raison d’être – a conversation few people, not just the politicians care to have, for they have become addicted to modernity; it’s the only game they know.
Kind regards.
The financial services and Insurance contribution to annual inflation is a lot less than I would have expected based on my recent experience.
Would that be because many people are simply dropping out of insurance because they can no longer afford it?