The Australian Bureau of Statistics (ABS) released the latest labour force data today (July 23,…
Australia labour market – weakening under the brunt of poor policy, 10.7 per cent underutilisation rate
Today (February 15, 2024), the Australian Bureau of Statistics released the latest – Labour Force, Australia – for January 2024, which confirms a weakening in the labour market. The signs of a slowdown were appearing in late 2023 and the January figures probably confirm that trend, although the changing holiday behaviour makes it difficult to be definitive. We will know more next month when the holiday period effects wash out. Employment growth was unable to even keep pace with the underlying population growth, which is why unemployment rose with participation constant. The best indicators that the labour market is weakening are the fall in the employment-to-population rate since November 2023 (down 0.5 points) and the sharp decline over the last few months in hours worked. It also appears that the slowdown is impacting teenagers disproportionately. There are now 10.7 per cent of the available and willing working age population who are being wasted in one way or another – either unemployed or underemployed and that proportion is increasing. Australia is not near full employment despite the claims by the mainstream commentators and it is hard to characterise this as a ‘tight’ labour market.
The summary ABS Labour Force (seasonally adjusted) estimates for January 2024 are:
- Employment rose 500 (0.0 per cent) – full-time employment increased by 11.1 thousand and part-time employment decreased by 10.6 thousand. Part-time share of total was 30.5 per cent.
- Unemployment rose 22,300 to 600,600 persons.
- The official unemployment rate increased to 4.1 per cent (+0.2 points).
- The participation rate was steady at 66.8 per cent.
- The employment-population ratio fell by 0.1 point to 64.1 per cent.
- Aggregate monthly hours fell by 49 million hours (-2.5 per cent).
- Underemployment rate rose 0.1 point to 6.6 per cent (+20.3 thousand). Overall there are 993.5 thousand underemployed workers. The total labour underutilisation rate (unemployment plus underemployment) rose 0.3 points to 10.7 per cent. There were a total of 1,584.1 thousand workers either unemployed or underemployed.
In the ABS Media Release – Unemployment rate rises to 4.1 per cent in January – the ABS noted that:
With employment remaining stable and the number of unemployed increasing by 22,000 people, the unemployment rate rose to 4.1 per cent in January.
… This was the first time in two years, since January 2022, that the unemployment rate had been above 4 per cent …
Since October 2023, the annual growth rate in hours worked has slowed considerably, down to 0.7 per cent in January 2024, and well below the annual employment growth of 2.6 per cent …
Conclusion: It is difficult to be definitive about the January result because since the pandemic, the pattern of holiday leave has changed and more people work no hours during this month.
Evidently, a number of those working zero hours in January indicated in the survey that they would resume work in February.
However, the fact remains that there has been an on-going slowdown in hours worked over the last several months, which indicates a more general slowdown in spending growth, that has been evident in the retail sales data.
Further, the employment-to-population ratio, which is a fairly reliable indicator of the strength of the labour market has fallen by 0.5 points since November 2023, and that signals increasing weakness.
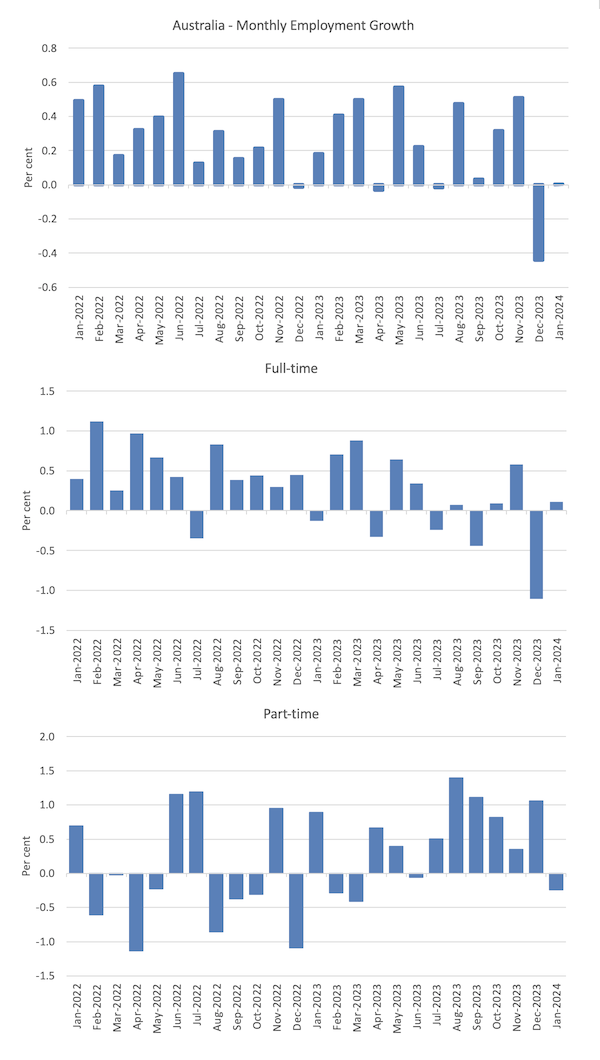
Employment rose 500 (0.0 per cent) in January 2024
1. Full-time employment increased by 11.1 thousand (0.1 per cent) and part-time employment decreased by 10.6 thousand (-0.2 per cent)
2. The employment-population ratio fell by 0.1 point to 64.1 per cent.
The following graph show the month by month growth in total, full-time, and part-time employment or the 24 months to January 2024 using seasonally adjusted data.
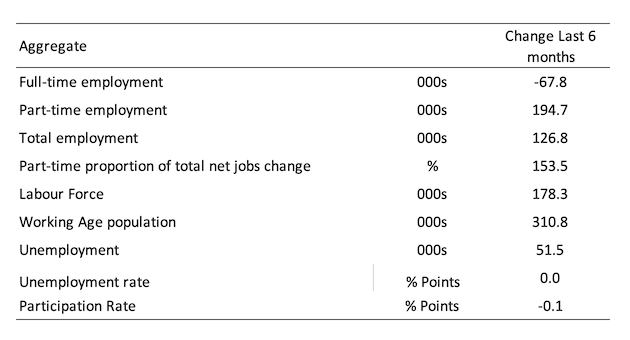
The following table provides an accounting summary of the labour market performance over the last six months to provide a longer perspective that cuts through the monthly variability and provides a better assessment of the trends.
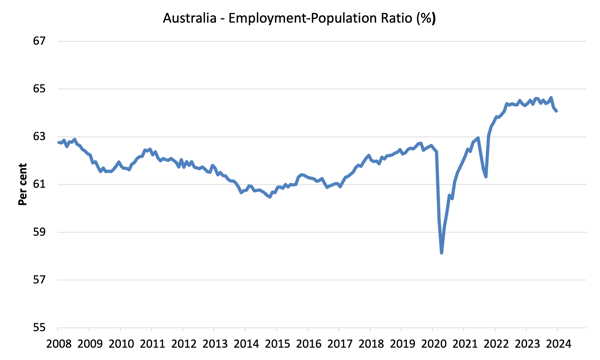
Given the variation in the labour force estimates, it is sometimes useful to examine the Employment-to-Population ratio (%) because the underlying population estimates (denominator) are less cyclical and subject to variation than the labour force estimates. This is an alternative measure of the robustness of activity to the unemployment rate, which is sensitive to those labour force swings.
The following graph shows the Employment-to-Population ratio, since January 2008 (that is, since the GFC).
The ratio fell by 0.1 point to 64.1 per cent in January 2024.
After an extended period of stability, the employment-to-population ratio is now in decline having fallen 0.5 points since November 2023.
This is a reliable sign that the labour market is now buckling under the dual impact of higher interest rates and a government recording fiscal surpluses.
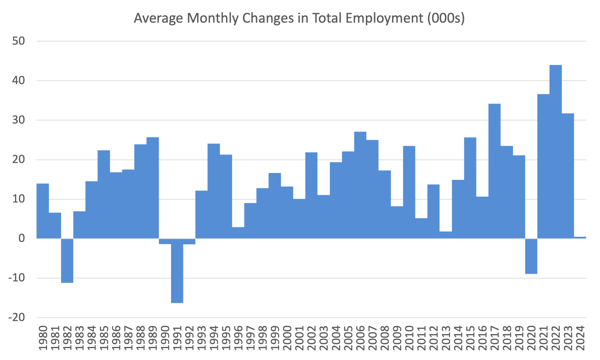
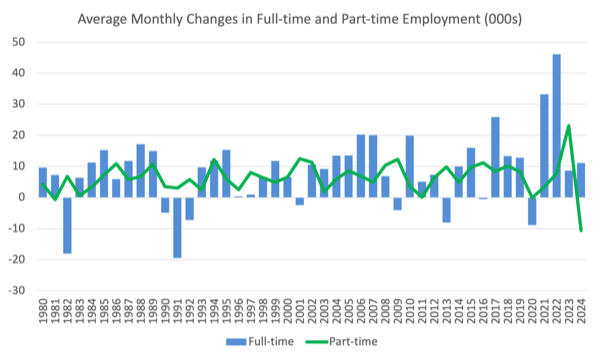
For perspective, the following graph shows the average monthly employment change for the calendar years from 1980 to 2023.
1. The average employment change over 2020 was -8.9 thousand which rose to 36.6 thousand in 2021 as the lockdowns eased.
2. For 2022, the average monthly change was 44 thousand, and for 2023, the average change was 31.8 thousand.
3. So far in 2024, the change is 0.5 thousand.
The following graph shows the average monthly changes in Full-time and Part-time employment in thousands since 1980.
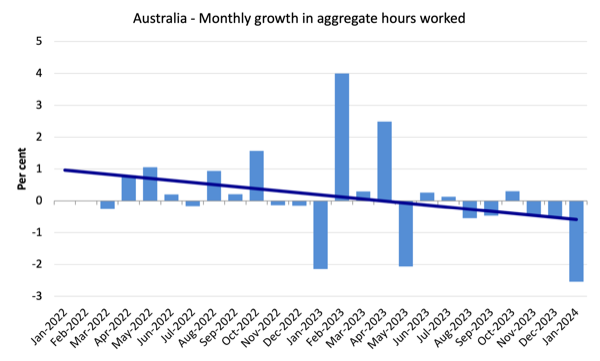
Aggregate monthly hours fell 48.8 million hours (-2.54 per cent) in January 2024
The relatively large drop in hours worked may reflect changes in behaviour as to when holiday leave is taken – there is evidence that more people are now working zero hours in January than before.
But there has been a decline in hours worked for three consecutive months now, which probably signals a weakening labour market.
The following graph shows the monthly growth (in per cent) over the last 48 months (with the pandemic restriction period omitted).
The dark linear line is a simple regression trend of the monthly change.
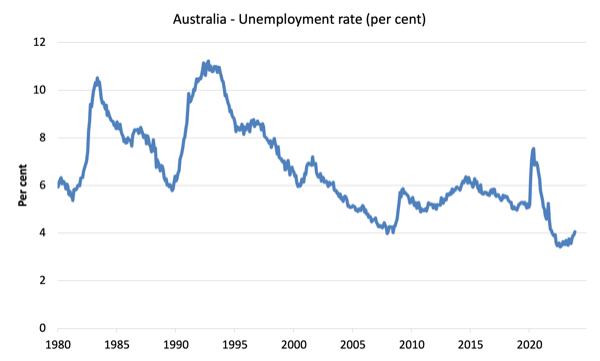
Unemployment rose 22,300 to 600,600 persons in January 2024
Unemployment rose this month because employment growth was so weak that it failed to absorb the underlying growth in the population.
The following graph shows the national unemployment rate from January 1980 to January 2024. The longer time-series helps frame some perspective to what is happening at present.
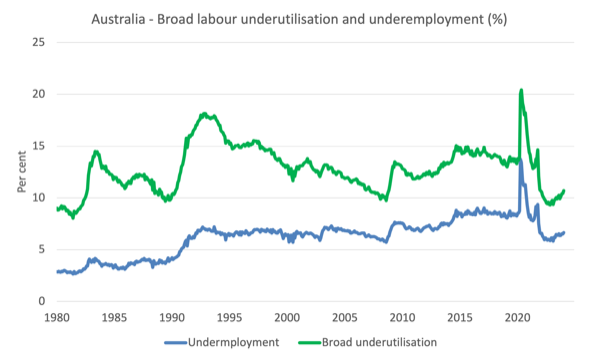
Broad labour underutilisation rose 0.3 points to 10.7 in January 2024
1. Underemployment rate rose 0.1 point to 6.6 per cent (+20.3 thousand).
2. Overall there are 993.5 thousand underemployed workers.
3. The total labour underutilisation rate (unemployment plus underemployment) rose 0.3 points to 10.7 per cent.
4. There were a total of 1,584.1 thousand workers either unemployed or underemployed.
It means that 10.7 per cent of available and willing workers are without work in one way or another (unemployed or underemployed), which makes a mockery of claims by economic commentators and policy officials that Australia is near full employment or that this is a tight labour market.
The following graph plots the seasonally-adjusted underemployment rate in Australia from April 1980 to the January 2024 (blue line) and the broad underutilisation rate over the same period (green line).
The difference between the two lines is the unemployment rate.
Teenage labour market deteriorated sharply in January 2024
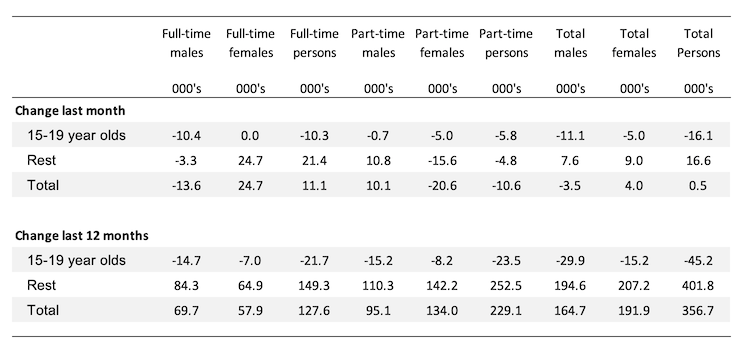
Overall teenage employment fell by 16.1 thousand with full-time employment falling 10.3 thousand and part-time employment falling by 5.8 thousand.
The following Table shows the distribution of net employment creation in the last month and the last 12 months by full-time/part-time status and age/gender category (15-19 year olds and the rest).
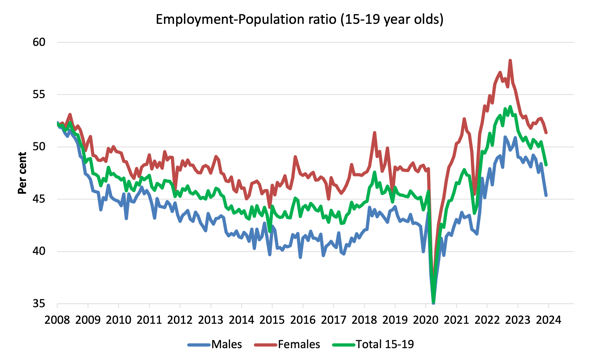
To put the teenage employment situation in a scale context (relative to their size in the population) the following graph shows the Employment-Population ratios for males, females and total 15-19 year olds since July 2008.
You can interpret this graph as depicting the change in employment relative to the underlying population of each cohort.
In terms of the recent dynamics:
1. The male ratio fell 1.5 points over the month.
2. The female ratio fell 0.8 points over the month.
3. The overall teenage employment-population ratio fell 1.1 points over the month.
The graph shows that there has been an on-going deterioration in the job opportunities for the growing teenage population since November 2022.
The RBA’s desire to deliberately create unemployment in Australia has probably damaged this cohort more than any.
And this cohort is the future workers who we will depend on for higher productivity as the population ages.
It is smart policy (not!) to undermine their work opportunities at the age that they will be acquiring skills and experience.
Conclusion
My standard monthly warning: we always have to be careful interpreting month to month movements given the way the Labour Force Survey is constructed and implemented.
My overall assessment is:
1. The signs of a slowdown were appearing in late 2023 and the January figures probably confirm that trend, although the changing holiday behaviour makes it difficult to be definitive.
We will know more next month when the holiday period effects wash out.
2. Employment growth was unable to even keep pace with the underlying population growth, which is why unemployment rose with participation constant.
3. The best indicators that the labour market is weakening are the fall in the employment-to-population rate since November 2023 (down 0.5 points) and the sharp decline over the last few months in hours worked.
3. It also appears that the slowdown is impacting teenagers disproportionately.
4. There are now 10.7 per cent of the available and willing working age population who are being wasted in one way or another – either unemployed or underemployed and that proportion is increasing.
5. Australia is not near full employment despite the claims by the mainstream commentators and it is hard to characterise this as a ‘tight’ labour market.
That is enough for today!
(c) Copyright 2024 William Mitchell. All Rights Reserved.
This Post Has 0 Comments