The recent extreme weather in the northern hemisphere, the twin monster tropical storms in Japan,…
Australian labour market defying RBA rate hikes still although special factors were present in October
Today (November 16, 2023), the Australian Bureau of Statistics released the latest – Labour Force, Australia – for October 2023. Employment rose by 55 thousand and unemployment rose by 27,900 on the back of a 0.2 points rise in participation – usually a sign of a healthy situation. But the special monthly factors (referendum and elections) which impacted positively on employment growth make it hard to assess where the labour market is at. I am guessing that November’s employment growth will be much lower and participation will fall again. In October, noting the special factors, employment growth was not strong enough in September to absorb the rise in the labour force as participation rose by 0.2 points. If the participation rate had not have changed, then the official unemployment rate would be 3.4 per cent rather than the official rate published of 3.7 per cent. There are now 10 per cent of the available and willing working age population who are being wasted in one way or another – either unemployed or underemployed. Australia is not near full employment despite the claims by the mainstream commentators.
The summary ABS Labour Force (seasonally adjusted) estimates for October 2023 are:
- Employment rose 55,000 (0.4 per cent) – full-time employment increased by 17,000 and part-time employment increased by 37.9 thousand. Part-time share of total was 30.5 per cent.
- Unemployment rose 27,900 to 547,800 persons.
- The official unemployment rate rose 0.2 points to 3.7 per cent.
- The participation rate rose 0.2 points to 67 per cent.
- The employment-population ratio rose 0.1 point to 64.5 per cent.
- Aggregate monthly hours rose 8.9 million hours (0.46 per cent) after two months of decline.
- Underemployment rate was constant at 6.4 per cent (+1.7 thousand). Overall there are 931 thousand underemployed workers. The total labour underutilisation rate (unemployment plus underemployment) rise 0.1 point to10 per cent. There were a total of 1,478.8 thousand workers either unemployed or underemployed.
In the ABS Media Release – Unemployment rate back up to 3.7% in October – the ABS noted that:
The unemployment rate increased by 0.2 percentage points to 3.7 per cent in October (seasonally adjusted) …
With employment increasing by 55,000 people, and the number of unemployed people increasing by 28,000, the unemployment rate rose to 3.7 per cent in October. This was back to around where it had been in July and August …
Looking over the past two months, these increases equate to average employment growth of around 31,000 people a month, which is slightly lower than the average growth of 35,000 people a month since October 2022 …
The participation rate fell 0.2 percentage points to 66.7 per cent …
The employment-to-population ratio increased by 0.1 percentage point to 64.5 per cent. The participation rate also increased by 0.2 percentage points to 67.0 per cent.
Conclusion: There has been some sampling volatility over the last two months and the October result (strong employment growth and rising participation) are due to the “the temporary effect of referendums and elections”, which resulted in a rise in temporary employment.
However, as the ABS notes, that will not impact on aggregate employment growth “if a person works in a temporary job as a secondary job”.
But overall, employment growth was strong but not strong enough to absorb the growth in the labour force as the participation rate rose.
I suspect that November’s employment growth will be much lower given the special factors noted above will not be present.
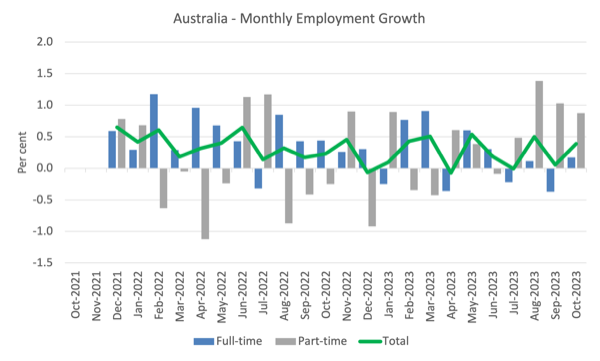
Employment rose 55,000 (0.4 per cent) in October 2023
1. Full-time employment increased by 17,000 (0.2 per cent) and part-time employment increased by 37,900 thousand (0.9 per cent).
2. The employment-population ratio rose 0.1 point to 64.5 per cent.
The following graph shows the month by month growth in full-time (blue columns), part-time (grey columns) and total employment (green line) for the 24 months to October 2023 using seasonally adjusted data.
I took out the observations from September to January 2021 – they were outliers due to the Covid wave at that time.
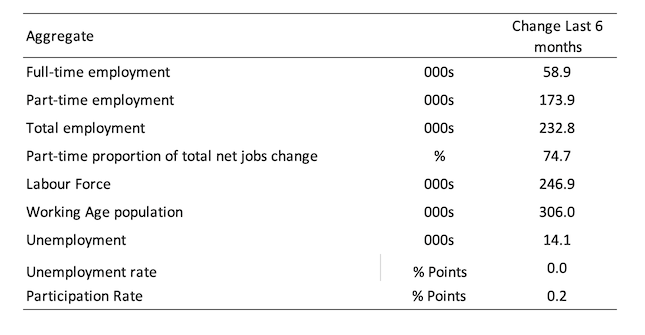
The following table provides an accounting summary of the labour market performance over the last six months to provide a longer perspective that cuts through the monthly variability and provides a better assessment of the trends.
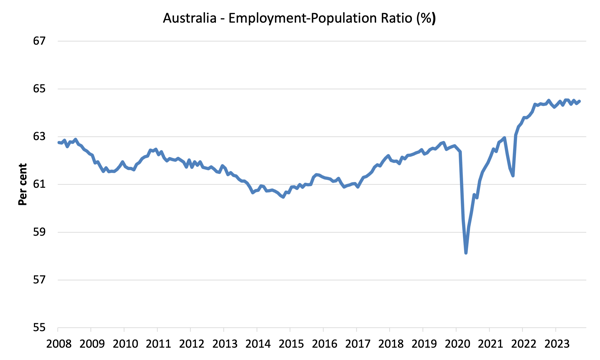
Given the variation in the labour force estimates, it is sometimes useful to examine the Employment-to-Population ratio (%) because the underlying population estimates (denominator) are less cyclical and subject to variation than the labour force estimates. This is an alternative measure of the robustness of activity to the unemployment rate, which is sensitive to those labour force swings.
The following graph shows the Employment-to-Population ratio, since January 2008 (that is, since the GFC).
The ratio rose 0.1 point to 64.5 per cent in October 2023.
Despite the attempts by the RBA to kill off employment growth, the graph shows that the relationship between employment and the working age population has been very stable over the rate hike period and this has been a time where population growth has accelerated.
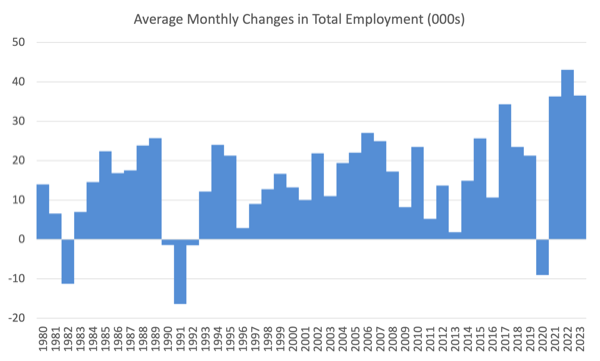
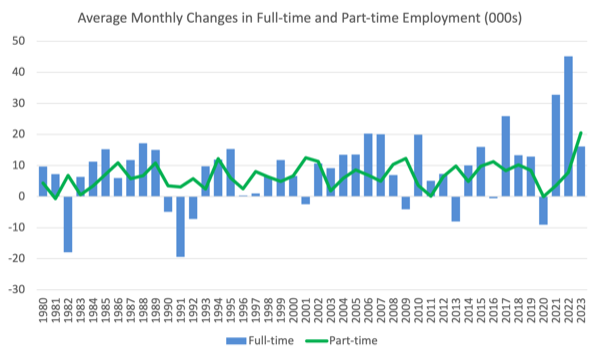
For perspective, the following graph shows the average monthly employment change for the calendar years from 1980 to 2023 (to date).
1. The average employment change over 2020 was -9 thousand which rose to 36.3 thousand in 2021 as the lockdowns eased.
2. For 2022, the average monthly change was 43 thousand.
3. So far, in 2023, the average change is 36.5 thousand.
The following graph shows the average monthly changes in Full-time and Part-time employment (lower panel) in thousands since 1980.
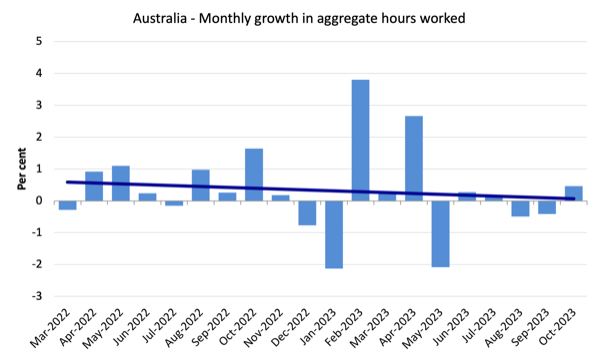
Aggregate monthly hours rose 8.9 million hours (0.46 per cent) in October 2023
This reverses two consecutive months of decline.
The following graph shows the monthly growth (in per cent) over the last 24 months (with the pandemic restriction period omitted).
The dark linear line is a simple regression trend of the monthly change.
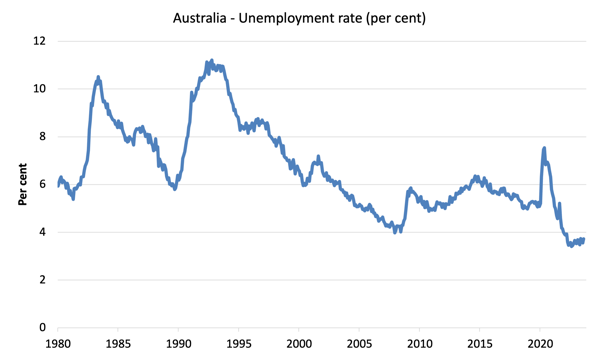
Unemployment rose 27,900 to 547,800 persons in October 2023
Unemployment rose this month despite the strong employment growth because participation rose – which means the labour force rose by more than the employment (see below for analysis).
The following graph shows the national unemployment rate from January 1980 to October 2023. The longer time-series helps frame some perspective to what is happening at present.
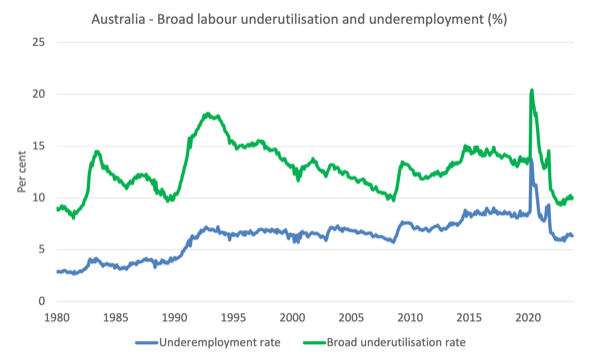
Broad labour underutilisation rose 0.1 point to 10 per cent in October 2023
1. Underemployment rate was constant at 6.4 per cent (+1.7 thousand).
2. Overall there are 931 thousand underemployed workers.
3. The total labour underutilisation rate (unemployment plus underemployment) rise 0.1 point to10 per cent.
4. There were a total of 1,478.8 thousand workers either unemployed or underemployed.
It means that 10 per cent of available and willing workers are without work in one way or another (unemployed or underemployed), which makes a mockery of claims by economic commentators and policy officials that Australia is near full employment.
The following graph plots the seasonally-adjusted underemployment rate in Australia from April 1980 to the October 2023 (blue line) and the broad underutilisation rate over the same period (green line).
The difference between the two lines is the unemployment rate.
Aggregate participation rate rose 0.2 points to 67 per cent in October 2023
The risein unemployment was the result of the rise in the labour force (82.9 thousand) outstripping the rise in employment (55 thousand) as the participation rate rose to 67 per cent.
The labour force is a subset of the working-age population (those above 15 years old). The proportion of the working-age population that constitutes the labour force is called the labour force participation rate. Thus changes in the labour force can impact on the official unemployment rate, and, as a result, movements in the latter need to be interpreted carefully. A rising unemployment rate may not indicate a recessing economy.
The labour force can expand as a result of general population growth and/or increases in the labour force participation rates (and vice versa).
The following Table shows the breakdown in the changes to the main aggregates (Labour Force, Employment and Unemployment) and the impact of the fall in the participation rate.
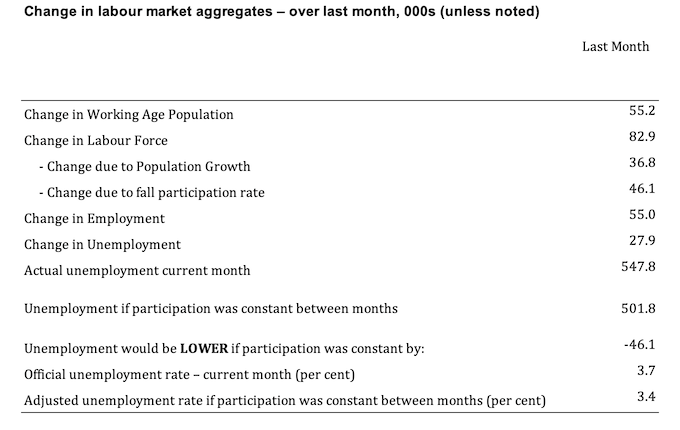
The change in the labour force in October 2023 was the outcome of two separate factors:
- The underlying population growth added 36.8 thousand persons to the labour force. The population growth impact on the labour force aggregate is relatively steady from month to month; and
- The rise in the participation rate meant that there were 46.1 thousand workers entering the labour force (relative to what would have occurred had the participation rate remained unchanged).
- The net result was that the labour force rose by 82.9 thousand.
Assessment:
1. If the participation rate had not have risen in October 2023, total unemployment, given the current employment level, would have been 501.8 thousand rather than the official count of 547.8 thousand as recorded by the ABS – a difference of 46.1 thousand workers (the ‘participation effect’).
2. Without the rise in the participation rate, the official unemployment rate would have been 3.4 per cent (rounded) rather than its current official value of 3.7 per cent).
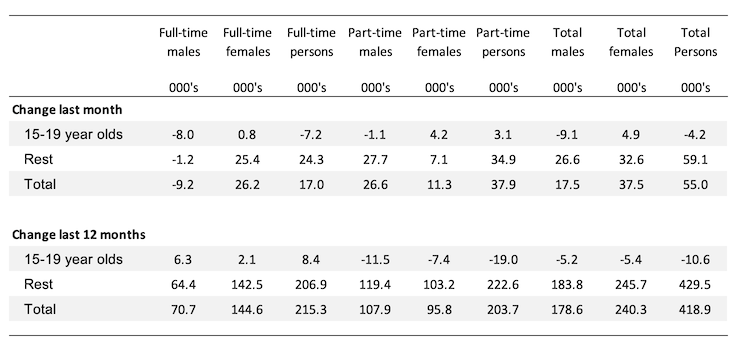
Teenage labour market deteriorated in October 2023
Overall teenage employment fell in September with full-time employment falling by 7.2 thousand and part-time employment rising by 3.1 thousand.
The following Table shows the distribution of net employment creation in the last month and the last 12 months by full-time/part-time status and age/gender category (15-19 year olds and the rest).
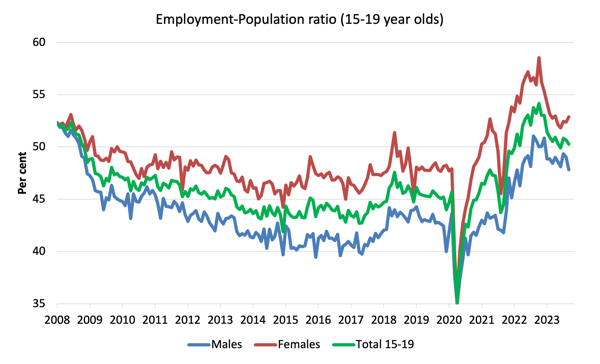
To put the teenage employment situation in a scale context (relative to their size in the population) the following graph shows the Employment-Population ratios for males, females and total 15-19 year olds since July 2008.
You can interpret this graph as depicting the change in employment relative to the underlying population of each cohort.
In terms of the recent dynamics:
1. The male ratio fell 1.2 points over the month.
2. The female ratio rose 0.5 points over the month.
3. The overall teenage employment-population ratio fell 0.4 points over the month.
Conclusion
My standard monthly warning: we always have to be careful interpreting month to month movements given the way the Labour Force Survey is constructed and implemented.
My overall assessment is:
1. The special monthly factors (referendum and elections) which impacted positively on employment growth make it hard to assess where the labour market is at.
2. I am guessing that November’s employment growth will be much lower and participation will fall again.
3. In October, noting the special factors, employment growth was not strong enough in September to absorb the rise in the labour force as participation rose by 0.2 points.
4. If the participation rate had not have changed, then the official unemployment rate would be 3.4 per cent rather than the official rate published of 3.7 per cent.
5. There are now 10 per cent of the available and willing working age population who are being wasted in one way or another – either unemployed or underemployed.
6. Australia is not near full employment despite the claims by the mainstream commentators.
That is enough for today!
(c) Copyright 2023 William Mitchell. All Rights Reserved.
This Post Has 0 Comments