The recent extreme weather in the northern hemisphere, the twin monster tropical storms in Japan,…
Australian labour market – labour demand tracks labour supply – steady
I am late today because I am writing this in London after travelling the last 24 hours. The Australian Bureau of Statistics (ABS) released the latest labour force data today (February 19, 2026) – Labour Force, Australia – for January 2026 – which showed that the labour market was essentially steady in that employment kept pace with supply, and the participation rate was stable. There was some shuffling within total employment to full-time jobs, with a rather large fall in part-time work. Notwithstanding that fact, underemployment still rose. It remains a fact that with 10 per cent of available labour not being used it is ludicrous to talk about Australia being close to full employment. There is substantial scope for more job creation given the slack that is present.
The summary seasonally-adjusted statistics for January 2026 are:
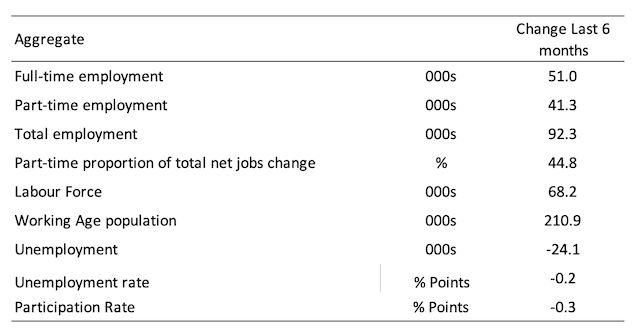
- Employment rose 17,800 (0.1 per cent).
- Full-time employment rose 50,500 thousand (0.5 per cent).
- Part-time employment fell 32,700 thousand (-0.7 per cent).
- Unemployment fell 1,900 (0 per cent) to 624,700.
- The unemployment rate remained at 4.1 per cent.
- The participation rate remained at 66.7 per cent.
- The Employment-population ratio fell 0.1 point to 63.9 per cent.
- Monthly hours worked rose 11 million (0.56 per cent).
- Underemployment rose 0.2 points to 5.9 per cent (rising by 28.6 thousand to 903.6 thousand).
- The Broad Labour Underutilisation rate (the sum of unemployment and underemployment) rose 0.2 points to 9.97 per cent.
- Overall, there are 1,528.38 thousand people either unemployed or underemployed.
The ABS press release – Unemployment rate remains at 4.1% – noted that:
The seasonally adjusted unemployment rate remained at 4.1 per cent in January …
Employed people grew by 18,000. Full-time employment rose by 50,000 people, partly offset by a fall of 33,000 people in part-time employment …
The participation rate of 66.7 per cent was 0.6 percentage points lower than the record high measured in January 2025 …
The underemployment rate rose 0.2 percentage points to 5.9 per cent in January. The underutilisation rate also grew by 0.2 percentage points to 10.0 per cent.
Summary
1. Fairly static month after the madness of the Xmas season.
2. Total labour underutilisation (sum of unemployment and underemployment) rose to 10 per cent, which indicates the extent of the wastage.
Employment growth maintains pace with underlying population growth
Employment rose 17.8 thousand while the labour force rose 15.9 thousand, which meant that unemployment fell marginally.
- Employment rose 17,800 (0.1 per cent).
- Full-time employment rose 50,500 thousand (0.5 per cent).
- Part-time employment fell 32,700 thousand (-0.7 per cent).
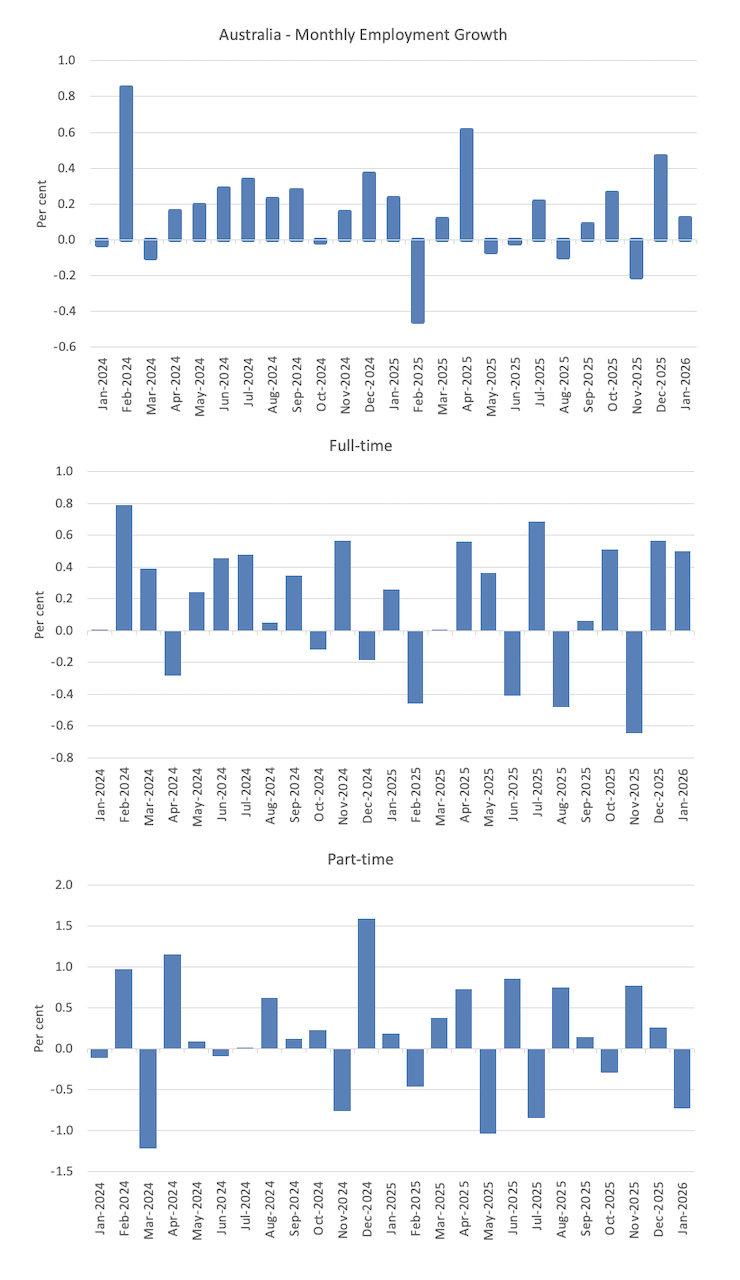
The following graph shows the growth in total, full-time, and part-time employment for the last 24 months.
The following table shows the shifts over the last 6 months which helps to see the underlying trend.
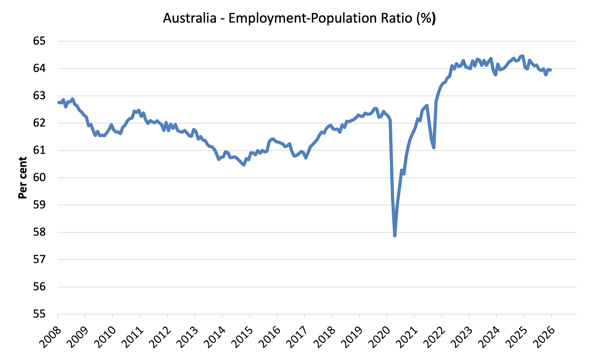
The Employment-to-Population ratio provides a measure of the state of the labour market that is independent of the supply shifts in the labour market (driven by the shifts in the participation rate).
The underlying working age population grows steadily while the labour force shifts with both underlying population growth and the participation swings.
The following graph shows the Employment-Population ratio fell 0.1 point to 63.9 per cent, the lowest it has been since January 2024.
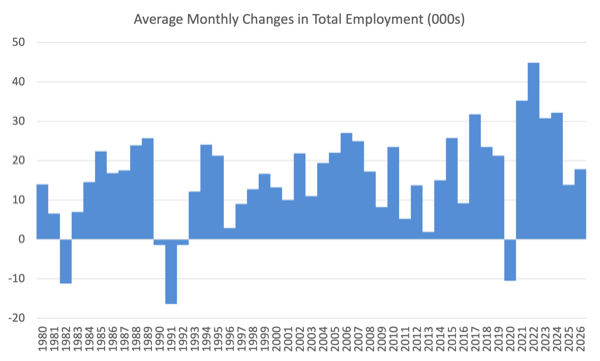
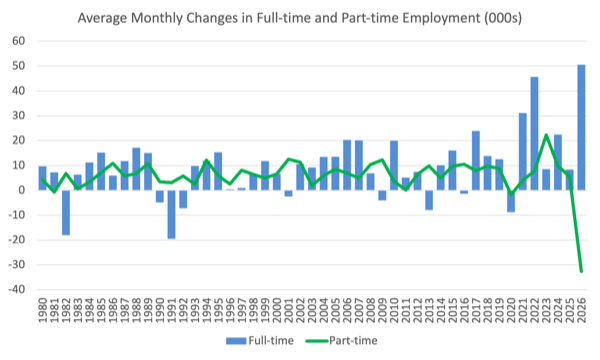
The next graphs show the average monthly change in total employment (first graph) and full- and part-time employment (second graph).
Obviously, the one-month result for 2026 doesn’t tell us much yet.
For total employment the monthly average changes were:
- 2022 – 44.8 thousand
- 2023 – 30.8 thousand
- 2024 – 32.2 thousand
- 2025 – 13.8 thousand
- 2026 to date – 17.8 thousand
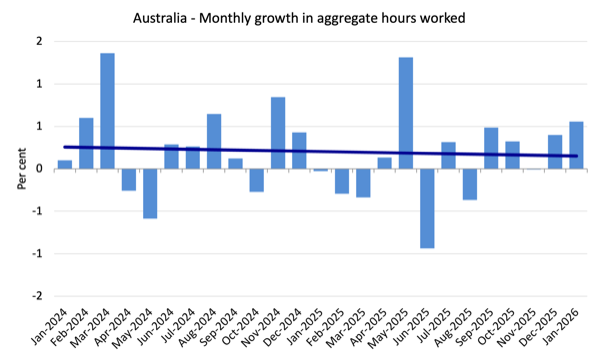
Monthly hours worked rose 11 million (0.56 per cent) in January 2026
Stronger on the back of growth in full-time employment.
The following graph shows the growth in monthly hours worked for the last 24 months, with the straight line being a simple linear regression to indicate trend.
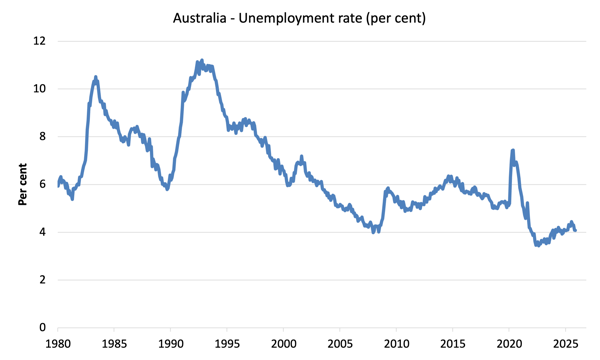
Unemployment fell 1,900 to 624,700 in January
The unemployment rate was steady at 4.1 per cent.
Essentially, labour demand kept pace with the growth in supply.
The following graph shows the evolution of the official unemployment rate since 1980.
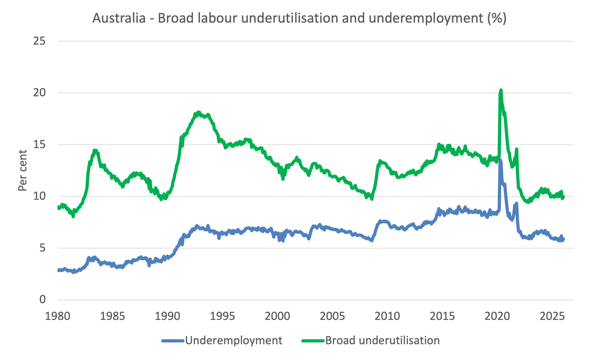
Broad labour underutilisation – rose 0.2 points in January
- Underemployment rose 0.2 points to 5.9 per cent (rising by 28.6 thousand to 903.6 thousand).
- The Broad Labour Underutilisation rate (the sum of unemployment and underemployment) rose 0.2 points to 9.97 per cent.
- Overall, there are 1,528.38 thousand people either unemployed or underemployed.
The following graph shows the evolution of underemployment and the Broad labour underutilisation rate since 1980.
Teenage labour market – bucks overall trend January 2025
In December, the teenage labour market went backwards despite the relatively strong overall result.
This month, teenagers saw part-time employment grow significantly as the overall part-time employment fell.
- Full-time employment rose 3.9 thousand (2.0 per cent).
- Part-time employment rose 28.3 thousand (1.7 per cent).
- Total teenage (15-19) employment rose 15.3 thousand (1.8 per cent).
The following table summarises the shifts in the teenage labour market for the month and over the last 12 months.
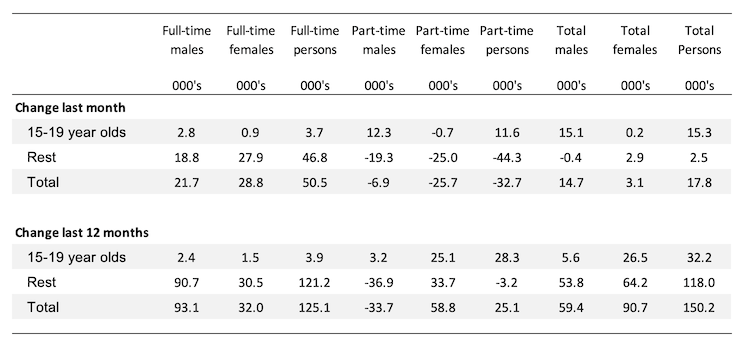
To put these changes into a scale perspective (that is, relative to size of the teenage labour force) the following data reports the shifts in the Employment-Population ratio for teenagers.
The Teenage Employment-Population ratios and their monthly changes in January 2025 were:
- Males: 47.8 per cent – up 1.6 points.
- Females: 53.3 per cent – down 0.1 point.
- Total: 50.5 per cent – up 0.8 points.
Conclusion
My standard warning to take care in interpreting monthly labour force changes – they can fluctuate for a number of reasons and it is imprudent to jump to conclusions on the back of a single month’s data.
- The January result was steady in that employment kept pace with supply, and the participation rate was stable.
- There was some shuffling within total employment to full-time jobs, with a rather large fall in part-time work.
- Notwithstanding that fact, underemployment still rose.
- It remains a fact that with 10 per cent of available labour not being used it is ludicrous to talk about Australia being close to full employment. There is substantial scope for more job creation given the slack that is present.
That is enough for today!
(c) Copyright 2026 William Mitchell. All Rights Reserved.
Bill
please put an end to my curiosity
“3.9 thousand”?
The format?
Dear Graeme D (at 2026/02/20 at 15:04)
I am not sure what the issue is?
3.9 thousand is 3,900.
best wishes
bill
Bill
thanks
call me a right proper drongo
The format confused me