The recent extreme weather in the northern hemisphere, the twin monster tropical storms in Japan,…
Australian labour market – stronger as employment growth outstrips the growth in the working age population
Today (January 22, 2026), the Australian Bureau of Statistics (ABS) released the latest labour force data – Labour Force, Australia – for December 2025 – which showed a relatively strong increase in employment and the rising participation rate – both good signs. Taken together the demand-side of the labour market outstripped the growth in the working age population and, as a result, unemployment fell. The increase in employment was concentrated on full-time employment, which meant that working hours rose and underemployment fell significantly. However, the reality is that it is nonsensical to argue that Australia is close to full employment.
The summary seasonally-adjusted statistics for December 2025 are:
- Employment rose 65,200 (0.4 per cent).
- Full-time employment rose 54.8 thousand (0.5 per cent).
- Part-time employment rose 10.4 thousand (0.2 per cent).
- Unemployment fell 29,800 (-4.5 per cent) to 628,600.
- The unemployment rate fell 0.2 points to 4.1 per cent.
- The participation rate rose 0.1 point to 66.7 per cent.
- The Employment-population ratio rose 0.2 points to 64 per cent.
- Monthly hours worked rose 7.6 million (0.38 per cent).
- Underemployment fell 0.5 points to 5.7 per cent (falling by 68.7 thousand to 873.2 thousand).
- The Broad Labour Underutilisation rate (the sum of unemployment and underemployment) fell 0.7 points to 9.8 per cent.
- Overall, there are 1,501.8 thousand people either unemployed or underemployed.
The ABS press release – Unemployment rate falls to 4.1% – noted that:
The seasonally adjusted unemployment rate fell to 4.1 per cent in December …
Employed people were up 65,000 in December, with both full-time (55,000 people) and part-time (10,000 people) employment contributing to this rise …
This month we saw more 15-24 year olds moving into employment, contributing to the rise in overall employment and the fall in the unemployment rate …
The growth in employment was driven by male employment, which rose by 49,000 people, while female employment recorded a smaller increase of 17,000 people ….
In December 2025, seasonally adjusted monthly hours worked reached a record high of over 2 billion hours for the first time.’
Underemployment and underutilisation both fall in DecemberThe underemployment rate fell 0.5 percentage points to 5.7 per cent in December …
The underutilisation rate, which typically exhibits greater month‑to‑month changes than other labour force indicators, fell to 9.8 per cent in December, down 0.7 percentage points. …
Summary
1. A strong result for the final month of 2025 –
2. Both full-time and part-time employment rising, with strong hours growth and a higher proportion of the working age population coming into the active labour force.
3. Total labour underutilisation (sum of unemployment and underemployment) dropped significantly.
Employment growth ends year on a high note
Strong employment growth accompanied by rising participation is a good outcome.
- Employment rose 65,200 (0.4 per cent).
- Full-time employment rose 54.8 thousand (0.5 per cent).
- Part-time employment rose 10.4 thousand (0.2 per cent).
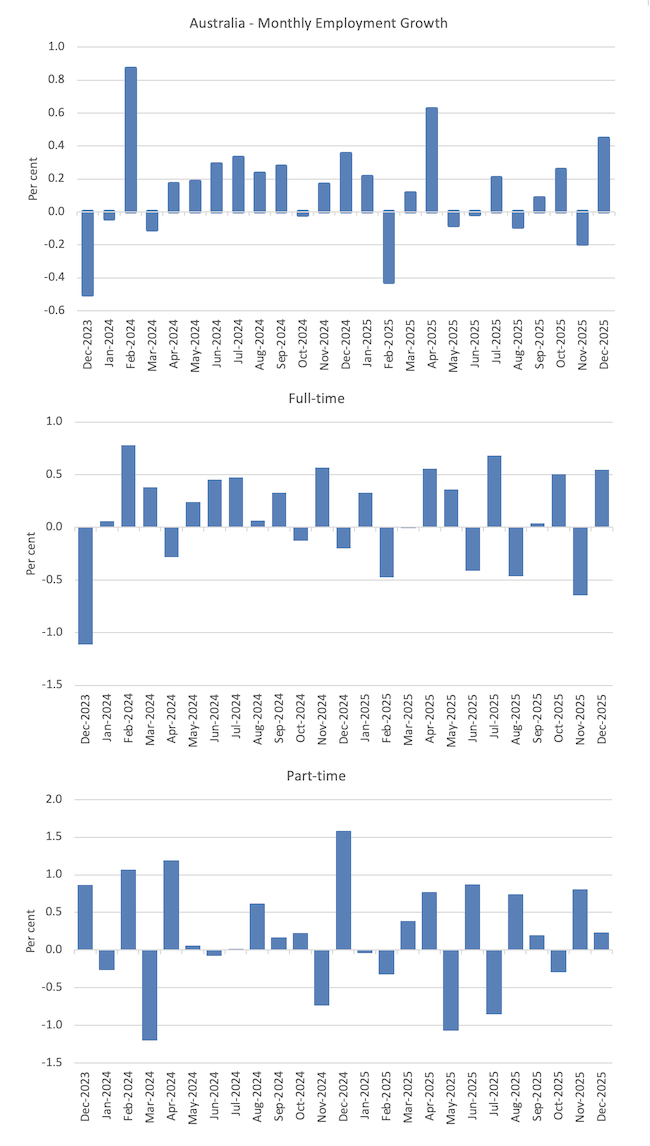
The following graph shows the growth in total, full-time, and part-time employment for the last 24 months.
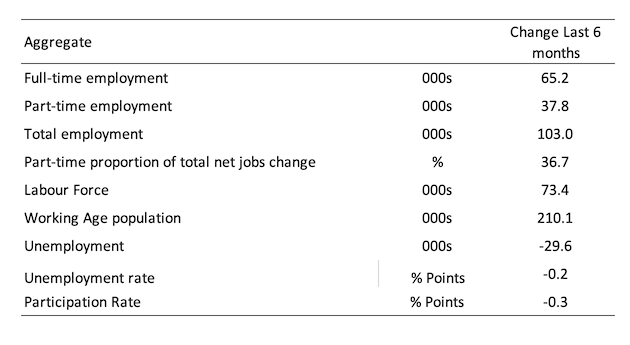
The following table shows the shifts over the last 6 months which helps to see the underlying trend.
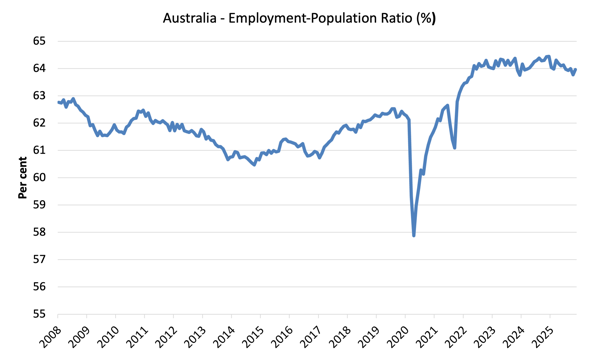
The Employment-to-Population ratio provides a measure of the state of the labour market that is independent of the supply shifts in the labour market (driven by the shifts in the participation rate).
The underlying working age population grows steadily while the labour force shifts with both underlying population growth and the participation swings.
The following graph shows the Employment-Population ratio fell 0.2 points to 63.8 per cent, the lowest it has been since January 2024.
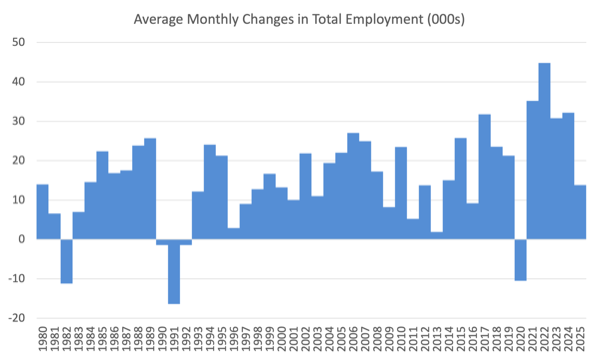
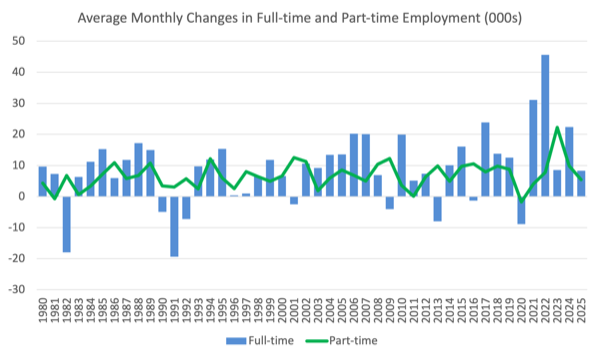
The next graphs show the average monthly change in total employment (first graph) and full- and part-time employment (second graph).
For total employment the monthly average changes were:
- 2022 – 44.6 thousand
- 2023 – 30.8 thousand
- 2024 – 32.2 thousand
- 2025 – 13.8 thousand
The December 2026 result finishes a very poor year on a high note.
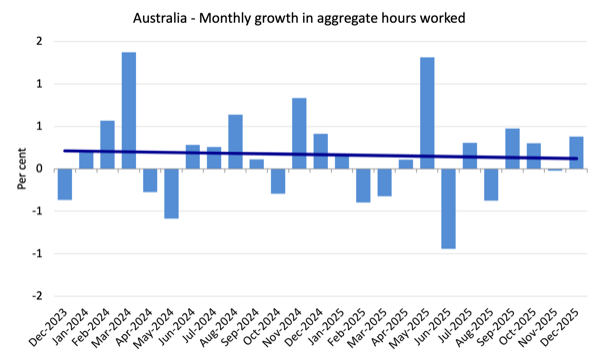
Monthly hours worked rose 7.6 million (0.38 per cent) in December 2025
The following graph shows the growth in monthly hours worked for the last 24 months, with the straight line being a simple linear regression to indicate trend.
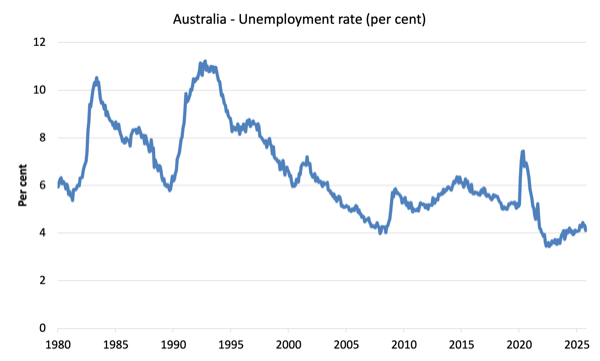
Unemployment fell 29,800 to 628,600 in December
The unemployment rate fell 0.2 points to 4.1 per cent.
It would have fallen by more if the participation rate had not risen.
But stronger employment growth (particularly full-time) and rising participation signals are strengthening labour market.
The following graph shows the evolution of the official unemployment rate since 1980.
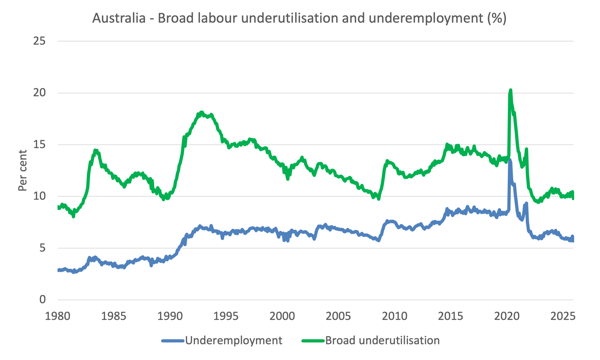
Broad labour underutilisation – fell 0.5 points in December
A strong result driven by the significant increase in full-time employment and working hours.
- Underemployment fell 0.5 points to 5.7 per cent (falling by 68.7 thousand to 873.2 thousand).
- The Broad Labour Underutilisation rate (the sum of unemployment and underemployment) fell 0.7 points to 9.8 per cent.
- Overall, there are 1,501.8 thousand people either unemployed or underemployed.
The following graph shows the evolution of underemployment and the Broad labour underutilisation rate since 1980.
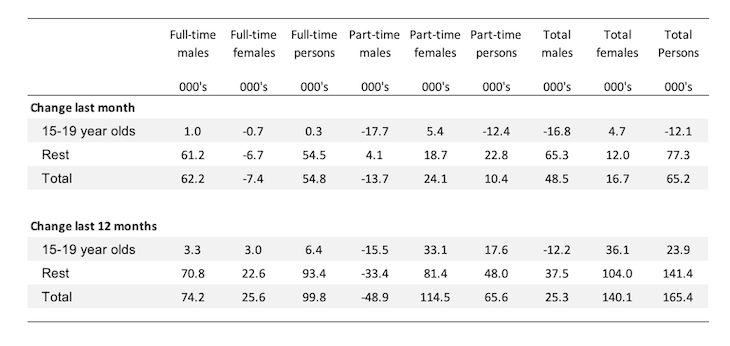
Teenage labour market – further deterioration in December 2025
Despite the relatively strong overall result, the teenage labour market went backwards.
- Full-time employment rose 0.3 thousand (0.2 per cent).
- Part-time employment fell 12.4 thousand (-1.8 per cent).
- Total teenage (15-19) employment fell 12.1 thousand (-1.4 per cent).
The following table summarises the shifts in the teenage labour market for the month and over the last 12 months.
To put these changes into a scale perspective (that is, relative to size of the teenage labour force) the following data reports the shifts in the Employment-Population ratio for teenagers.
The Teenage Employment-Population ratios and their monthly changes in December 2025 were:
- Males: 46.2 per cent – down 1.9 points.
- Females: 53.5 per cent – up 0.5 points.
- Total: 49.7 per cent – down 0.7 points.
Conclusion
My standard warning to take care in interpreting monthly labour force changes – they can fluctuate for a number of reasons and it is imprudent to jump to conclusions on the back of a single month’s data.
- The December result ended the year on a bright note after a fairly mediocre year overall.
- All the indicators strengthened – stronger employment growth (concentrated on full-time employment), rising participation, and falling unemployment and underemployment.
- It remains a fact that with 9.8 per cent of available labour not being used it is ludicrous to talk about Australia being close to full employment. There is substantial scope for more job creation given the slack that is present.
That is enough for today!
(c) Copyright 2026 William Mitchell. All Rights Reserved.
This Post Has 0 Comments