Economics and business correspondents regularly serve as apologists for poor policy. Their motivation is to…
Slight rise in Australian inflation rate driven by factors that do not justify further rate hikes
Today (October 25, 2023), the Australian Bureau of Statistics released the latest – Consumer Price Index, Australia – for the September-quarter 2023. The data showed a slight uptick in the quarterly rate of inflation with the CPI rising by 1.2 per cent (up 0.4 points), largely due to petrol price rises and rental increases. The latter is, in part, driven by the previous RBA interest rate hikes – so monetary policy causing inflation rather than reducing it. The annual inflation rate, however, was significantly lower again in the September-quarter as the supply-side drivers abate – down to 5.4 per cent from 6.1 per cent in the June-quarter. While the RBA has been threatening further rate hikes if the new data showed an increase in the inflation rate, there is nothing in this quarterly release that would justify that. The fuel prices are not sensitive to domestic monetary policy and further rate hikes will make the rental situation worse.
The summary, seasonally-adjusted Consumer Price Index results for the September-quarter 2023 are as follows:
- The All Groups CPI rose by 1.2 per cent for the quarter – 0.4 points up from the last quarter.
- The All Groups CPI rose by 5.4 per cent over the 12 months (a decline from 6.1 per cent in the June-quarter 2022).
- The most significant price rises were Automotive fuel (+7.2 per cent), Rents (+2.2 per cent), New dwelling purchase by owner-occupiers (+1.3 cent) and Electricity (+4.2 per cent).
- The Trimmed mean series rose by 1.2 per cent for the quarter (up 0.3 points) and 5.2 per cent over the previous year (down from 5.9 per cent).
- The Weighted median series rose by 1.3 per cent (up 0.3 points) for the quarter and 5.2 per cent over the previous year (down from 5.9 per cent).
The ABS Media Release notes that:
CPI rose 1.2 per cent in the September quarter, higher than the 0.8 per cent rise in the June 2023 quarter. The rise this quarter however continued to be lower than those seen throughout 2022.
Short assessment:
1. The inflation rate continues to fall as the supply factors that drove its rise abate.
2. Petrol price rises are due to OPEC behaviour and have nothing to do with the underlying conditions within the Australian economy – such as labour costs.
3. Note that a significant factor now is the rising rent costs, which are driven, in part, by the RBA rate hikes – so interest rate hikes are themselves inflationary even though the Bank denies that.
4. Electricity price rises are largely due to the profit gouging from the privatised electricity providers and a tighter regulated price would eliminate that behaviour.
Trends in inflation
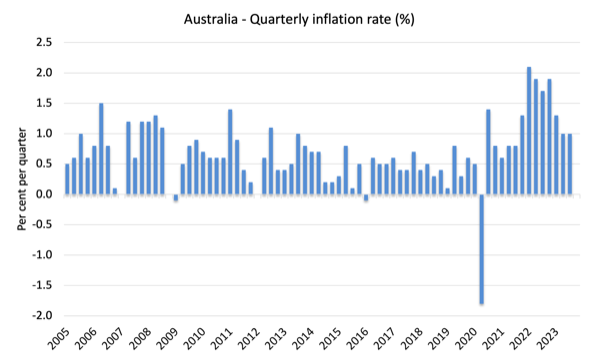
The headline inflation rate increased by 1.2 per cent in the September-quarter 2023 a 0.4 points rise over the quarter.
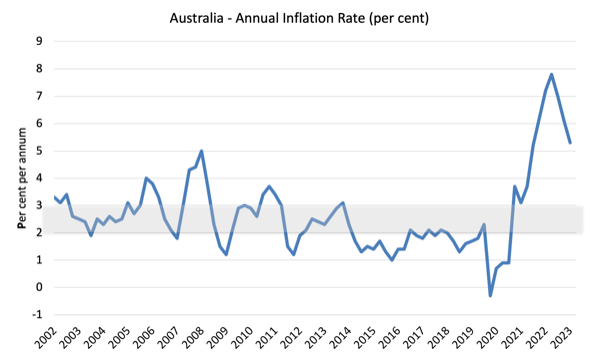
Over the 12 months to December the inflation rate was 5.4 per cent (down 0.7 points).
The peak was in the December-quarter 2022 when the inflation rate high 7.8 per cent.
The following graph shows the quarterly inflation rate since the December-quarter 2005.
The next graph shows the annual headline inflation rate since the first-quarter 2002. The shaded area is the RBA’s so-called targetting range (but read below for an interpretation).
What is driving inflation in Australia?
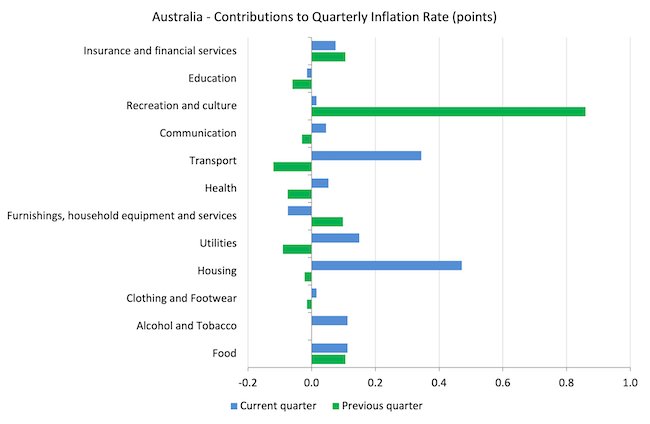
The following bar chart compares the contributions to the quarterly change in the CPI for the September-quarter 2023 (blue bars) compared to the March-quarter 2023 (green bars).
Note that Utilities is a sub-group of Housing and are significantly impacted by government administrative decisions, which allow the privatised companies to push up prices each year, usually well in excess of CPI movements.
The surge in travel following the relaxation of Covid restrictions appears to have ended with the dramatic fall in the contribution from Recreation and culture.
The inflation story in Australia at present is fuel and housing.
The latter is due in no small part to the rent rises driven by the rising interest rates.
The other driver is the supply shortage where the years of neglect by governments in supplying adequate housing for low-income families is now coming home to roost.
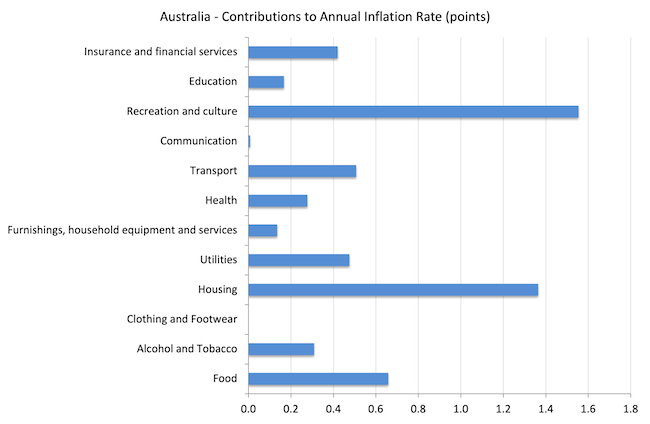
The next graph shows the contributions in points to the annual inflation rate by the various components.
The Recreation and culture components reflects the boom in international travel following the Covid restrictions easing and the quarterly results (graph above) shows that is now normalising.
Inflation and Expected Inflation
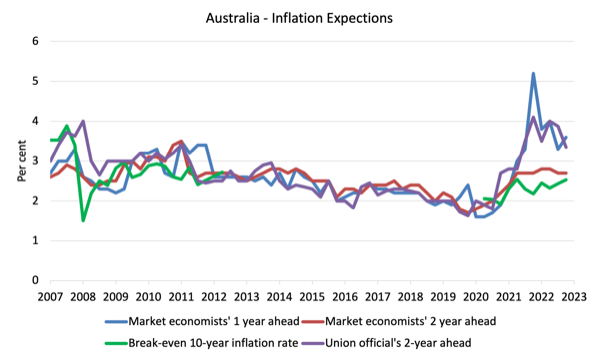
The following graph shows four measures of expected inflation produced by the RBA – Inflation Expectations – G3 – from the December-quarter 2005 to the September-quarter 2023.
The four measures are:
1. Market economists’ inflation expectations – 1-year ahead.
2. Market economists’ inflation expectations – 2-year ahead – so what they think inflation will be in 2 years time.
3. Break-even 10-year inflation rate – The average annual inflation rate implied by the difference between 10-year nominal bond yield and 10-year inflation indexed bond yield. This is a measure of the market sentiment to inflation risk. This is considered the most reliable indicator.
4. Union officials’ inflation expectations – 2-year ahead.
Notwithstanding the systematic errors in the forecasts, the price expectations (as measured by these series) are now falling or relatively stable.
In the case of the Market economists’ inflation expectations – 2-year ahead and the Break-even 10-year inflation rate, the expectations remain well within the RBA’s inflation targetting range (2-3 per cent) and show no signs of accelerating.
So all the talk now is that inflation is not falling fast enough – and that claim is accompanied by claims that the longer it remains above the inflation targetting range, the more likely it is that a wage-price spiral and/or accelerating (unanchored) expectations will drive the rate up for longer.
Neither claim can be remotely justified given the data.
Implications for monetary policy
What does this all mean for monetary policy?
The Consumer Price Index (CPI) is designed to reflect a broad basket of goods and services (the ‘regimen’) which are representative of the cost of living. You can learn more about the CPI regimen HERE.
The RBA’s formal inflation targeting rule aims to keep annual inflation rate (measured by the consumer price index) between 2 and 3 per cent over the medium term.
However, the RBA uses a range of measures to ascertain whether they believe there are persistent inflation threats.
Please read my blog post – Australian inflation trending down – lower oil prices and subdued economy – for a detailed discussion about the use of the headline rate of inflation and other analytical inflation measures.
The RBA does not rely on the ‘headline’ inflation rate. Instead, they use two measures of underlying inflation which attempt to net out the most volatile price movements.
The concept of underlying inflation is an attempt to separate the trend (“the persistent component of inflation) from the short-term fluctuations in prices. The main source of short-term ‘noise’ comes from “fluctuations in commodity markets and agricultural conditions, policy changes, or seasonal or infrequent price resetting”.
The RBA uses several different measures of underlying inflation which are generally categorised as ‘exclusion-based measures’ and ‘trimmed-mean measures’.
So, you can exclude “a particular set of volatile items – namely fruit, vegetables and automotive fuel” to get a better picture of the “persistent inflation pressures in the economy”. The main weaknesses with this method is that there can be “large temporary movements in components of the CPI that are not excluded” and volatile components can still be trending up (as in energy prices) or down.
The alternative trimmed-mean measures are popular among central bankers.
The authors say:
The trimmed-mean rate of inflation is defined as the average rate of inflation after “trimming” away a certain percentage of the distribution of price changes at both ends of that distribution. These measures are calculated by ordering the seasonally adjusted price changes for all CPI components in any period from lowest to highest, trimming away those that lie at the two outer edges of the distribution of price changes for that period, and then calculating an average inflation rate from the remaining set of price changes.
So you get some measure of central tendency not by exclusion but by giving lower weighting to volatile elements. Two trimmed measures are used by the RBA: (a) “the 15 per cent trimmed mean (which trims away the 15 per cent of items with both the smallest and largest price changes)”; and (b) “the weighted median (which is the price change at the 50th percentile by weight of the distribution of price changes)”.
So what has been happening with these different measures?
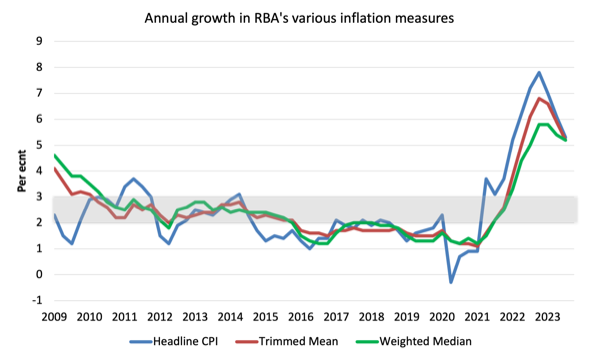
The following graph shows the three main inflation series published by the ABS since the December-quarter 2009 – the annual percentage change in the All items CPI (blue line); the annual changes in the weighted median (green line) and the trimmed mean (red line).
The RBAs inflation targetting band is 2 to 3 per cent (shaded area). The data is seasonally-adjusted.
The three measures are in annual terms:
1. CPI measure of inflation rose by 5.2 per cent (down from 6.1 per cent last quarter). For the quarter it rose by 1.2 points (up from 0.8)
2. The Trimmed Mean rose 5.2 per cent (down from 5.9 per cent last quarter). For the quarter it rose 1.2 points (up from 1.0).
3. The Weighted Median rose 5.2 per cent (down from 5.5 per cent last quarter). For the quarter it rose by 1.3 points (up from 1.0 point).
How to we assess these results?
1. The RBA’s preferred measures are now outside the targetting range and they have been using that fact to justify their rate hikes since May 2022 even though the factors that have been driving the inflation until late 2022 were not sensitive to the interest rate increases.
2. They also claimed the NAIRU was 4.5 per cent and with unemployment stable at around 3.5 per cent, they considered that justified further rate rises. However, if inflation is falling consistently with a stable unemployment rate then the NAIRU must be below the current rate of 3.5 per cent.
3. There is no evidence that inflationary expectations are accelerating – quite the opposite and that has been the case for some months now.
4. There is no significant wages pressure.
5. The other major contributors to the current situation are also not sensitive to interest rate rises.
6. Rent inflation is being caused by the RBA rate hikes.
7. There is no major structural bias towards persistently higher inflation rates.
However, the new RBA governor came out flexing her muscles yesterday (Ocotber 24, 2023) in a speech to the financial markets – Monetary Policy in Australia: Complementarities and Trade-offs.
She said the RBA:
… will not hesitate to raise the cash rate further if there is a material upward revision to the outlook for inflation.
She went on to claim that it was not sensible to set a target to achieve full employment and the estimated NAIRU was a good starting point for assessing the state of the labour market.
While qualifying that statement, the real hint that the RBA is wedded to the NAIRU concept as a guide to interest rate policy came when she said:
Over time, low inflation and full employment go hand in hand.
This assertion has been used by the mainstream central bankers for ignoring any concern over the unemployment they might create through stifling aggregate spending through interest rate rises.
The belief is that if you fight ‘inflation first’ and get it down, then the unemployment that emerges from that approach will define full employment.
It justified claims in the 1990s, for example, that full employment was consistent with an unemployment rate of 8 or 9 per cent in Australia, which was a ridiculous assertion.
So we can expect the RBA to continue to think of unemployment as a policy tool to discipline spending and hence price rises.
The problem is that if we have a supply-driven inflation as we have now, such a conception will not achieve the goals intended.
Conclusion
The latest CPI data showed a slight uptick in the quarterly rate of inflation with the CPI rising by 1.2 per cent (up 0.4 points), largely due to petrol price rises and rental increases.
The latter is, in part, driven by the previous RBA interest rate hikes – so monetary policy causing inflation rather than reducing it.
The annual inflation rate, however, was significantly lower again in the September-quarter as the supply-side drivers abate – down to 5.4 per cent from 6.1 per cent in the June-quarter.
While the RBA has been threatening further rate hikes if the new data showed an increase in the inflation rate, there is nothing in this quarterly release that would justify that.
The fuel prices are not sensitive to domestic monetary policy and further rate hikes will make the rental situation worse.
That is enough for today!
(c) Copyright 2023 William Mitchell. All Rights Reserved
In a recent post, Adam Tooze concluded that the MMT people were always right.
The US has no monetary restrictions to shore up two simultaneous wars (Ukraine and Israel), but only resource restrictions (no productive capacity to build amunition).
He even quoted Stephanie Kelton.
But, that implies that the western world economy is all wrong.
So, no, MMT is to remain a shadow theory, not to be admitted in any possible way.
NAIRU is one of the biggest lies in the history of Economics. I was so convinced about that since I read the excellent book “The Misunderstood Economics” (1998) by the late American economist Robert Eisner.
According to the RBA’s Charter:
It is the duty of the Reserve Bank Board, within the limits of its powers, to ensure that the monetary and banking policy of the Bank is directed to the greatest advantage of the people of Australia and that the powers of the Bank … are exercised in such a manner as, in the opinion of the Reserve Bank Board, will best contribute to:
1. the stability of the currency of Australia;
2. the maintenance of full employment in Australia; and
3. the economic prosperity and welfare of the people of Australia.
SOURCE: https://www.rba.gov.au/publications/annual-reports/rba/2016/our-charter-core-functions-and-values.html
Given points 2 and 3 have been abandoned by the RBA Board it’s pretty obvious that if the elites want a rate rise, they will get it.