The recent extreme weather in the northern hemisphere, the twin monster tropical storms in Japan,…
Australian labour market – emerging signs that tight fiscal and monetary policy is killing prosperity
It’s been a big data week and after the US inflation data that I analysed on Monday, and the Australian wage data (analysed yesterday), we have the Australian labour force data release by the Australian Bureau of Statistics – Labour Force, Australia – for July 2023 today (August 17, 2023). The July result shows a weakening situation (although the rotation in the sample contributed to this somewhat). Employment fell (particularly full-time) and unemployment rose to 3.7 per cent (up 0.2 points). There are now 10.1 per cent of the available and willing working age population who are being wasted in one way or another – either unemployed or underemployed. That extent of idle labour means Australia is not really close to full employment despite the claims by the mainstream commentators. As I noted yesterday, wages growth is declining and modest. We will see next month whether this weakening is, in fact, a trend consistent with other indicators (retail sales, etc). Given inflation has been in decline since last September and there is no wages pressure, there is no reason for policy settings to be trying to push people into joblessness. That is just an act of bastardry and ideological zealotry.
The summary ABS Labour Force (seasonally adjusted) estimates for July 2023 are:
- Employment fell 14,600 (-0.1 per cent) – full-time employment decreased by 24,200 and part-time employment increased by 9,600.
- Unemployment rose 35,600 to 541,000 persons.
- The official unemployment rate rose 0.2 points to 3.7 per cent.
- The participation rate fell 0.1 point to 66.7 per cent.
- The employment-population ratio fell 0.2 points at 64.3 per cent.
- Aggregate monthly hours rose 4 million hours (0.2 per cent).
- Underemployment was unchanged at 6.4 per cent. Overall there are 929.9 thousand underemployed workers. The total labour underutilisation rate (unemployment plus underemployment) rose by 0.2 points to 10.1 per cent. There were a total of 1,470.8 thousand workers either unemployed or underemployed.
In its – Media Release – the ABS noted that:
The unemployment rate increased by 0.2 percentage points to 3.7 per cent in July …
Monthly hours worked increased 0.2 per cent in July 2023, while employment decreased 0.1 per cent. Some of the increase in hours worked reflected fewer people than usual taking leave during the school holidays.
Conclusion: The July result suggests that the predicted slowdown is now underway.
The media is speculating now on when the economy falls into recession on the back of the RBA interest rate hikes, which will increasingly bite as more people come off the fixed rates that have protected them in the first phase of the RBA hiking cycle.
It is a disgrace that the policy settings – monetary and fiscal – are such that unemployment is rising when inflation has been falling since September last year and there is no indication that the economy is operating beyond capacity.
Tuesday’s wage data also shows there is no wage pressure.
Employment fell 14,600 (-0.1 per cent) in July 2023
1. Full-time employment decreased by 24,200 and part-time employment increased by 9,600.
2. The employment-population ratio fell 0.2 points at 64.3 per cent.
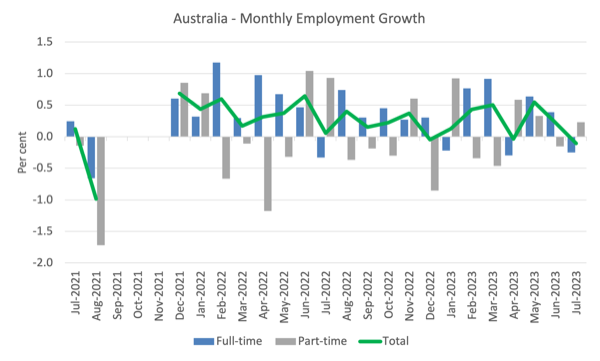
The following graph shows the month by month growth in full-time (blue columns), part-time (grey columns) and total employment (green line) for the 24 months to July 2023 using seasonally adjusted data.
I took out the observations from September to January 2021 – they were outliers due to the Covid wave at that time.
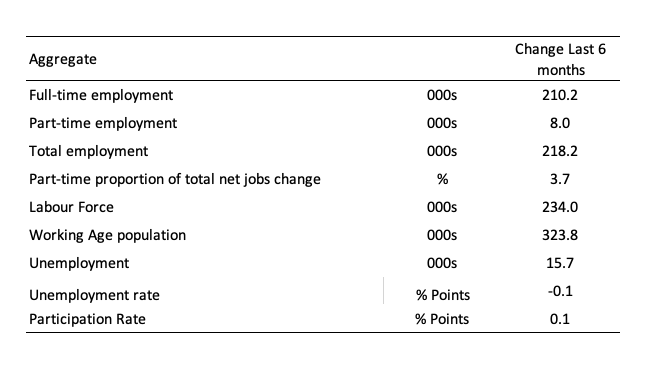
The following table provides an accounting summary of the labour market performance over the last six months to provide a longer perspective that cuts through the monthly variability and provides a better assessment of the trends.
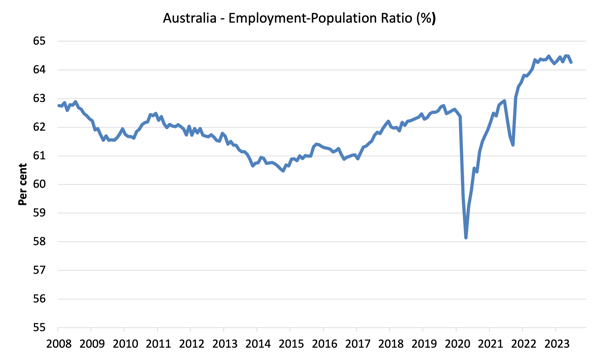
Given the variation in the labour force estimates, it is sometimes useful to examine the Employment-to-Population ratio (%) because the underlying population estimates (denominator) are less cyclical and subject to variation than the labour force estimates. This is an alternative measure of the robustness of activity to the unemployment rate, which is sensitive to those labour force swings.
The following graph shows the Employment-to-Population ratio, since January 2008 (that is, since the GFC).
The ratio fell by 0.2 points to 64.3 per cent in July 2023, which is a sign of weakening conditions.
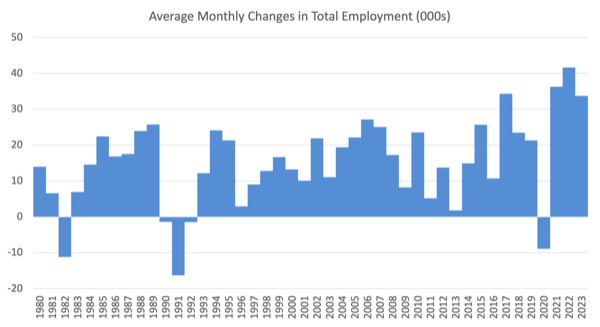
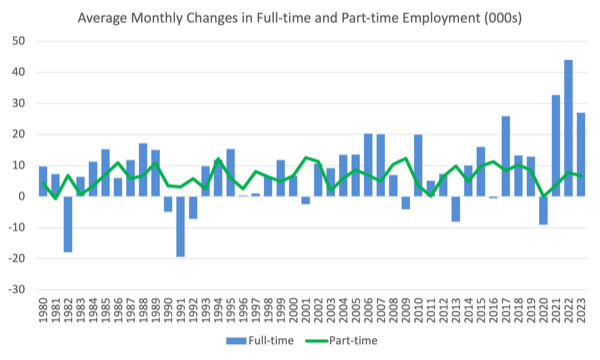
For perspective, the following graph shows the average monthly employment change for the calendar years from 1980 to 2022 (to date).
1. The average employment change over 2020 was -8.9 thousand which rose to 36.3 thousand in 2021 as the lockdowns eased.
2. For 2022, the average monthly change was 41.7 thousand.
3. So far, in 2023, the average change is 33.7 thousand and declining fairly quickly.
The following graph shows the average monthly changes in Full-time and Part-time employment (lower panel) in thousands since 1980.
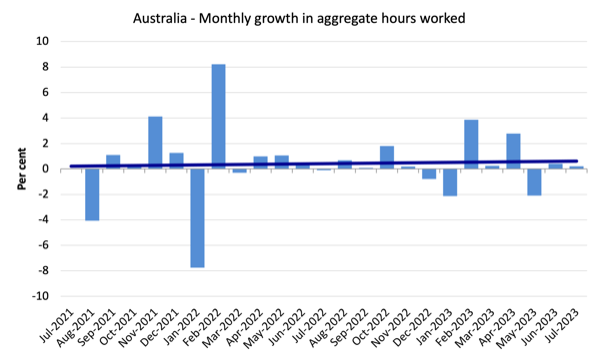
Hours worked rose 4 million hours (0.2 per cent) in July 2023
As noted above this was the result of more people declining to take holidays in July (traditional school break) than usual even as total employment was declining.
The following graph shows the monthly growth (in per cent) over the last 24 months.
The dark linear line is a simple regression trend of the monthly change (skewed upwards by the couple of outlier results).
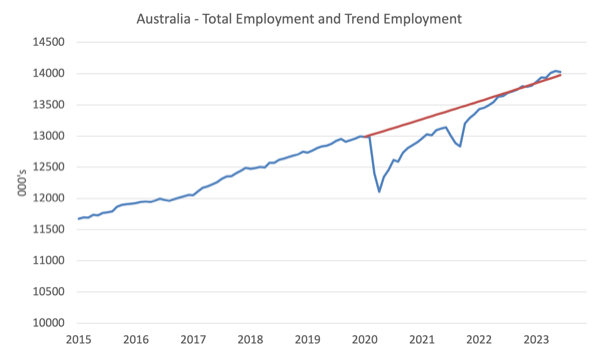
Actual and Trend Employment
The Australian labour market is now larger than it was in March 2020 and employment has now exceeded the pre-pandemic trend.
The following graph shows total employment (blue line) and what employment would have been if it had continued to grow according to the average growth rate between 2015 and April 2020.
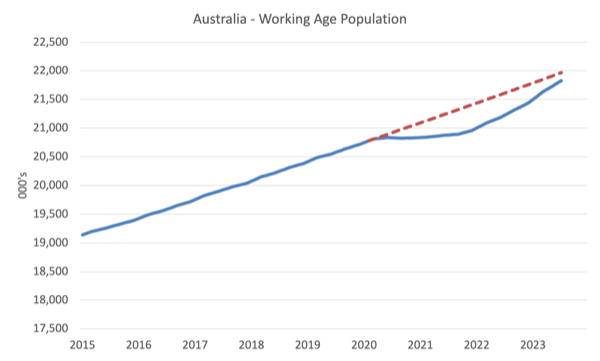
The Population Slowdown – the ‘What-if’ unemployment analysis
The following graph shows Australia’s working age population (Over 15 year olds) from January 2015 to July 2023. The dotted line is the projected growth had the pre-pandemic trend continued.
The difference between the lines is the decline in the working age population that followed the Covid restrictions on immigration.
The civilian population is 138.7 thousand less in July 2023 than it would have been had pre-Covid trends continued.
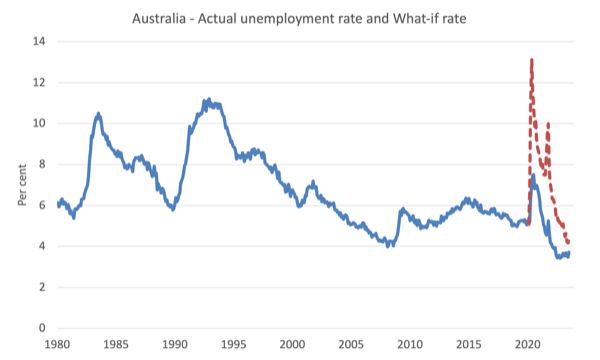
The following graph shows the evolution of the actual unemployment rate since January 1980 to July 2023 and the dotted line is the ‘What-if’ rate, which is calculated by assuming the most recent peak participation rate (recorded at July 2023 = 66.9 per cent), the extrapolated working age population (based on growth rate between 2015 and March 2020) and the actual employment since March 2020.
It shows what the unemployment rate would have been given the actual employment growth had the working age population trajectory followed the past trends.
In this blog post – External border closures in Australia reduced the unemployment rate by around 2.7 points (April 28, 2022), I provided detailed analysis of how I calculated the ‘What-if’ unemployment rate.
So instead of the current unemployment rate of 3.7 per cent, the rate would have been 4.4 per cent in July 2023, given the employment performance since the pandemic.
Unemployment rose 35,600 to 541,000 persons in July 2023
It is uncertain whether this month marks a turning point from stronger activity and stable (relatively) low unemployment towards a worse future ahead.
There was some noise in the rotation groups in the Survey this month (a higher unemployment group replaced a lower group) so we will have to wait until next month to see whether that mattered.
Further, the 0.1 point fall in the participation rate also meant the unemployment rate rose by less than otherwise. It is the second consecutive monthly decline in participation which probably reflects the slowing of employment opportunities.
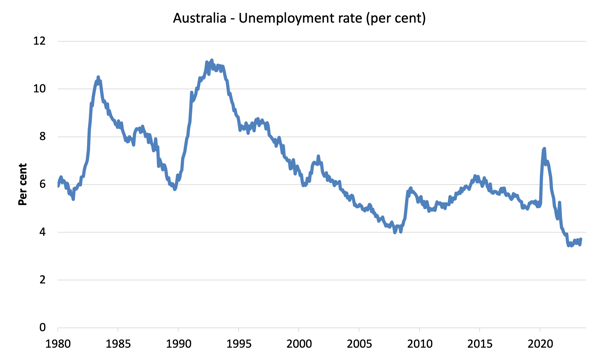
The following graph shows the national unemployment rate from January 1980 to July 2023. The longer time-series helps frame some perspective to what is happening at present.
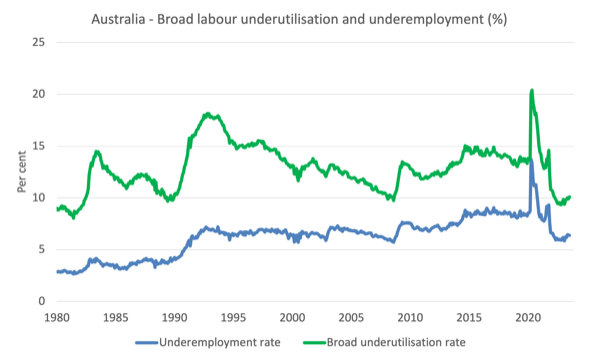
Broad labour underutilisation rose by 0.2 points to 10.1 per cent in July 2023
1. Underemployment was unchanged at 6.4 per cent.
2. Overall there are 929.9 thousand underemployed workers.
3. The total labour underutilisation rate (unemployment plus underemployment) rose by 0.2 points to 10.1 per cent.
4. There were a total of 1,470.8 thousand workers either unemployed or underemployed.
The following graph plots the seasonally-adjusted underemployment rate in Australia from April 1980 to the July 2023 (blue line) and the broad underutilisation rate over the same period (green line).
The difference between the two lines is the unemployment rate.
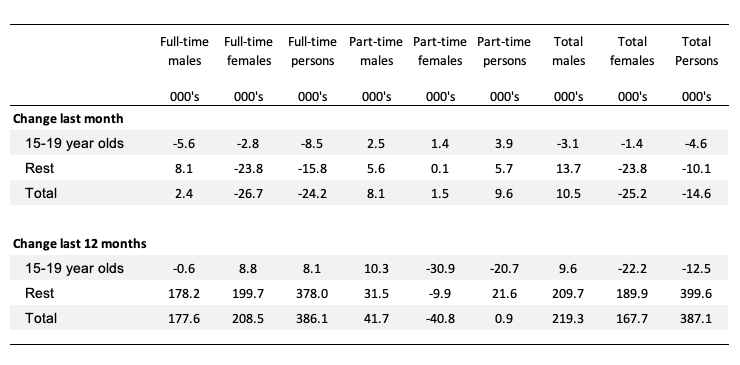
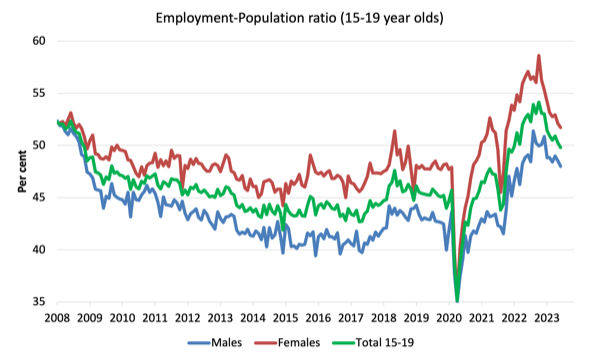
Teenage labour market contracts again in July 2023
Teenagers lost 4.6 thousand net jobs in July with full-time jobs falling by 8.5 thousand and part-time rising by 3.9 thousand.
The following Table shows the distribution of net employment creation in the last month and the last 12 months by full-time/part-time status and age/gender category (15-19 year olds and the rest).
To put the teenage employment situation in a scale context (relative to their size in the population) the following graph shows the Employment-Population ratios for males, females and total 15-19 year olds since July 2008.
You can interpret this graph as depicting the change in employment relative to the underlying population of each cohort.
In terms of the recent dynamics:
1. The male ratio fell 0.5 points over the month.
2. The female ratio fell 0.5 points.
3. The overall teenage employment-population ratio fell 0.5 points over the month.
Conclusion
My standard monthly warning: we always have to be careful interpreting month to month movements given the way the Labour Force Survey is constructed and implemented.
My overall assessment is:
1. The July result shows a weakening situation (although the rotation in the sample contributed to this somewhat).
2. Employment fell (particularly full-time) and unemployment rose to 3.7 per cent (up 0.2 points).
3. There are now 10.1 per cent of the available and willing working age population who are being wasted in one way or another – either unemployed or underemployed. That extent of idle labour means Australia is not really close to full employment despite the claims by the mainstream commentators.
4. As I noted yesterday, wages growth is declining and modest. We will see next month whether this weakening is, in fact, a trend consistent with other indicators (retail sales, etc).
5. Given inflation has been in decline since last September and there is no wages pressure, there is no reason for policy settings to be trying to push people into joblessness.
That is just an act of bastardry and ideological zealotry.
That is enough for today!
(c) Copyright 2023 William Mitchell. All Rights Reserved.
Unemployment is still well below 20%. Plenty more scope for interest rate increases to keep the Neo-Liberal dream alive.
China controls the antipodean economies.
Hi Bill,
Thank you very much for your analysis and blog. One question I have with regards to commentary about the labour market. Commentators talk about low productivity levels and hypothesise that perhaps the nature of work and industry today (services, the tertiary sector), doesn’t lead to productive work, in that the value add is low. What comments do you have around productivity, its causes and what could happen going forward?
Thank you!