The recent extreme weather in the northern hemisphere, the twin monster tropical storms in Japan,…
US labour market – ‘steady as she goes’
Last Friday (August 4, 2023), the US Bureau of Labor Statistics (BLS) released their latest labour market data – Employment Situation Summary – July 2023 – indicated a rather ‘steady as she goes’ outcome. A slightly weaker employment outlook compared to the beginning of 2023 but overall a very stable situation. There is no sign of recession and no sign that the misguided Federal Reserve interest rate rises are causing rises in unemployment. More evidence that monetary policy is not an effective tool.
For those who are confused about the difference between the payroll (establishment) data and the household survey data you should read this blog post – US labour market is in a deplorable state – where I explain the differences in detail.
Some months the difference is small, while other months, the difference is larger.
Payroll employment trends
The BLS noted that:
Total nonfarm payroll employment rose by 187,000 in July, less than the average monthly gain of 312,000 over the prior 12 months. In July, job gains occurred in health care, social assistance, financial activities, and wholesale trade …
In July, health care added 63,000 jobs, compared with the average monthly gain of 51,000 in the prior 12 months …
Social assistance added 24,000 jobs in July, in line with the average monthly gain of 23,000 in the prior 12 months …
Employment in financial activities increased by 19,000 in July. The industry had added an average of 16,000 jobs per month in the second quarter of the year, after employment was essentially flat in the first quarter …
In July, employment in wholesale trade increased by 18,000, after showing little net change in recent months.
Employment in the other services industry continued to trend up in July (+20,000), compared with the average monthly gain of 15,000 over the prior 12 months … Employment in other services remains below its pre-pandemic February 2020 level by 53,000, or 0.9 percent.
Construction employment continued to trend up in July (+19,000), in line with the average monthly gain of 17,000 in the prior 12 month …
In July, employment in leisure and hospitality was little changed (+17,000). The industry has shown little employment change in recent months, following average monthly gains of 67,000 in the first quarter of the year …
Employment in professional and business services changed little in July (-8,000). Monthly job growth in the industry had averaged 38,000 in the prior 12 months …
Employment showed little change over the month in other major industries …
In summary, January 2023 yielded 472 thousand net payroll jobs and that shift has now declined over the last 3 months.
While there is no sign of an impending recession average monthly job creation in net terms is well down on 2022.
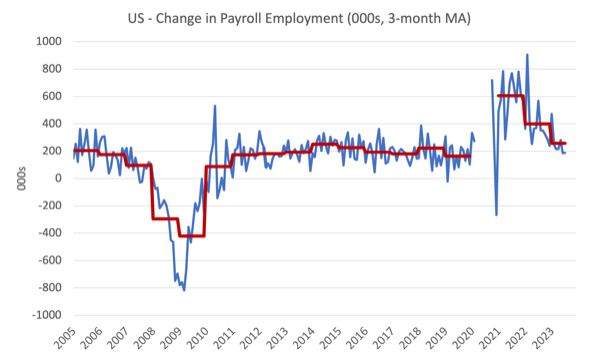
The first graph shows the monthly change in payroll employment (in thousands, expressed as a 3-month moving average to take out the monthly noise). The red lines are the annual averages. Observations between January 2020 and January 2020 were excluded as outliers.
You can see a distinct slowdown over the last two years after the surge after the initial Covid restrictions.
The next graph shows the same data in a different way – in this case the graph shows the average net monthly change in payroll employment (actual) for the calendar years from 2005 to 2023.
The red marker on the column is the current month’s result.
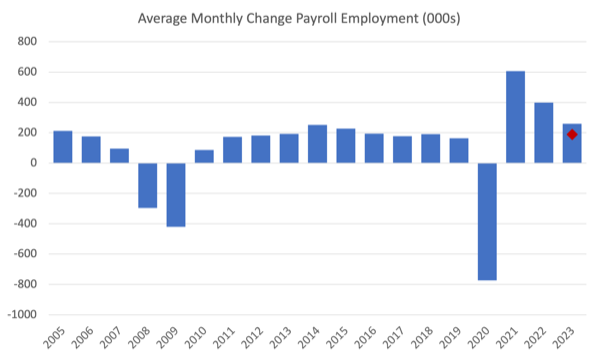
Average monthly change – 2019-2023 (000s)
| Year | Average Monthly Employment Change (000s) |
| 2019 | 163 |
| 2020 | -774 |
| 2021 | 606 |
| 2022 | 399 |
| 2023 (so far) | 258 |
Labour Force Survey data – employment up 273 thousand and unemployment down
The seasonally-adjusted data for July 2023 reveals:
1. Total labour force survey employment fell by 268 thousand net (0.17 per cent) – similar to last month.
2. The labour force rose 152 thousand net (0.09 per cent).
3.The participation rate was unchanged at 62.6 per cent.
4. As a result (in accounting terms), total measured unemployment fell by 116 thousand to 5,841 thousand and the official unemployment rate fell 0.1 point to 3.5 per cent (on rounding).
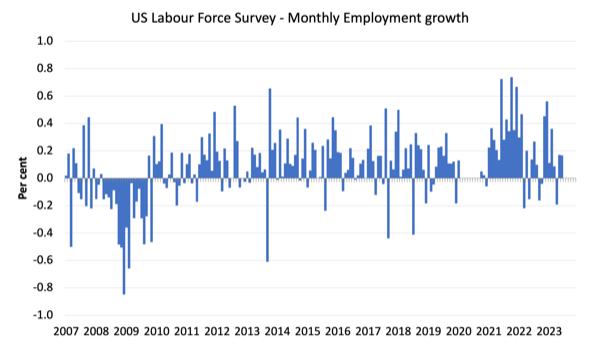
The following graph shows the monthly employment growth since January 2008 and excludes the extreme observations (outliers) between July 2020 and January 2020, which distort the current period relative to the pre-pandemic period.
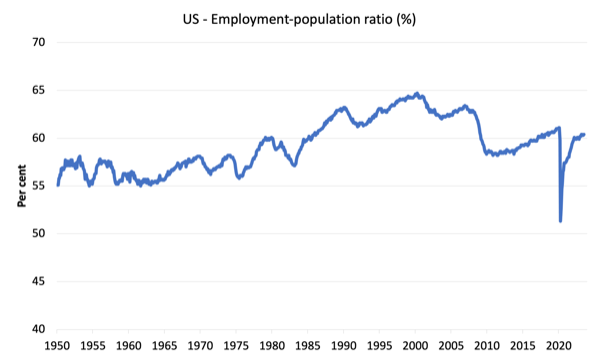
The Employment-Population ratio is a good measure of the strength of the labour market because the movements are relatively unambiguous because the denominator population is not particularly sensitive to the cycle (unlike the labour force).
The following graph shows the US Employment-Population from January 1950 to July 2023.
In July 2023, the ratio rose by 0.1 point to 60.4 per cent.
The peak level in July 2020 before the pandemic was 61.1 per cent.
Unemployment and underutilisation trends
The BLS note that:
Both the unemployment rate, at 3.5 percent, and the number of unemployed persons, at 5.8 million, changed little in July. The unemployment rate has ranged from 3.4 percent to 3.7 percent since March 2022 …
The number of long-term unemployed (those jobless for 27 weeks or more) was little changed at 1.2 million in July and accounted for 19.9 percent of all unemployed persons …
The number of persons employed part time for economic reasons, at 4.0 million, changed little in July. These individuals, who would have preferred full-time employment, were working part time because their hours had been reduced or they were unable to find full-time jobs.
Steady all round.
The slight weakening in hours worked last month was reversed this month.
The first graph shows the official unemployment rate since January 1994.
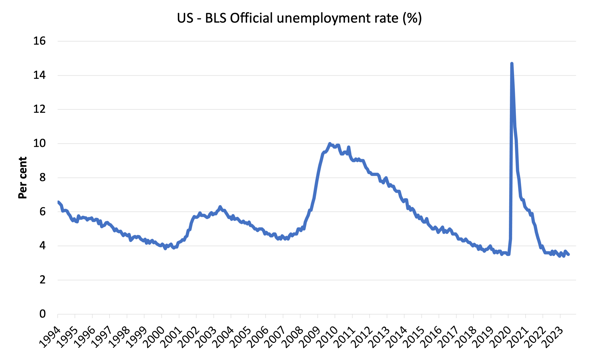
The official unemployment rate is a narrow measure of labour wastage, which means that a strict comparison with the 1960s, for example, in terms of how tight the labour market, has to take into account broader measures of labour underutilisation.
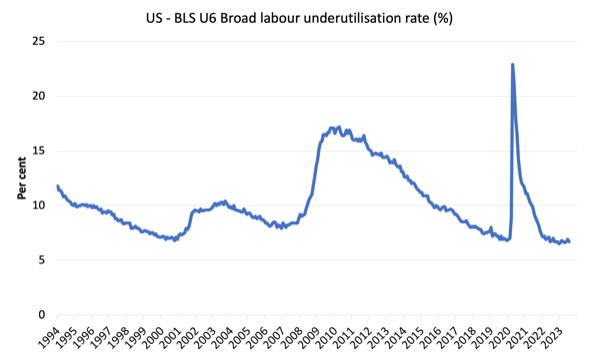
The next graph shows the BLS measure U6, which is defined as:
Total unemployed, plus all marginally attached workers plus total employed part time for economic reasons, as a percent of all civilian labor force plus all marginally attached workers.
It is thus the broadest quantitative measure of labour underutilisation that the BLS publish.
Pre-COVID, U6 was at 6.8 per cent (January 2019).
In July 2023 the U6 measure was 6.7 per cent, down by 0.2 points. It has been below 7 per cent since August 2022.
It fell this month because of the fall in ’employed for economic reasons’, which is the US category for hours-based underemployment.
What about wages growth in the US?
The BLS reported that:
In July, average hourly earnings for all employees on private nonfarm payrolls rose by 14 cents, or 0.4 percent, to $33.74. Over the past 12 months, average hourly earnings have increased by 4.4 percent. In July, average hourly earnings of private-sector production and nonsupervisory employees rose by 13 cents, or 0.5 percent, to $28.96.
The latest – BLS Real Earnings Summary – June 2023 (published July 12, 2023) – tells us that:
Real average hourly earnings for all employees increased 0.2 percent from May to June, seasonally adjusted … This result stems from an increase of 0.4
percent in average hourly earnings combined with an increase of 0.2 percent in the Consumer Price Index for All Urban Consumers (CPI-U).Real average weekly earnings increased 0.5 percent over the month due to the change in real average hourly earnings combined with a 0.3-percent increase in the average workweek.
Real average hourly earnings increased 1.2 percent, seasonally adjusted, from June 2022 to June 2023.
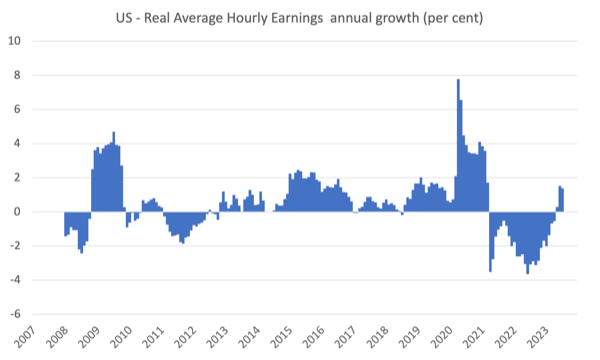
Overall, the inflationary pressures are moderating fast, and nominal wages growth is starting to deliver modest real wage increases. A good sign. But no major wages breakout is evident.
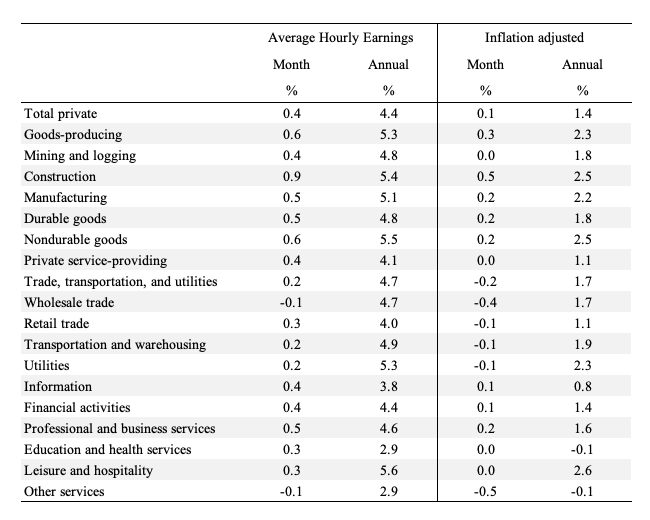
The following table shows the movements in nominal Average Hourly Earnings (AHE) by sector and the inflation-adjusted AHE by sector for July 2023 (note we are adjusting using the June CPI – the latest available).
Some sectors, however, are still not enjoying the modest real wage gains enjoyed elsewhere.
The following graph shows annual growth in real average hourly earnings from 2008 to July 2023.
The other indicator that tells us whether the labour market is turning in favour of workers is the quit rate.
The most recent BLS data – Job Openings and Labor Turnover Summary (released July 6, 2023) – shows that:
The number of job openings was little changed at 9.6 million on the last business day of June … Over the month, the number of hires and total separations decreased to 5.9 million and 5.6 million, respectively. Within separations, quits (3.8 million) decreased, while layoffs and discharges (1.5 million) changed little …
In June, the number and rate of quits decreased to 3.8 million (-295,000) and 2.4 percent, respectively.
So in June 2023, the quit rate fell modestly and the job openings was largely stable.
Conclusion
In July 2023, the latest US labour market data indicated a rather ‘steady as she goes’ outcome.
A slightly weaker employment outlook compared to the beginning of 2023 but overall a very stable situation.
There is no sign of recession and no sign that the misguided Federal Reserve interest rate rises are causing rises in unemployment.
More evidence that monetary policy is not an effective tool.
That is enough for today!
(c) Copyright 2023 William Mitchell. All Rights Reserved.
Neil DeGrasse Tyson worte a post on FB about churches that goes something like this “(…) I’m going to be up in your face if you’re going to knock on my science classroom and tell me they’ve got to teach what you’re teaching in your Sunday school.(…).
Replace “Sunday school” by “Chicago school” and all still makes sense.
Isn’t “Sunday school” of neoliberal macro-economics a church, were they expect you to believe in fairy tales?
In the XXI century, it’s about time that macro-economics should go to the science field.
That’s a good one, Paulo.