Economics and business correspondents regularly serve as apologists for poor policy. Their motivation is to…
Australian labour market – unemployment remains at 3.5 per cent yet inflation continues to fall – how can the NAIRU be 4.5 per cent?
The Australian Bureau of Statistics (ABS) released of the latest labour force data today (June 15, 2023) – Labour Force, Australia – for June 2023. The June result presents a relatively stable picture with moderate employment growth keeping pace with the underlying population growth and the unemployment rate being largely unchanged (a slight drop in rounding). The only negative is that participation fell by 0.1 point but that may just be monthly variance. We should realise though that there are still 9.9 per cent of the available and willing working age population who are being wasted in one way or another – either unemployed or underemployed. That extent of idle labour means Australia is not really close to full employment despite the claims by the mainstream commentators. As I note below, the stability of the unemployment rate at around 3.5 per cent coupled with the rather sharp declines in the inflation rate indicate that the RBA claims that unemployment must rise to bring inflation down is spurious. Their so-called estimate of the NAIRU at 4.5 per cent should mean that inflation is still accelerating given the actual unemployment rate of 3.5 per cent. Exactly the opposite is occurring.
The summary ABS Labour Force (seasonally adjusted) estimates for June 2023 are:
- Employment rose by 32,600 (0.2 per cent) – full-time employment rose by 39,300 and part-time employment fell by 6,700.
- Unemployment fell 10,900 to 504,400 persons.
- The official unemployment rate fell by 0.1 point to 3.5 per cent.
- The participation rate fell 0.1 point to 66.8 per cent.
- The employment-population ratio was unchanged at 64.5 per cent.
- Aggregate monthly hours rose 6 million hours (0.3 per cent).
- Underemployment was unchanged at 6.4 per cent. Overall there are 935.2 thousand underemployed workers. The total labour underutilisation rate (unemployment plus underemployment) fell by 0.1 point to 9.9 per cent. There were a total of 1,439.6 thousand workers either unemployed or underemployed.
In its – Media Release – the ABS noted that:
… The unemployment rate remained at 3.5 per cent in June (seasonally adjusted), in line with the updated figure for May …
The rise in employment in June saw the employment-to-population ratio remain at a record high 64.5 per cent, reflecting a tight labour market in which employment has recently increased in line with population growth …
The strength in hours worked since late 2022, relative to employment growth, shows the demand for labour is continuing to be met, to some extent, by people working more hours …
Consistent with the stronger growth in hours worked, full-time employment has increased by 380,000 people over the past year, while part-time employment increased by 30,000.
Conclusion: The June result shows no major change in the circumstances and defies the RBA’s efforts to push the unemployment rate up even though inflation is falling.
The question that should be asked by the journalists is this: the employment-population ratio has been very steady over the last several months which means that employment is keeping pace with the underlying population growth, given the participation rate has also been largely steady.
So whether we want to call this a tight labour market is debatable with so much underemployment and unemployment remaining.
But whatever the state of the labour market, the inflation rate is falling fairly quickly back to lower levels.
The RBA has claimed that the NAIRU is 4.5 per cent or thereabouts, which means a stable unemployment rate of 3.5 per cent (as it is now and has been for a while) should be associated with accelerating inflation.
Yet, we are observing the opposite and that is because the estimates of the NAIRU are without any substance.
Hocus Pocus!
The falling inflation indicates in NAIRU logic that ‘full employment’ is at some unemployment rate below the current 3.5 per cent.
Why don’t the journalists quiz the new RBA governor about that.
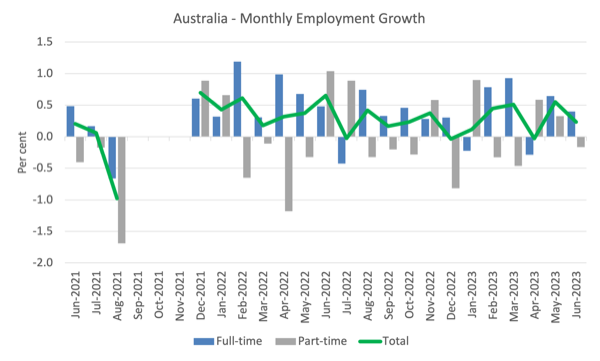
Employment rose by 32,600 (0.2 per cent) in June 2023
1. Full-time employment rose by 39,300 and part-time employment fell by 6,700.
2. The employment-population ratio was unchanged at 64.5 per cent.
The following graph shows the month by month growth in full-time (blue columns), part-time (grey columns) and total employment (green line) for the 24 months to June 2023 using seasonally adjusted data.
I took out the observations from September to January 2021 – they were outliers due to the Covid wave at that time.
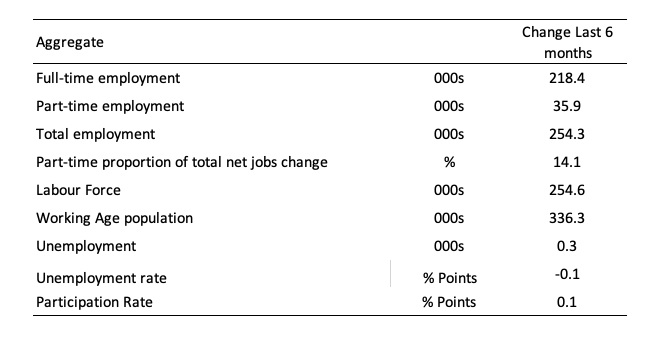
The following table provides an accounting summary of the labour market performance over the last six months to provide a longer perspective that cuts through the monthly variability and provides a better assessment of the trends.
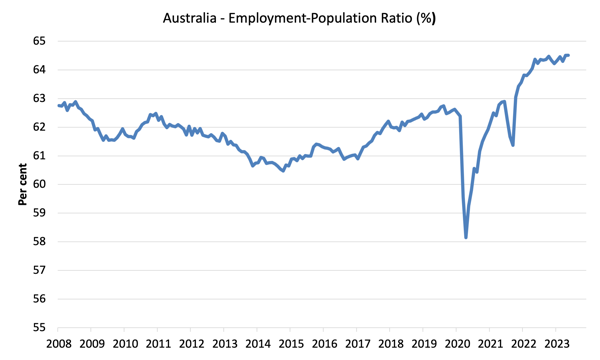
Given the variation in the labour force estimates, it is sometimes useful to examine the Employment-to-Population ratio (%) because the underlying population estimates (denominator) are less cyclical and subject to variation than the labour force estimates. This is an alternative measure of the robustness of activity to the unemployment rate, which is sensitive to those labour force swings.
The following graph shows the Employment-to-Population ratio, since January 2008 (that is, since the GFC).
The ratio was unchanged at 64.5 per cent in June 2023, which is a record high.
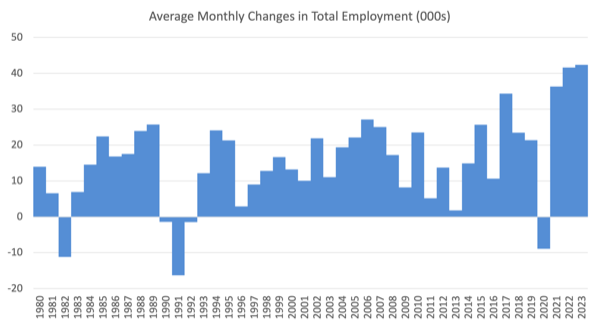
For perspective, the following graph shows the average monthly employment change for the calendar years from 1980 to 2022 (to date).
1. The average employment change over 2020 was -8.9 thousand which rose to 36.3 thousand in 2021 as the lockdowns eased.
2. For 2022, the average monthly change was 41.7 thousand.
3. So far, in 2023, the average change is 42.4 thousand and rising.
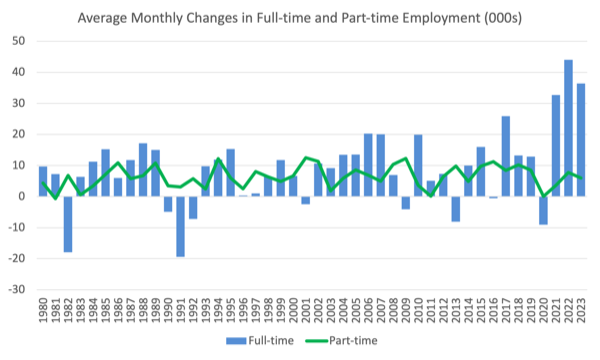
The following graph shows the average monthly changes in Full-time and Part-time employment (lower panel) in thousands since 1980.
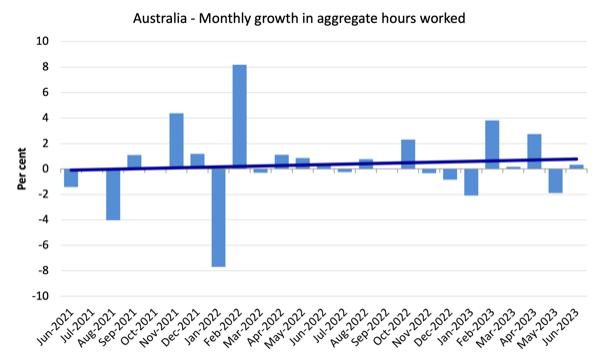
Hours worked rose 6 million hours (0.3 per cent) in June 2023
The following graph shows the monthly growth (in per cent) over the last 24 months.
The dark linear line is a simple regression trend of the monthly change (skewed upwards by the couple of outlier results).
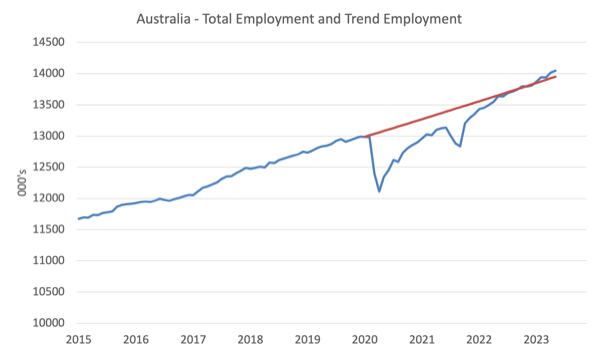
Actual and Trend Employment
The Australian labour market is now larger than it was in March 2020 and employment has now exceeded the pre-pandemic trend.
The following graph shows total employment (blue line) and what employment would have been if it had continued to grow according to the average growth rate between 2015 and April 2020.
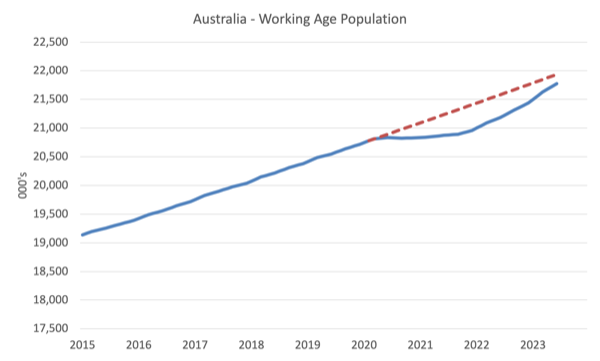
The Population Slowdown – the ‘What-if’ unemployment analysis
The following graph shows Australia’s working age population (Over 15 year olds) from January 2015 to June 2023. The dotted line is the projected growth had the pre-pandemic trend continued.
The difference between the lines is the decline in the working age population that followed the Covid restrictions on immigration.
The civilian population is 159.6 thousand less in June 2023 than it would have been had pre-Covid trends continued.
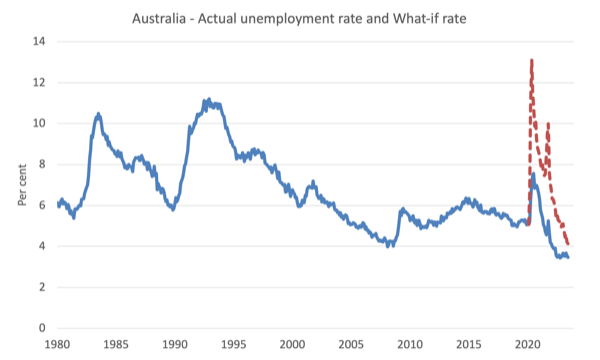
The following graph shows the evolution of the actual unemployment rate since January 1980 to June 2023 and the dotted line is the ‘What-if’ rate, which is calculated by assuming the most recent peak participation rate (recorded at June 2023 = 66.9 per cent), the extrapolated working age population (based on growth rate between 2015 and March 2020) and the actual employment since March 2020.
It shows what the unemployment rate would have been given the actual employment growth had the working age population trajectory followed the past trends.
In this blog post – External border closures in Australia reduced the unemployment rate by around 2.7 points (April 28, 2022), I provided detailed analysis of how I calculated the ‘What-if’ unemployment rate.
So instead of the current unemployment rate of 3.5 per cent, the rate would have been 4.1 per cent in June 2023, given the employment performance since the pandemic.
Unemployment fell 10,900 to 504,400 persons in June 2023
Employment growth is keeping pace with the underlying working age population growth.
But this month the 0.1 point fall in the participation rate also meant the unemployment rate remained stable.
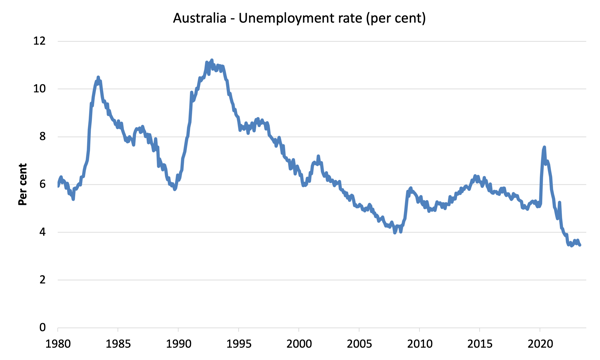
The following graph shows the national unemployment rate from January 1980 to June 2023. The longer time-series helps frame some perspective to what is happening at present.
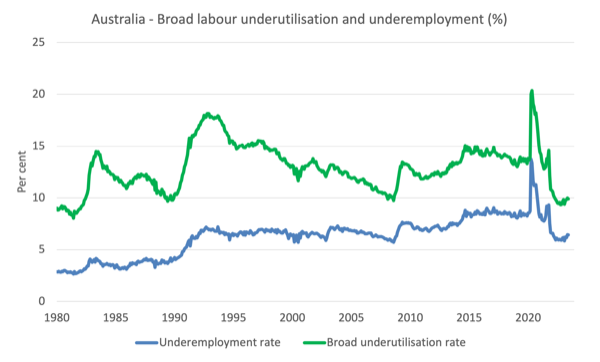
Broad labour underutilisation fell 0.1 point to 9.9 per cent in June 2023
1. Underemployment was unchanged at 6.4 per cent.
2. Overall there are 935.2 thousand underemployed workers.
3. The total labour underutilisation rate (unemployment plus underemployment) fell by 0.1 point to 9.9 per cent.
4. There were a total of 1,439.6 thousand workers either unemployed or underemployed.
The following graph plots the seasonally-adjusted underemployment rate in Australia from April 1980 to the June 2023 (blue line) and the broad underutilisation rate over the same period (green line).
The difference between the two lines is the unemployment rate.
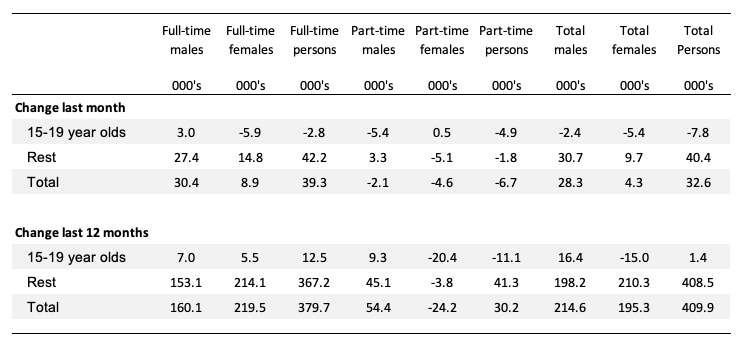
Teenage labour market contracts in June 2023
Teenagers lost 7.8 thousand net jobs in April with full-time jobs falling by 2.8 thousand and part-time falling by 4.9 thousand.
The following Table shows the distribution of net employment creation in the last month and the last 12 months by full-time/part-time status and age/gender category (15-19 year olds and the rest).
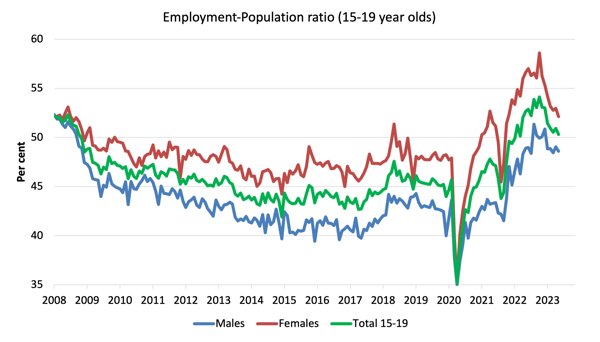
To put the teenage employment situation in a scale context (relative to their size in the population) the following graph shows the Employment-Population ratios for males, females and total 15-19 year olds since June 2008.
You can interpret this graph as depicting the change in employment relative to the underlying population of each cohort.
In terms of the recent dynamics:
1. The male ratio fell 0.4 points over the month.
2. The female ratio fell 0.8 points.
3. The overall teenage employment-population ratio fell 0.6 points over the month.
Conclusion
My standard monthly warning: we always have to be careful interpreting month to month movements given the way the Labour Force Survey is constructed and implemented.
My overall assessment is:
1. The June result presents a relatively stable picture with moderate employment growth keeping pace with the underlying population growth and the unemployment rate being largely unchanged (a slight drop in rounding).
2. The only negative is that participation fell by 0.1 point but that may just be monthly variance.
3. We should realise though that there are still 9.9 per cent of the available and willing working age population who are being wasted in one way or another – either unemployed or underemployed.
4. That extent of idle labour means Australia is not really close to full employment despite the claims by the mainstream commentators.
5. The stability of the unemployment rate at around 3.5 per cent coupled with the rather sharp declines in the inflation rate indicate that the RBA claims that unemployment must rise to bring inflation down is spurious.
6. Their so-called estimate of the NAIRU at 4.5 per cent should mean that inflation is still accelerating given the actual unemployment rate of 3.5 per cent. Exactly the opposite is occurring.
That is enough for today!
(c) Copyright 2023 William Mitchell. All Rights Reserved.
This Post Has 0 Comments