Economics and business correspondents regularly serve as apologists for poor policy. Their motivation is to…
Australian inflation rate has peaked and falling fast – but not fast enough for the interest rate boosters
Today (April 26, 2023), the Australian Bureau of Statistics released the latest – Consumer Price Index, Australia – for the March-quarter 2023. It showed that the CPI rose 1.4 per cent in the quarter (down 0.4 points) and over the 12 months by 7 per cent (down 0.8 points). The monthly data, also released today (which I do not analyse here) shows inflation dropping from 7.4 per cent in January to 6.8 per cent in February to 6.3 per cent in March. Significant downward trend as the supply factors abate. Taken together we conclude that the peak has now passed, which is consistent with my assessment that this would be a transient, supply-driven event. There are no wage pressures and inflationary expectations are in decline or steady. The laughable thing is that as the rate falls, the mainstream narrative, which continues to push for higher interest rates, has shifted from a focus on the inflation rate itself to the claim that it is now not falling fast enough. The claimed fears are now that the longer it remains at elevated levels the more chance there will be of a wage-price spiral breaking out and/or accelerating (un-anchored) expectations. Neither are likely given the situation before us and that leads to the conclusion that these interest rate boosters are just exuding hot air as usual. The major sources of price increases are temporary and in the March-quarter are the direct result of discretionary government administrative arrangements (indexation arrangements etc), which could easily be waived this year. The correct policy response should be to provide fiscal support for lower-income households to help them cope with the cost of living rises at present. Increasing interest rates again will not solve the problem that is already abating.
The summary, seasonally-adjusted Consumer Price Index results for the March-quarter 2023 are as follows:
- The All Groups CPI rose by 1.4 per cent for the quarter – 0.4 points down from the last quarter.
- The All Groups CPI rose by 7 per cent over the 12 months (a decline from 7.8 per cent in the December-quarter 2022).
- The major determinants were Medical and hospital services (+4.2 per cent), Tertiary education (+9.7 per cent), Gas and other household fuels (+14.3 per cent), and Domestic holiday travel and accommodation (+4.7 per cent).
- The Trimmed mean series rose by 1.2 per cent for the quarter (down 0.5 points) and 6.6 per cent over the previous year.
- The Weighted median series rose by 1.2 per cent (down 0.4 points) for the quarter and 5.8 per cent over the previous year.
The ABS Media Release notes that:
CPI inflation slowed in the March quarter, with the quarterly rise being the lowest since December 2021. While prices continued to rise for most goods and services, many of these increases were smaller than they have been in recent quarters …
Prices for medical and hospital services typically rise in the March quarter as GPs and other health service providers review their consultation fees, and the Medicare Safety Net is reset at the start of the calendar year. This year some private health insurance premiums also increased in January, adding to the price rise for medical and hospital services …
Tertiary education fees are also indexed at the start of the year …
higher wholesale gas prices … reflected major events over the past year including the ongoing war in Ukraine and unplanned outages at coal fired power stations …
Food prices … shortages due to wet weather …
Fruit prices …. due to damaging weather …
Short assessment:
1. The inflation rate is falling significantly each quarter – and note that the central bank boosters are all now shifting their narratives from out of control inflation to stupid claims that ‘it is not falling fast enough’.
2. Examine the current drivers – they do not reflect excessive demand at all.
They indicate administrative arrangements (indexation arrangements, annual reviews) which are the direct responsibility of government – for example, the government could waive the indexation of university fees this year and the inflation rate would drop significantly.
They also indicated bad weather – floods, fires etc.
None of the drivers could be said to be interest sensitive, which then calls into question the entire macroeconomic strategy where the RBA is trying to deliberately create unemployment to suppress incomes and spending.
How will interest rate rises stop the war in the Ukraine?
How will interest rate rises fix up the lousy weather?
Trends in inflation
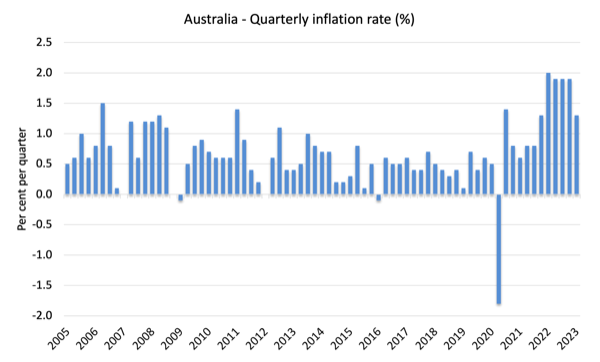
The headline inflation rate increased by 1.4 per cent in the March-quarter 2023 a 0.4 points fall over the quarter.
Over the 12 months to December the inflation rate was 7.4 per cent (down 0.4 points).
The following graph shows the quarterly inflation rate since the December-quarter 2005.
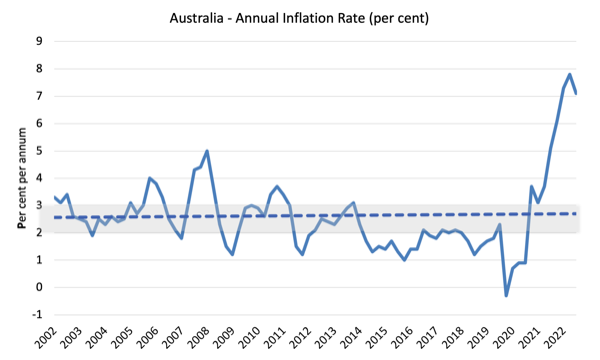
The next graph shows the annual headline inflation rate since the first-quarter 2002. The shaded area is the RBA’s so-called targetting range (but read below for an interpretation).
The trend inflation rate (dotted line) which reflects labour costs and productivity growth will reassert itself once the temporary factors abate is downwards.
What is driving inflation in Australia?
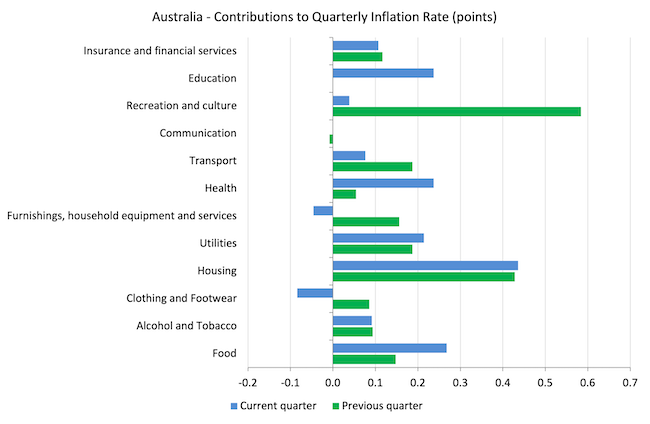
The following bar chart compares the contributions to the quarterly change in the CPI for the March-quarter 2023 (blue bars) compared to the December-quarter 2022 (green bars).
Note that Utilities is a sub-group of Housing and not insignificantly reflects government administrative decisions
The Recreation and culture inflation from the last quarter represented a bounce-back from the restricted movement in the last two years as borders open and nations relax travel requirements.
I predicted in January that it would normalise over the next few months and that was a correct assessment.
The Education price inflation is due to government indexation arrangements.
The impacts of the bad floods on food prices remains a problem.
Most of the inflationary pressures continue to be driven by supply-side factors and/or reflecting non-competitive and unregulated cartel-type behaviour and government policy choices.
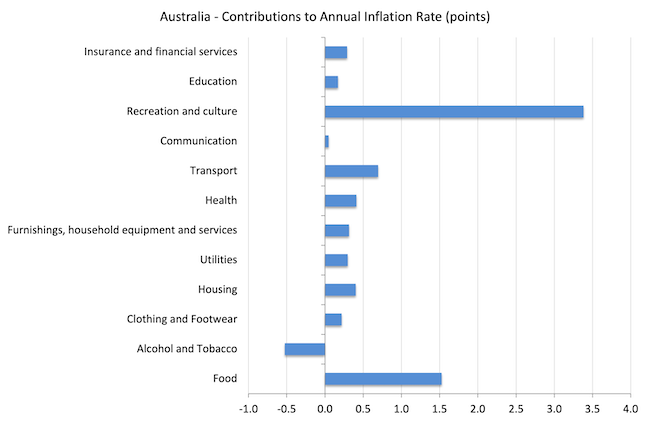
The next graph shows the contributions in points to the annual inflation rate by the various components.
The main drivers will disappear in coming quarters given their origin (see above).
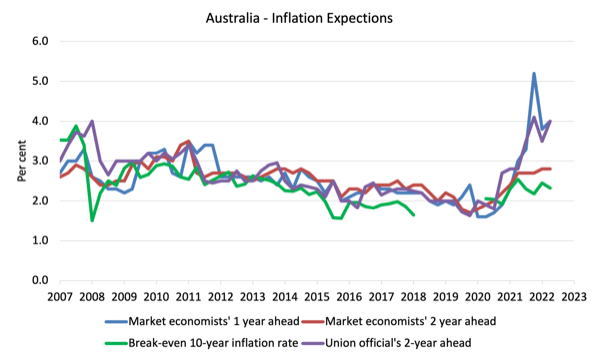
Inflation and Expected Inflation
The following graph shows four measures of expected inflation produced by the RBA – Inflation Expectations – G3 – from the December-quarter 2005 to the December-quarter 2021.
The four measures are:
1. Market economists’ inflation expectations – 1-year ahead.
2. Market economists’ inflation expectations – 2-year ahead – so what they think inflation will be in 2 years time.
3. Break-even 10-year inflation rate – The average annual inflation rate implied by the difference between 10-year nominal bond yield and 10-year inflation indexed bond yield. This is a measure of the market sentiment to inflation risk. This is considered the most reliable indicator.
4. Union officials’ inflation expectations – 2-year ahead.
Notwithstanding the systematic errors in the forecasts, the price expectations (as measured by these series) are now falling or relatively stable.
However, in the case of the Market economists’ inflation expectations – 2-year ahead and the Break-even 10-year inflation rate, the expectations remain well within the RBA’s inflation targetting range (2-3 per cent) and show no signs of accelerating.
So all the talk now is that inflation is not falling fast enough – and that claim is accompanied by claims that the longer it remains above the inflation targetting range, the more likely it is that a wage-price spiral and/or accelerating (unanchored) expectations will drive the rate up for longer.
Neither claim can be remotely justified given the data.
Implications for monetary policy
What does this all mean for monetary policy?
Most commentators – looking at the annual headline figure of 7.4 per cent – claim the RBA has no option but to hike rates even further not because inflation is rising (that narrative has gone) but because it is not falling fast enough.
I have touched on that storyline above and dismiss it outright.
The RBA already has been grossly negligent in its decisions to lift rates 10 times since May 2023.
There was never a justification with an evidential-basis for those decisions.
The interest rate rises were never going to quell the factors contributing to the inflationary pressures and the only result of the hikes has been to badly hurt low-income families with housing mortgages, many of whom overextended themselves on the back of statements by the RBA governor that they would not raise rates until 2024.
The Consumer Price Index (CPI) is designed to reflect a broad basket of goods and services (the ‘regimen’) which are representative of the cost of living. You can learn more about the CPI regimen HERE.
The RBA’s formal inflation targeting rule aims to keep annual inflation rate (measured by the consumer price index) between 2 and 3 per cent over the medium term.
However, the RBA uses a range of measures to ascertain whether they believe there are persistent inflation threats.
Please read my blog post – Australian inflation trending down – lower oil prices and subdued economy – for a detailed discussion about the use of the headline rate of inflation and other analytical inflation measures.
The RBA does not rely on the ‘headline’ inflation rate. Instead, they use two measures of underlying inflation which attempt to net out the most volatile price movements.
The concept of underlying inflation is an attempt to separate the trend (“the persistent component of inflation) from the short-term fluctuations in prices. The main source of short-term ‘noise’ comes from “fluctuations in commodity markets and agricultural conditions, policy changes, or seasonal or infrequent price resetting”.
The RBA uses several different measures of underlying inflation which are generally categorised as ‘exclusion-based measures’ and ‘trimmed-mean measures’.
So, you can exclude “a particular set of volatile items – namely fruit, vegetables and automotive fuel” to get a better picture of the “persistent inflation pressures in the economy”. The main weaknesses with this method is that there can be “large temporary movements in components of the CPI that are not excluded” and volatile components can still be trending up (as in energy prices) or down.
The alternative trimmed-mean measures are popular among central bankers.
The authors say:
The trimmed-mean rate of inflation is defined as the average rate of inflation after “trimming” away a certain percentage of the distribution of price changes at both ends of that distribution. These measures are calculated by ordering the seasonally adjusted price changes for all CPI components in any period from lowest to highest, trimming away those that lie at the two outer edges of the distribution of price changes for that period, and then calculating an average inflation rate from the remaining set of price changes.
So you get some measure of central tendency not by exclusion but by giving lower weighting to volatile elements. Two trimmed measures are used by the RBA: (a) “the 15 per cent trimmed mean (which trims away the 15 per cent of items with both the smallest and largest price changes)”; and (b) “the weighted median (which is the price change at the 50th percentile by weight of the distribution of price changes)”.
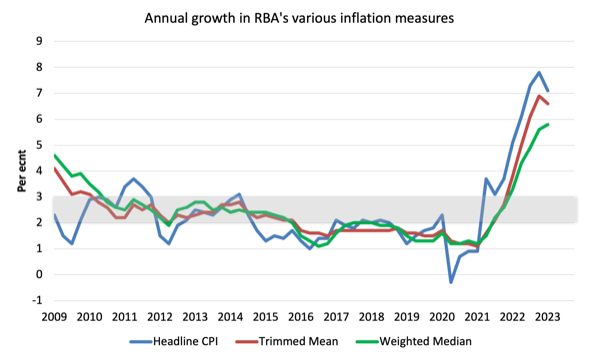
So what has been happening with these different measures?
The following graph shows the three main inflation series published by the ABS since the December-quarter 2009 – the annual percentage change in the All items CPI (blue line); the annual changes in the weighted median (green line) and the trimmed mean (red line).
The RBAs inflation targetting band is 2 to 3 per cent (shaded area). The data is seasonally-adjusted.
The three measures are in annual terms:
1. CPI measure of inflation rose by 7.1 per cent (down from 7.8 per cent last quarter). For the quarter it rose by 1.4 points (down from 1.9)
2. The Trimmed Mean rose 6.6 per cent (down from 6.9 per cent last quarter). For the quarter it rose 1.2 points (down from 1.7).
3. The Weighted Median rose 5.8 per cent (up from 5.6 per cent last quarter). For the quarter it rose by 1.2 points (down from 1.6).
How to we assess these results?
1. The RBA’s preferred measures are now outside the targetting range and would normally trigger an interest rate rise.
2. However,there is no evidence that inflationary expectations are accelerating.
3. While all series rose over the quarter on an annual basis, all three measures showed a decline in the growth for the quarter.
3. The major drivers of the inflation are mostly driven by factors that the RBA cannot address through interest rate rises – energy prices, floods, and bushfires.
4. There is no wages pressure.
5. The other major contributors to the current situation are also not sensitive to interest rate rises.
6. There is no major structural bias towards persistently higher inflation rates.
Conclusion
The annual inflation rate in Australia was significantly lower in the December-quarter and the peak is now gone.
The monthly data, also released today (which I do not analyse here) shows inflation dropping from 7.4 per cent in January to 6.3 per cent in March.
The major sources of price increases are temporary and some are the direct result of discretionary government administrative arrangements (indexation arrangements etc), which could easily be waived this year.
The correct policy response should be to provide fiscal support for lower-income households to help them cope with the cost of living rises at present.
That is enough for today!
(c) Copyright 2023 William Mitchell. All Rights Reserved.
Adam Tooze posted today one of his chartbooks, entitled ” ‘Bank walk’, the first CBAM, credit allocation & a dirge for John Coltrane”, and he recalls an episode, featured by Andrew Brimmer, a Federal Reserve governor, back in April 1970.
And it goes like this: in a speech, Brimmer defended credit alocation, which translates to: tightening credit to some loans, while easing other loans.
53 years have gone by and the answer still is: No!
We might question why?
The answer is: quantitative tightening is all about class war; it benefits the very rich, empoverishes the middle classes and destroys the lower classes.
I can give you an example: I paid no interest on my mortgage between September 2019 until August 2022.
In March 2023, I’m paying around 106€ every month.
As defaults accrue and banks fail, the Feds and ECBs of this world are more than happy to bail them out, as happened recently with the SVB and Credit Suisse.
You can imagine where those 106€/month will go, as soon as banks start colapsing in the eurozone (the clock is ticking…).
And it won’t be enough, of course.
If the middle classes won’t deliver enough (if you don’t have the dow, you can’t give it away, right?), the “printers” will start working day and night, in another QE bout.
And, suprise, suprise, QE is all about credit alocation: as we’ve seen already, it all ends up in the real estate business.
By whom?
By the very rich, of course.