On May 19, 2026, Oxfam Australia's media release - Australian billionaires’ wealth grows by $50,000…
US labour market – shows further signs of slowing
Last Friday (November 4, 2022), the US Bureau of Labor Statistics (BLS) released their latest labour market data – Employment Situation Summary – November 2022 – which suggested that the US labour market showed signs of slowing further, with payroll employment growing by just 261,000 net jobs. The labour force measure showed employment and labour force growth turning negative as the participation edged down. The result was that the official unemployment rate rose by 0.1 points to 3.7 per cent. There are also no fundamental wage pressures emerging at present to drive any further inflation spikes. Wages growth appears to be reactive to inflation rather than propelling it. Wages growth appears to be reactive to inflation rather than propelling it. The claim that wage pressures are now pushing inflation is untenable given the data.
Overview for October 2022 (seasonally adjusted):
- Payroll employment increased by 261,000.
- Total labour force survey employment fell by 328 by thousand net (-0.21 per cent).
- The labour force fell by 22 thousand net (-0.01 per cent).
- The employment-population ratio fell 0.1 point 60 per cent (still lower than the May 2020 peak of 61.2).
- Total measured unemployment rose by 306 thousand to 6,059 thousand.
- The official unemployment rate rose 0.2 points to 3.7 per cent.
- The participation rate fell by 1 point to 62 per cent.
- The broad labour underutilisation measure (U6) rose 0.1 point to 6.8 per cent.
For those who are confused about the difference between the payroll (establishment) data and the household survey data you should read this blog post – US labour market is in a deplorable state – where I explain the differences in detail.
Some months the difference is small, while other months, the difference is larger.
The differences were quite large this month.
Payroll employment trends
The BLS noted that:
Total nonfarm payroll employment increased by 261,000 in October. Monthly job growth has averaged 407,000 thus far in 2022, compared with 562,000 per month in 2021. In October, notable job gains occurred in health care, professional and technical services, and manufacturing …
In October, employment in health care rose by 53,000 … So far in 2022, health care employment has increased by an average of 47,000 per month, compared with 9,000 per month in 2021 …
Professional and technical services added 43,000 jobs in October … Monthly job growth … has averaged 41,000 thus far in 2022, compared with 53,000 per month in 2021.
Manufacturing added 32,000 jobs in October … increased by an average of 37,000 per month thus far this year, compared with 30,000 per month in 2021.
Employment in social assistance increased by 19,000 in October and is slightly below (-9,000) its pre-pandemic level in February 2020 …
Wholesale trade added 15,000 jobs in October … has increased by an average of 17,000 per month thus far in 2022, compared with 13,000 per month in 2021.
Employment in leisure and hospitality continued to trend up in October (+35,000) … has added an average of 78,000 jobs per month thus far this year, less than half of the average gain of 196,000 jobs per month in 2021. Employment in
leisure and hospitality is down by 1.1 million, or 6.5 percent, from its February 2020 level.Employment in transportation and warehousing changed little in October (+8,000) … has averaged 25,000 thus far this year, compared with 36,000 per month in 2021.
In October, financial activities employment was little changed (+3,000) … has changed little over the past 6 months.
Employment changed little over the month in other major industries, including mining, construction, retail trade, information, other services, and government.
There were also major revisions for August (down 23,000) and September (up 52,000) as a result of “additional reports received from businesses and government agencies”.
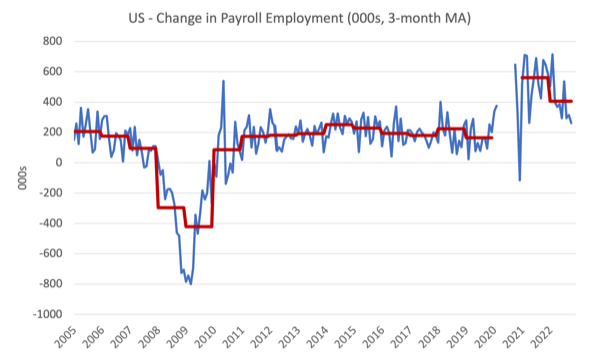
The first graph shows the monthly change in payroll employment (in thousands, expressed as a 3-month moving average to take out the monthly noise). The red lines are the annual averages. I left out the observations between January 2020 and October 2020, which were so extreme that they make it harder to compare the current period with the pre-pandemic history.
The US labour market has now exceeded the pre-pandemic level by 514 thousand jobs although the gains are not even across the sectors as detailed above.
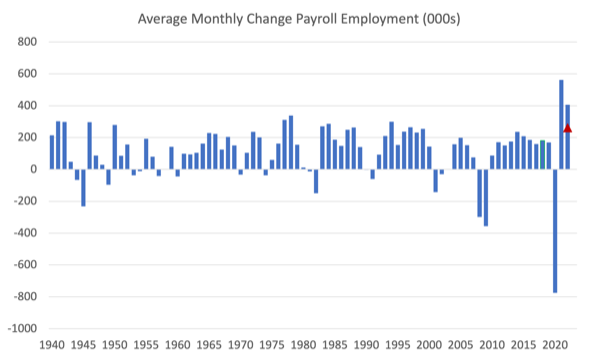
The next graph shows the same data in a different way – in this case the graph shows the average net monthly change in payroll employment (actual) for the calendar years from 2005 to 2021.
The red marker on the column is the current month’s result.
The final average for 2019 was 164 thousand.
The final average for 2020 was -774 thousand.
The final average for 2021 was 562 thousand.
The average so far in 2022 is 407 thousand and falling fast.
Labour Force Survey data – employment growth now in decline
The seasonally-adjusted data for October 2022 reveals:
1. Total labour force survey employment fell by 328 thousand net (-0.21 per cent).
2. The labour force declined by 22 thousand net (0.01 per cent).
3. The participation rate fell by 0.1 points to 62.2 per cent.
4. As a result (in accounting terms), total measured unemployment rose by 306 thousand to 6,059 thousand and the official unemployment rate rose by 0.2 points to 3.7 per cent.
Taken together these results signal a faltering labour market.
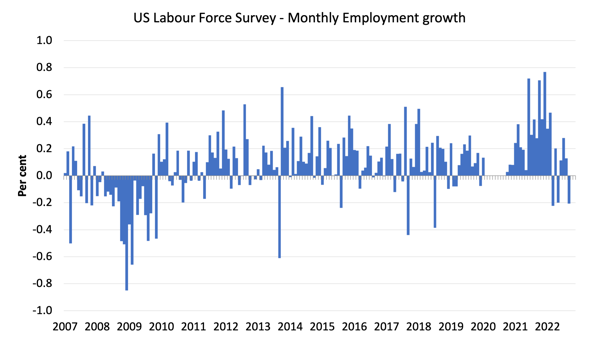
The following graph shows the monthly employment growth since January 2008 and excludes the extreme observations (outliers) between May 2020 and October 2020, which distort the current period relative to the pre-pandemic period.
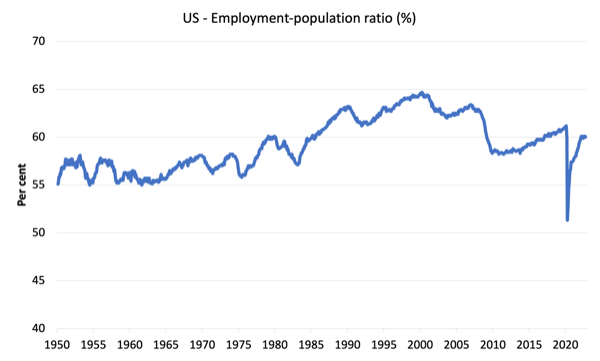
The Employment-Population ratio is a good measure of the strength of the labour market because the movements are relatively unambiguous because the denominator population is not particularly sensitive to the cycle (unlike the labour force).
The following graph shows the US Employment-Population from January 1950 to October 2022.
In October 2022, the ratio fell by 0.1 point 60 per cent.
The peak level in May 2020 before the pandemic was 61.1 per cent.
Unemployment and underutilisation trends
The BLS note that:
The unemployment rate increased by 0.2 percentage point to 3.7 percent in October, and the number of unemployed persons rose by 306,000 to 6.1 million. The unemployment rate has been in a narrow range of 3.5 percent to 3.7 percent since March …
The number of long-term unemployed (those jobless for 27 weeks or more) was little changed at
1.2 million in October. The long-term unemployed accounted for 19.5 percent of all unemployed
persons …The number of persons employed part time for economic reasons was little changed at 3.7 million in October. These individuals, who would have preferred full-time employment, were working part time because their hours had been reduced or they were unable to find full-time jobs …
The reasons the unemployment rate rose in October were:
1. Employment growth was negative
2. The labour force contracted marginally as the participation rate edged down.
3. The contraction in employment was larger than the contraction in the labour force.
The first graph shows the official unemployment rate since January 1994.
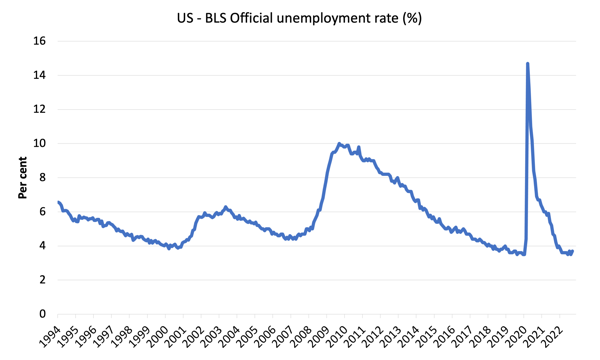
The official unemployment rate is a narrow measure of labour wastage, which means that a strict comparison with the 1960s, for example, in terms of how tight the labour market, has to take into account broader measures of labour underutilisation.
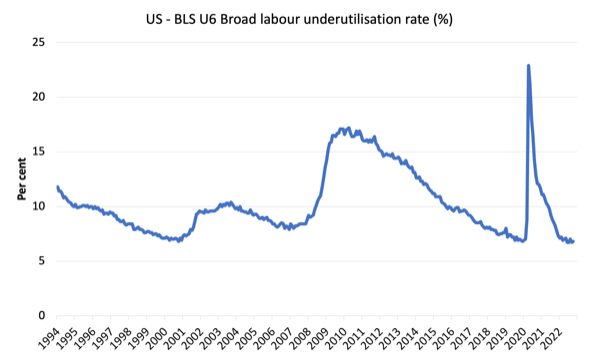
The next graph shows the BLS measure U6, which is defined as:
Total unemployed, plus all marginally attached workers plus total employed part time for economic reasons, as a percent of all civilian labor force plus all marginally attached workers.
It is thus the broadest quantitative measure of labour underutilisation that the BLS publish.
Pre-COVID, U6 was at 6.8 per cent (December 2019).
In October 2022 the U6 measure was 6.8 per cent, an decrease of 0.1 point.
The decline was because unemployment rose with and workers forced to work part-time for economic reasons – which is the US indicator of underemployment – stable.
What are wages doing in the US?
With inflation rising sharply at present and the Federal Reserve pretending there is a major wage problem that needs to be disciplined with rising mass unemployment, one would expect to see strong nominal wages growth pushing the price level along.
The BLS reported that:
In October, average hourly earnings for all employees on private nonfarm payrolls rose by 12 cents, or 0.4 percent, to $32.58. Over the past 12 months, average hourly earnings have increased by 4.7 percent. In October, average hourly earnings of private-sector production and nonsupervisory employees rose by 9 cents, or 0.3 percent, to $27.86.
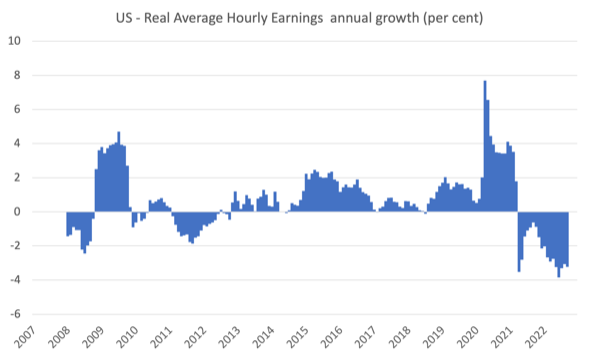
However, the latest – BLS Real Earnings Summary (published October 13, 2022) – tells us that:
Real average hourly earnings for all employees decreased 0.1 percent from August to September, seasonally adjusted … This result stems from an increase of 0.3 percent in average hourly earnings combined with an increase of 0.4 percent in the Consumer Price Index for All Urban Consumers (CPI-U) …
Real average hourly earnings decreased 3.0 percent, seasonally adjusted, from September 2021 to September 2022. The change in real average hourly earnings combined with a decrease of 0.9 percent in the average workweek resulted in a 3.8-percent decrease in real average weekly earnings over this period.
The following graph shows annual growth in real average hourly earnings from 2008 to September 2022.
It is hard to say the inflation episode is a ‘wages story’.
The other indicator that tells us whether the labour market is turning in favour of workers is the quit rate.
The most recent BLS data shows that the the quit rate has been relatively stable over the last year falling slightly from 2.8 to 2.7 per cent of total employment between August 2021 and September 2022.
Conclusion
In October 2022, the US labour market showed signs of slowing further, with payroll employment growing by just 261,000 net jobs.
The labour force measure showed employment and labour force growth turning negative as the participation edged down.
The result was that the official unemployment rate rose by 0.1 points to 3.7 per cent.
There are also no fundamental wage pressures emerging at present to drive any further inflation spikes. Wages growth appears to be reactive to inflation rather than propelling it.
That is enough for today!
(c) Copyright 2022 William Mitchell. All Rights Reserved.
Why is it necessary to throw people out of work, introduce mortgage/cost of living stress etc to tame inflation?
Surely fiscal measures would do the job as well -i.e. short term super tax.
Yes. new jobs were ‘only’ 261K . But they were expected to be only 200K.
So as Warren points out in a very recent tweet this infers a sign of job growth! True? Or just diff ways of emphasizing stats??
Dear Andy (at 2022/11/07 at 10:14 pm)
Sure enough expectations were wrong, which just means they were overly pessimistic. But you don’t judge outcomes in terms of deviation of expectation to actual.
If the actual is in decline, which it has been for some months then there is a slowdown.
It is not a large decline yet and monetary policy changes have not yet caused a meltdown. That is true.
But it is still slowing.
best wishes
bill
Would the US government spending on the Ukraine war be having some stimulatory effect?
They’ve been sending large amounts of military and related hardware to Ukraine which then needs to be replaced. US defence contractors must be raking it in. If the domestic defence industry is being primed to churn out more things that go bang, I imagine this would be flowing back into the US economy.
The mainstream are clearly interpreting wage data completely differently to Bill since they appear convinced that the data demonstrates a significantly serious wage-price spiral underway in the US, the UK, New Zealand etc. The RBA seems to think that Australia is one of the few places where this is not occurring.
Dear Bill, Thanks. That sounds logical. You better set Warren str8! Lol.
But seriously, maybe I don’t know numbers but 261K new jobs seems Huge to me. Can there really be that many and more new jobs even needed each month?? Or does that figure include someone leaving one job cuz they need or prefer a new job? If so the decline could just be not as many people changing jobs?
Ps…loved your edgy Jumpin Jack rendition!!
The correct response to stagflation is the 1966 Interest Rate Adjustment Act. “while the aggregate of time and demand deposits continued to increase after July, the proportion of time to demand deposits diminished. Whereas time deposits were 105 percent of demand deposits in July, by the end of the year, the proportion had fallen to 98 percent. These were all desirable developments.”
M1 peaked @137.2 on 1/1/1966 and didn’t exceed that # until 9/1/1967. Deposit rates of banks decreased from a high range of 5 1/2 to a low range of 4 % (albeit not enough). A .75% interest rate differential was given to the nonbanks.
And during this period, the unemployment rate and inflation rates fell.