Last week, the RBA hiked interest rates again and tried to claim the economy was…
Long-term inflationary expectations falling in Australia as housing goes into reverse
There is hysteria in the air today after the Australian Bureau of Statistics released the June-quarter – Consumer Price Index, Australia (July 27, 2022). Journalists are jumping over their keyboards to see who can come up with the most alarming headline and narrative. Me? I am calm. The price pressures will soon enough evaporate given their source. Inflation in the June-quarter 2022 rose to 1.7 per cent, down from 2.1 per cent in the March-quarter. The annualised rate of CPI inflation was 6.1 per cent. The most significant contributors over the year were owner-occupied housing, food, automotive fuel and furniture (the latter being largely due to transport costs). But looking at just the quarter results, we can see that housing is now a negative contributor as major government programs which pushed the boom are gone and interest rates are higher. We can do little to alleviate the rising fuel costs (except make public transport free and work from home) and the food inflation is down to the recent massive floods wiping out crops. That will be a temporary influence. So some of the factors driving the inflation are short-term and the others will be resolved by factors outside our control. But with wage pressures absent and the most reliable indicator of medium- to long-term inflation now falling, it is hard to make a case that the rising inflation is now entrenched. The hysteria is unjustified.
The summary, seasonally-adjusted Consumer Price Index results for the June-quarter 2022 are as follows:
- The All Groups CPI rose by 1.7 per cent (down from 2.1 per cent) for the quarter.
- The All Groups CPI rose by 6.1 per cent over the 12 months.
- The major determinants were New dwelling purchases by owner-occupiers (up 5.6 per cent), Automotive fuel (up 4.2 per cent) and Furniture (up 7.0 per cent).
- The Trimmed mean series rose by 1.5 per cent for the quarter and 4.9 per cent over the previous year.
- The Weighted median series rose by 1.4 per cent for the quarter and 4.2 per cent over the previous year.
The ABS Media Release notes that:
Shortages of building supplies and labour, high freight costs and ongoing high levels of construction activity continued to contribute to price rises for newly built dwellings. Fewer grant payments made this quarter from the Federal Government’s HomeBuilder program and similar state-based housing construction programs also contributed to the rise …
Short assessment: The inflation is being driven by a relatively narrow set of circumstances related to the supply disruptions from the global pandemic and shortages of timber due to the massive bushfires in late 2019/early 2020 which burned down lots of forests and created a shortage in timber.
The boom in domestic housing was also caused by fiscal measures that targetted home ownership provided incentives for young first-home buyers to borrow large sums at low interest rates and push the housing prices up dramatically.
Coupled with the dysfunctional tax breaks on multiple home ownership (negative gearing) and it is not hard to see why house prices rose by around 20 per cent over the last 12 months.
When designing fiscal stimulus strategies it doesn’t make much sense to direct large spending boosts to privates areas/sectors which are already facing massive supply constraints due to a paucity of stock.
It is far better either to build more social housing per se or direct the stimulus elsewhere.
t is also hard to see how interest rate rises will reduce these pressures (see below).
Trends in inflation
The headline inflation rate increased by 1.7 per cent in the June-quarter 2022 and 6.1 per cent over the 12 months.
The rise is transitory (mostly an adjustment in fuel prices as transport resumes and building materials).
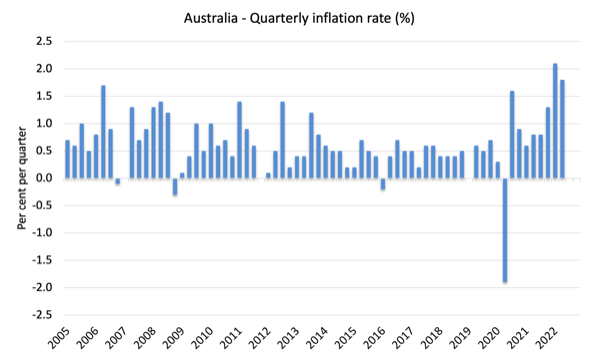
The following graph shows the quarterly inflation rate since the June-quarter 2005.
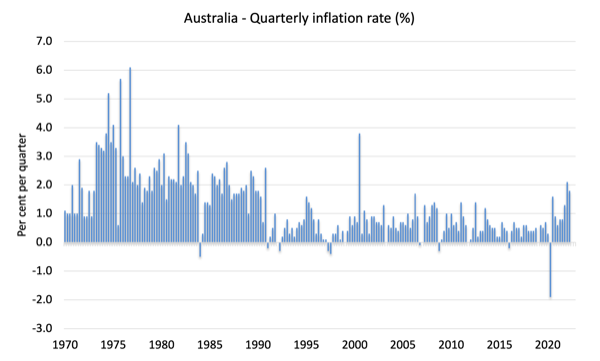
To put that into historical perspective, here is the series since the June-quarter 1970. We are nowhere near the inflationary pressures that followed the OPEC price rises in 1973.
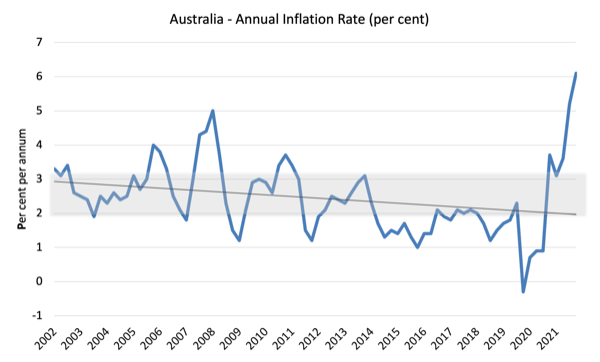
The next graph shows the annual headline inflation rate since the first-quarter 2002. The black line is a simple regression trend line depicting the general tendency. The shaded area is the RBA’s so-called targetting range (but read below for an interpretation).
The trend inflation rate over this long period is downwards.
What is driving inflation in Australia?
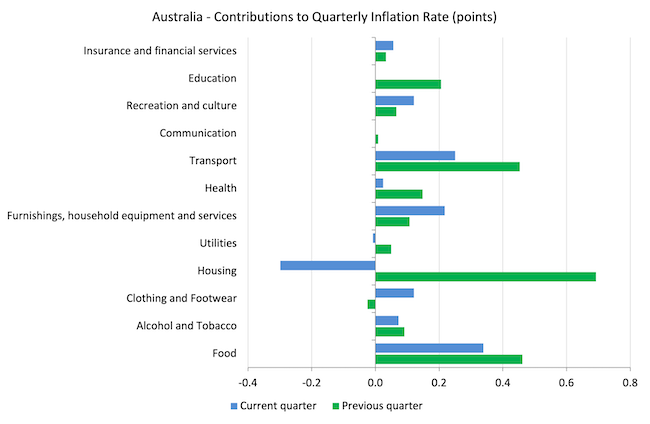
The following bar chart compares the contributions to the quarterly change in the CPI for the June-quarter 2022 (blue bars) compared to the March-quarter 2022 (green bars).
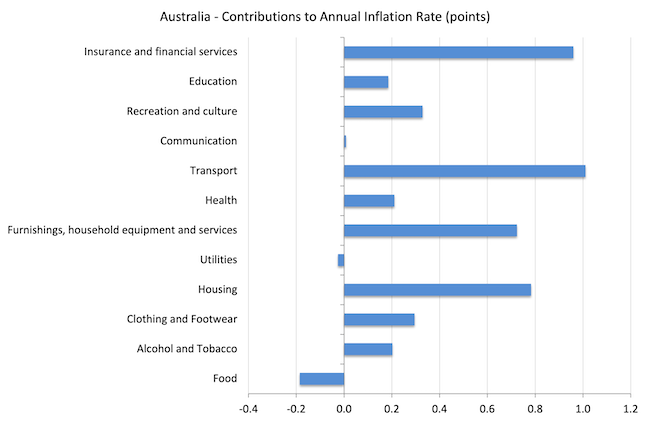
Note that Utilities is a sub-group of Housing.
As you will see in the graph that follows, housing is a major driver of the annual inflation figure (June-quarter 2021 to June-quarter 2022) but its contribution in the most recent quarter (March-quarter 2022 to June-quarter 2022) is negative.
That is, housing inflation is now in reverse. The boom is over because government programs have been largely withdrawn and interest rates have started to work to quell borrowing. More the former than the latter.
This quarter it is petrol and food driving the inflation.
None of these influences have much to do with the state of the economy – oil prices are cartel driven and the food price hikes are largely due to the massive floods that have wiped out crops this year.
The ABS notes that:
Supply chain disruptions due to flooding events, labour shortages, and rising freight costs contributed to higher prices.
The next graph provides shows the contributions in points to the annual inflation rate by the various components.
Inflation and Expected Inflation
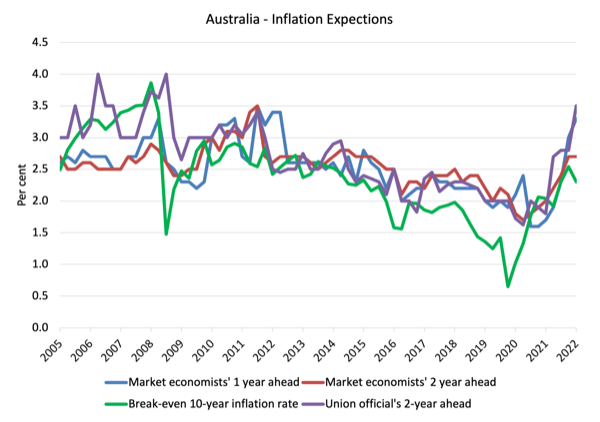
The following graph shows four measures of expected inflation expectations produced by the RBA – Inflation Expectations – G3 – from the June-quarter 2005 to the June-quarter 2021.
The four measures are:
1. Market economists’ inflation expectations – 1-year ahead.
2. Market economists’ inflation expectations – 2-year ahead – so what they think inflation will be in 2 years time.
3. Break-even 10-year inflation rate – The average annual inflation rate implied by the difference between 10-year nominal bond yield and 10-year inflation indexed bond yield. This is a measure of the market sentiment to inflation risk.
4. Union officials’ inflation expectations – 2-year ahead.
Notwithstanding the systematic errors in the forecasts, the price expectations (as measured by these series) have risen over the last year, which is hardly surprising.
But they are hardly going ‘through the roof’.
The most reliable measure – the Break-even 10-year inflation rate – is now in decline, falling 0.2 points to 2.3 per cent and within the RBA targetting range.
This measure is a good indicator of long-term inflation expectations.
The 2-year market economists’ expectation is static. Another sign of transitory nature of this inflation.
That all supports the notion that this is not looking like an endemic inflationary episode.
Implications for monetary policy
What does this all mean for monetary policy?
The RBA uses a range of measures to ascertain whether they believe there are persistent inflation threats.
Please read my blog post – Australian inflation trending down – lower oil prices and subdued economy – for a detailed discussion about the use of the headline rate of inflation and other analytical inflation measures.
The Consumer Price Index (CPI) is designed to reflect a broad basket of goods and services (the ‘regimen’) which are representative of the cost of living. You can learn more about the CPI regimen HERE.
The RBA’s formal inflation targeting rule aims to keep annual inflation rate (measured by the consumer price index) between 2 and 3 per cent over the medium term.
The RBA also does not rely on the ‘headline’ inflation rate. Instead, they use two measures of underlying inflation which attempt to net out the most volatile price movements.
To understand the difference between the headline rate and other non-volatile measures of inflation, you might like to read the June 2010 RBA Bulletin which contains an interesting article – Measures of Underlying Inflation. That article explains the different inflation measures the RBA considers and the logic behind them.
The concept of underlying inflation is an attempt to separate the trend (“the persistent component of inflation) from the short-term fluctuations in prices. The main source of short-term ‘noise’ comes from “fluctuations in commodity markets and agricultural conditions, policy changes, or seasonal or infrequent price resetting”.
The RBA uses several different measures of underlying inflation which are generally categorised as ‘exclusion-based measures’ and ‘trimmed-mean measures’.
So, you can exclude “a particular set of volatile items – namely fruit, vegetables and automotive fuel” to get a better picture of the “persistent inflation pressures in the economy”. The main weaknesses with this method is that there can be “large temporary movements in components of the CPI that are not excluded” and volatile components can still be trending up (as in energy prices) or down.
The alternative trimmed-mean measures are popular among central bankers.
The authors say:
The trimmed-mean rate of inflation is defined as the average rate of inflation after “trimming” away a certain percentage of the distribution of price changes at both ends of that distribution. These measures are calculated by ordering the seasonally adjusted price changes for all CPI components in any period from lowest to highest, trimming away those that lie at the two outer edges of the distribution of price changes for that period, and then calculating an average inflation rate from the remaining set of price changes.
So you get some measure of central tendency not by exclusion but by giving lower weighting to volatile elements. Two trimmed measures are used by the RBA: (a) “the 15 per cent trimmed mean (which trims away the 15 per cent of items with both the smallest and largest price changes)”; and (b) “the weighted median (which is the price change at the 50th percentile by weight of the distribution of price changes)”.
So what has been happening with these different measures?
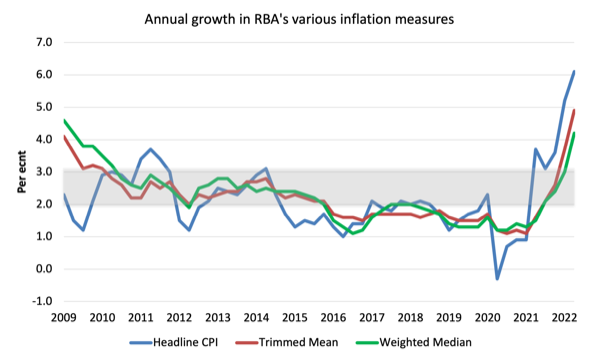
The following graph shows the three main inflation series published by the ABS since the June-quarter 2009 – the annual percentage change in the All items CPI (blue line); the annual changes in the weighted median (green line) and the trimmed mean (red line).
The RBAs inflation targetting band is 2 to 3 per cent (shaded area). The data is seasonally-adjusted.
The three measures are all currently below the RBA’s targetting range:
1. CPI measure of inflation rose by 6.1 per cent (up from 5.1 per cent last quarter).
2. The RBAs preferred measures – the Trimmed Mean was 4.9 per cent and the Weighted Median was 4.2 – are currently outside the the RBAs targetting range but given the movement in housing price inflation that divergence will not last long.
How to we assess these results?
1. There has been a lot of talk about inflationary expectations breaking out and that has been used to justified the interest rate rises.
The private banking economists that are continually wheeled out in the media to comment on prospective interest obviously talk up interest rate rises because their organisations benefit, which poses the question as to why they are used in this way and held out as independent authorities.
But the most reliable indicator of medium- and long-term inflation is now falling.
2. One of the major drivers of the inflation – housing – is now a negative contributor.
3. In my view (with no vested interests), the inflation trends provide no basis for the RBA to keep hiking interest rates.
4. There is no wages pressure.
5. Major contributors are in decline.
6. There is no major structural bias towards persistently higher inflation rates.
Conclusion
The inflation rate in Australia is following world trends upwards, although it is still below the US levels.
The major sources of price increases are temporary – adjustments back to pre-pandemic levels, anti-competitive cartel behaviour and the War in Ukraine.
In Australia’s case, these influences are supplemented by shortages of building materials due to bushfires and food price inflation due to the major floods.
I am calm.
The correct policy response should be to provide fiscal support for lower-income households to help them cope with the cost of living rises at present.
That is enough for today!
(c) Copyright 2022 William Mitchell. All Rights Reserved.
There are threats to the global economy, but we are looking in the wrong directions.
The neoliberal regime is keen in pointing to wage-price spirals, and Putin’s war, and other fairy tales, but there is no wage-price spiral – at least not yet (nevertheless, if the profits-price spiral doens’t reverse soon, we’ll see a global yellow vest movement – already began in many parts of the world).
But the most serious threat to the global economy is global hunger.
With a huge world population of around 8 billions, any disruption can cause millions of deaths in the global south.
And there are droughts all over the world, threatning crops.
Violent storms are becoming more frequent and a storm can ruin vast areas of crops in minutes.
There are fertilizers shortgages, threatning crops too (the industry relies on natural gas to produce the most important of the fertilizers – nitrogen – and the Russians are cutting the suplly to europe).
And there have been farmer’s strikes, as just happened in the Netherlands (and we all know what French farmers are capable of…).
Food shortage can be a inflationary disaster, so big that it can turn our present woes into paltry stuff.
I remember Etiopia in the 1980s, the women, men and children dying of desease and malnutrition, all sacrified in the altar of the neoliberal religion, imposed on the world by the guns-crazy empire.
The facile mainstream media coverage of this has me shouting at the television. FFS!
Hi Bill and thanks for your calming review of the entirety of the data release – something a few of the ‘business’ journalists in Australia should try their hand at from time to time! The weather related causes of fresh food price increases triggered a memory of the RBA making various points about ‘looking through’ the influence of banana price growth on headline CPI following cyclones in 2006 and 2010. Here are a few examples I thought you might enjoy:
https://www.rba.gov.au/speeches/2006/sp-so-281106.html
https://www.rba.gov.au/speeches/2011/sp-ag-170211.html
“But looking at just the quarter results, we can see that housing is now a negative contributor as major government programs which pushed the boom are gone and interest rates are higher.”
I keep reading MMT guys saying that higher interest rates add to inflation, can someone please help?!
“I keep reading MMT guys saying that higher interest rates add to inflation, can someone please help?!”
I’m not qualified to answer but I would say that the central bank’s blunt tool approach of raising interest rates to contain inflation doesn’t just raise the cost of a homeowners mortgage payments, it can also increase the cost of business loans. Firms facing those higher costs likely attempt to recoup the cost by raising the price they charge for their goods and services, wherever they think they can successfully do so.
So raising interest rates in an attempt to dampen rising prices may for a time at least, simply spur further price rises.
What is (as far as I understand) about the most rapid interest rate hiking spree ever undertaken by the RBA in Australia seems to be having little effect at quashing inflation, as todays CPI shows.
And it’s hard to imagine why it would. The inflation continues to be largely in non-discretionary purchases – will people stop buying food or petrol or stop paying rent or electricity bills because interest rates are being hiked?
All the RBA seem to be succeeding in doing is making current cost-of-living pressures worse.
“I keep reading MMT guys saying that higher interest rates add to inflation, can someone please help?!”
Increasing the interest paid out to those holding Government debt is causing the Government to move extra money into the non-government sector. In the longer term this will inevitably be spent which will add to inflationary/reflationary pressures in the economy.
So there will only be a short term deflationary effect as the increased interest rates encourage some short term saving at the same time as pushing up the exchange rate which will reduce import prices.