Today (January 22, 2026), the Australian Bureau of Statistics (ABS) released the latest labour force…
NSW fails to control Covid (incompetence) and the labour market contracts sharply across the nation
There were two significant data releases from the Australian Bureau of Statistics this week that provide information about the state of the labour market – both in the short-term and also in terms of longer-term trends. The first release (September 8, 2021) – Labour Account Australia – June 2021 – is a quarterly dataset that allows us to tie together information about employment, persons, hours and payments. The second release today (September 9, 2021) is the – Weekly Payroll Jobs and Wages in Australia – Week ending August 14, 2021 – which is Australian Tax Office data that provides a much more current view of how the labour market is performing. That snapshot is especially valuable given the on-going tight lockdowns in Sydney and Melbourne and the impact they are having on employment and wages.
The Labour Account data – Worrying Signs
I last wrote about this special dataset in this blog post – New Labour Account framework in Australia provides new insights (July 12, 2018).
If you want to know what is special about the dataset then refer back to that blog post.
One of the important advances that this dataset allows is a focus on multiple job holdings.
Up until now the tendency is to consider employment in terms of persons employed. However, now we can divide total filled jobs (employment) into Main and Secondary jobs. This allows us to assess the quality of the change in overall employment.
We can thus work out how many persons are employed in more than one job and where those jobs are.
The ABS state that:
The Australian Labour Account provides a framework through which existing labour market data from different sources can be confronted and integrated, with the aim of producing a coherent and consistent set of aggregate labour market statistics.
The Australian Labour Account consists of four central quadrants of Jobs, Persons, Labour Volume and Labour Payments. Data in each table are available quarterly, and for the industry divisions defined in the Australian and New Zealand Standard Industry Classification (ANZSIC).
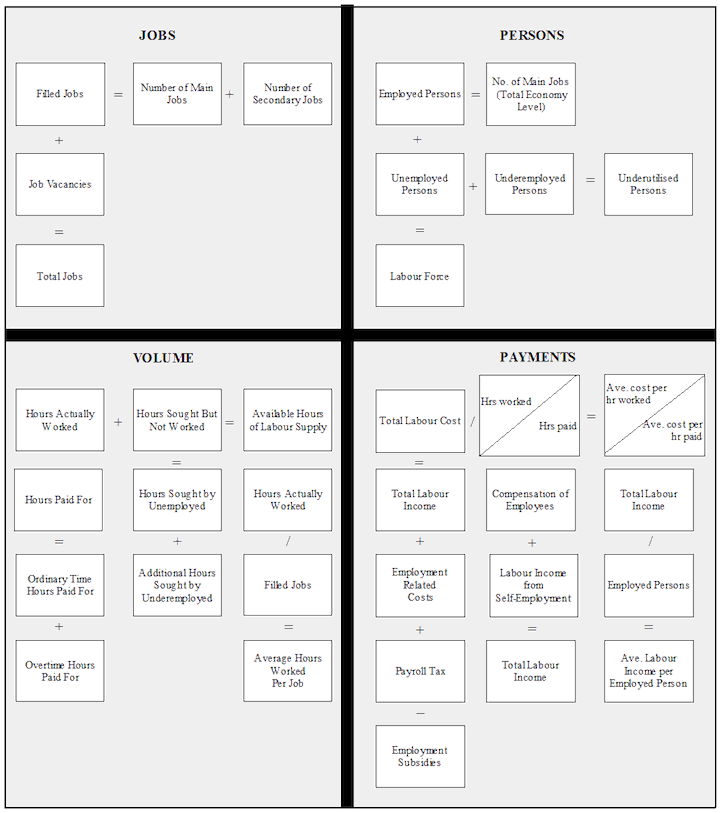
The following diagram is taken from the explanatory publication – Australian Labour Account: Concepts, Sources and Methods (released June 26, 2018).
The four quadrants are shown and you can appreciate how the data series corresponding to the conceptual boxes relate in an integrated additive way to derive labour market aggregates.
Each of the quadrants describes the identities that have to be satisfied.
For example, in the upper-left quadrant (Jobs) the framework tells us that:
Total Jobs = Filled Jobs + Job Vacancies.
Filled Jobs = Number of Main Jobs + Number of Secondary Jobs.
This allows us to estimate the extent to which people work more than one job – a major new development.
In the upper-right quadrant (Persons) we see that:
Employed Persons = No of Main Jobs (Total Economy Level)
So we see by relating the two quadrants, that if there are X Total Jobs and only Y (< X) Employed Persons, then the number of people who are working multiple jobs is consistently estimated.
The Labour Force framework, which is used to publish the monthly estimates we are familiar with, constructs employment estimates in terms of persons employed rather than directly estimating the number of jobs there are in the economy.
This can be quite misleading because we know that people sometimes work in more than one job – which the Jobs Quadrant in the diagram above recognises as the distinction between the Main job and the Secondary job, the two summing to total filled jobs.
For example, if the X Main jobs that have been created in the economy in net terms in a period are of such a quality that the people working in them have to work in secondary jobs to make ends meet, then that is quite a different outcome to one where the change in net filled jobs is predominately due to a net change in main jobs.
The labour market is not in good shape if there is relatively strong growth in employment being driven by workers being forced into working a second job to make ends meet.
That is a bad story when the aggregate result – relatively strong growth in employment – will always be made out by politicians to be a good story.
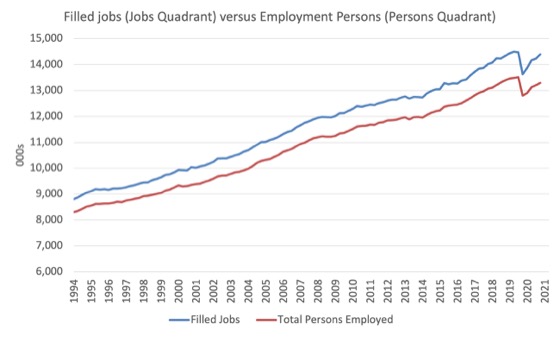
The first graph shows the total number of Filled Jobs (from the Jobs Quadrant) and the total number of Persons Employment (from the Persons Quadrant). The dataset published by the ABS so far runs from the September-quarter 1994 to the June-quarter 2021.
The gap between the two series is the total number of secondary jobs worked (by a person who also has a main job).
The next graph shows the proportion of secondary jobs to total jobs from the September-quarter 1994 to the June-quarter 2021.
Since the recovery from the GFC, that proportion has risen steadily with the pandemic interrupting the rise for a brief period.
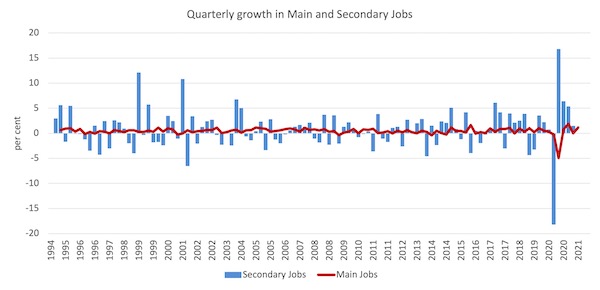
To see more clearly what has been going on since the September-quarter 1994, the next graph shows the quarterly growth in Main and Secondary jobs, using the Jobs Quadrant data identities.
By and large, the growth of total filled jobs is driven by the growth in Main Jobs (given that the latter accounts for around 93 per cent of the former).
But what the graph shows the growth of secondary jobs is highly variable, which makes sense in the context that most people will not choose to take on a second job if their main job is providing for their needs.
The following Table summarises the results by decade:
| Period | Average Qrtly Growth Filled Jobs (%) | Average Qrtly Growth Main Jobs (%) | Average Qrtly Growth Secondary Jobs (%) |
| 1994-1999 | 0.48 | 0.46 | 0.94 |
| 2000-2009 | 0.55 | 0.54 | 0.68 |
| 2010-2019 | 0.45 | 0.44 | 0.64 |
| 2020 on | -0.09 | -0.22 | 2.06 |
Overall, the data shows us that:
1. Over the entire period (1994-2021), Total Filled Jobs has grown by 63.5 per cent, Main Jobs by 60.4 per cent, and Secondary Jobs by 114.4 per cent.
2. The average quarterly growth in Total Filled Jobs and Main Jobs has slowed over the decades shown, while the average growth in Secondary Jobs has been higher.
3. In the pandemic recovery period (from the June-quarter 2020), 34.6 per cent of the change in Total Filled Jobs have come from Secondary Jobs, whereas the overall proportion of Secondary Jobs to Total Filled Jobs at the June-quarter 2021 was 7.5 per cent.
In other words, the recovery is skewed towards the lower-paid (typically) Secondary Jobs.
4. Over the last few years of the dataset, the rising proportion of persons working secondary jobs is clearly associated with the flat wages growth (and falling real wages in some quarters) and the rising underemployment.
5. Relative to the pre-pandemic period, Total Filled Jobs are 106.5 thousand below the December-quarter peak. This is comprised on a shortfall of 198.1 thousand Main Jobs being partially offset by Secondary Jobs being 91.6 thousand above the pre-pandemic level.
This means that more people are being forced into multiple job holdings to make ends meet.
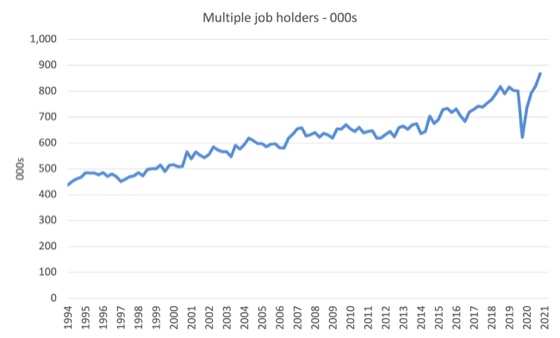
The next graph shows the rising number of multiple job holders in Australia since the September-quarter 1994. The number now stands at 867.9 thousand, which is 6.7 per cent of total employment.
These jobs are concentrated in the lower-paid sectors (hospitality, arts and recreation) but also in the previously more secure sectors like education and training.
The summary assessment is that the Australian labour market is increasingly moving towards insecure work, low-pay and a scarcity of good jobs. People are increasingly being forced to work multiple jobs to make ends meet.
Hardly a sign of a well-run economy.
The latest payroll data
The Monthly Labour Force survey comes out in the third week of each month and relates to data collected around the second week of the previous month.
So by the time it is published it is 5 weeks out of date.
At the outset of the pandemic, the ABS together with the Australian Tax Office compiled a more current dataset using the weekly payroll data submitted to the ATO.
It has been published on a fortnightly basis to now.
In terms of the coverage of the ATO Single Touch Payroll data, the ABS report that:
Approximately 99% of substantial employers (those with 20 or more employees) and 71% of small employers (19 or less employees) are currently reporting through Single Touch Payroll.
See links at the end of this blog post for my past analysis of ATO Payroll Data.
The least release published today (September 9, 2021) – Weekly Payroll Jobs and Wages in Australia – Week ending August 14, 2021 – gives us a better picture on what the impacts of the extended lockdowns in Sydney and Melbourne have been.
The story is not very encouraging.
Overall jobs recovery uncertain
The ABS – Press Release – notes that:
Payroll jobs fell by 0.7 per cent in the fortnight to 14 August 2021, compared to a fall of 1.8 per cent in the previous fortnight, …
The largest falls in payroll jobs in the first half of August were in New South Wales (down 1.2 per cent), Queensland (down 1.0 per cent), the Australian Capital Territory (down 0.7 per cent) and Victoria (down 0.6 per cent). …
Nationally, most industries saw a fall in payroll jobs in the first half of August. Among the largest employing industries, Accommodation and food services (down 4.4 per cent) and Wholesale trade (down 1.4 per cent) saw the greatest falls, whereas the largest increases were seen in Education and training (up 1.1 per cent) and Construction (up 0.6 per cent).
The impact thus was predictable.
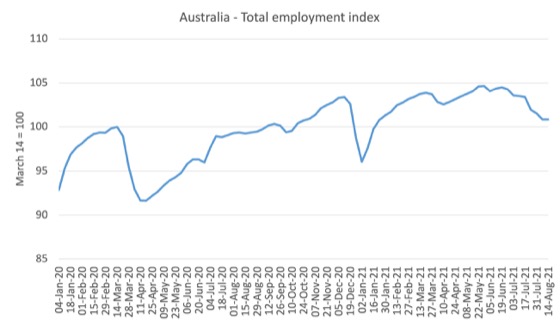
Here is what has happened to total employment in Australia since January 4, 2020 (the ATO data starts at the beginning of the year). The index is based at 100 on March 14, 2020 which appears to be around the peak employment, although it was slowing since February 29, 2020.
1. Overall, payroll employment is 0.8 per cent higher as at August 14, 2021 that it was on March 21, 2020. But in terms of the most recent peak (which was 4.6 per cent higher – on May 29, 2021), there has been a rapid deterioration in the next 11 weeks to August 14, 2021 – a fall of 3.6 per cent.
2. The first trough came in the week ending April 18, 2020 and the total employment loss was 8.5 per cent.
3. The second dip coincides with the extended Sydney lockdown before Xmas.
4. The third big dip that we are now witnessing coincides with the extended Sydney and Melbourne lockdowns now being endured.
Gender trends
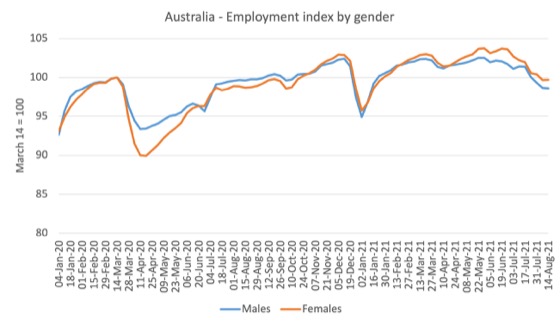
Here is the same series decomposed by gender.
While the pattern was almost identical for males and females up to March 22, 2020, the data for the earlier parts of April 2020 showed that the crisis was impacting disproportionately on females.
This bias was driven by the occupational segregation that has women dominating the sectors that were most impacted by the lockdown (accommodation, hospitality, cafes, etc)
As the lockdowns eased and businesses reopened, women started to gain jobs at a faster rate than men.
In terms of the decline since the most recent peak (May 29, 2021), male payroll employment has fallen by 3.8 per cent and female employment has dropped by 3.9 per cent.
So the ‘bias against females’ pattern that was evident in the big lockdown at the onset of the pandemic is repeating itself.
Wages fall by 1 per cent in 2 week period
Total wages paid decreased by 1 per cent in the fortnight between July 31, 2021 and August 14, 2021.
The previous fortnight, total wages decreased by 2.2 per cent.
Age breakdown of Job Loss
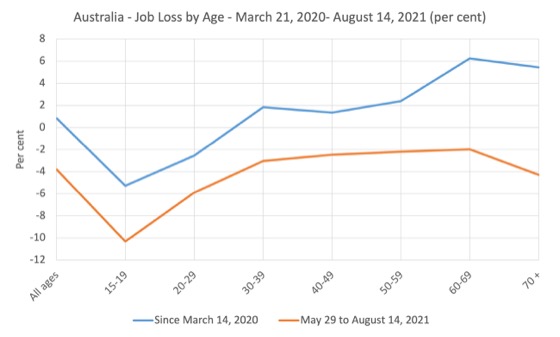
The age breakdowns for Australia as a whole are shown in the next graph.
The blue line shows the total history since March 14, 2020 (when the index = 100) to August 14, 2021 by age category. So you interpret the graph as being deviations from 100.
The orange line shows the period May 29, 2021 to August 14, 2021, which is from the previous peak to the current point and starts to capture the impact of the renewed lockdowns, particularly the now extended Sydney and Melbourne restrictions. So you interpret this line as being deviations from the May 29, 2021 peak.
Overall, it is the youth 15-29 age group that has worst borne the brunt of the pandemic so far in terms of employment.
This is largely due to the industrial composition of the job losses – services, accommodation etc.
But the current extended lockdowns are now eating in the employment of all groups, with the severity being endured at both ends of the age distribution.
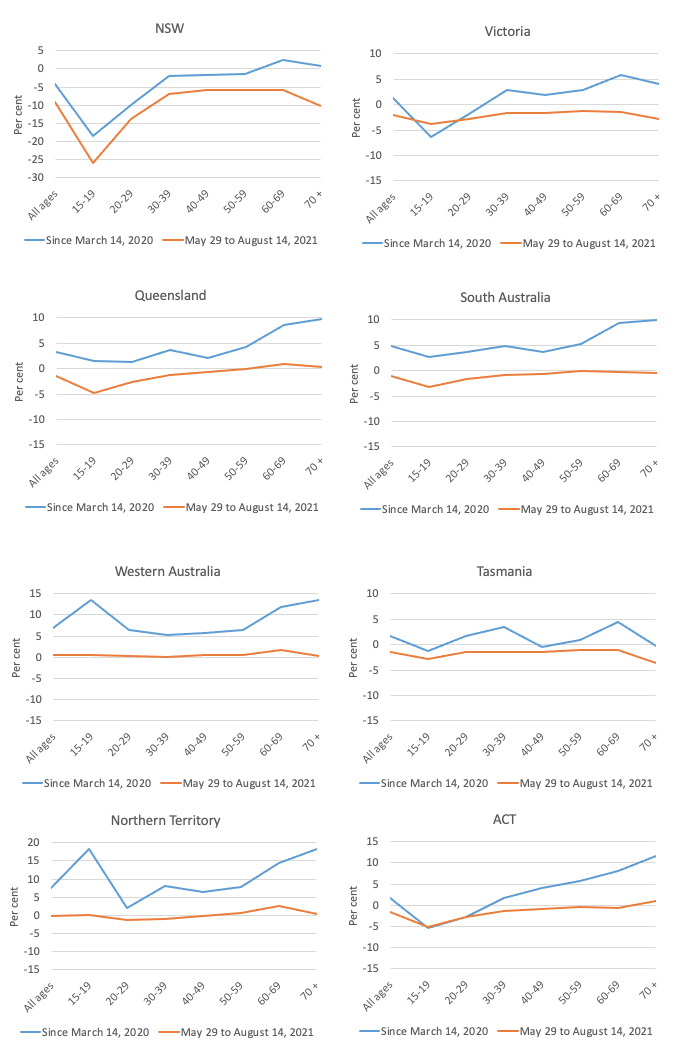
The following sequence of graphs gives the age profiles of the job loss for each State/Territory.
The patterns are similar across all jurisdictions except that in Victoria, the short-sharp lockdowns in recent weeks has not yet damaged the youth cohorts.
You can also see that the current restrictions in NSW are having much more significant negative effects on employment across the age groups, particularly the young and old, than in other states/territories.
Teenage employment in NSW has fallen by more than 25 per cent since the end of May. That is devastating.
State and Territory job loss breakdown
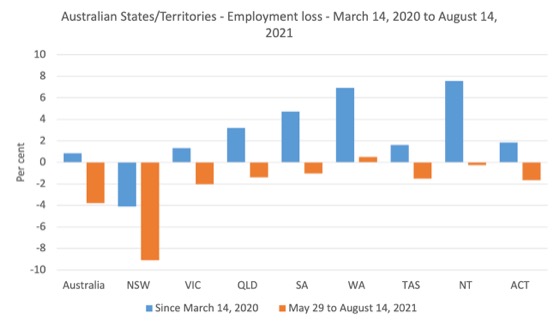
The following graph shows the employment losses from March 14, 2020 to August 14, 2021 for the States and Territories (blue bars), while the orange bars shows what has happened between May 29, 2021 and August 14, 2021.
NSW overall, the largest state in Australia has experienced negative employment growth over the entire period (-4.1 per cent) and a massive contraction of 9.1 per cent decline in the period between May 29, 2021 and August 14, 2021, which covers some of the most recent lockdown.
Victoria, which had a 110-day harsh lockdown last year (much harsher than the current NSW lockdown) has overall added jobs over the pandemic (up 1.3 per cent) but in the recent period has contracted by 2.0 per cent as a result of its renewed lockdown.
The Victorian figures will worsen in the next release.
The other states are also enduring collateral damage from the Sydney outbreak with varying levels of restrictions being imposed.
The data suggests that it was foolish of the NSW government not to follow the short/sharp lockdown approach used by the other states/territories, which appear to be significantly less damaging and are more successful in bringing the outbreak under control.
The NSW government has now given up bringing the infections down and is instead pinning its hopes on a high vaccination rate. Good luck with that.
Australia is now being governed (at federal level and at the NSW state level) by incompetent governments who are intent on opening up as soon as possible irrespective of the level of infections.
Neoliberal ideology rules as increasing numbers are dying.
Conclusion
The two labour data releases in the last two days provide deep insights into both the short-term malaise being experienced by workers in Australia and the long-term trends towards multiple job holding and precarious work.
In the short-term, the labour market is once again contracting, largely because of the errors the NSW government made in controlling the latest outbreak, which was a breach of quarantine.
They have failed to curb mobility and the infection rate is spreading into the regions.
They reluctantly imposed a lockdown but it was too late.
It will now be an extended contraction while we wait for the vaccination rate to rise.
Relevant blog posts as I trace this data trail over time are:
1. “We need the state to bail out the entire nation” (March 26, 2020).
2. The government should pay the workers 100 per cent, not rely on wage subsidies (March 30, 2020).
3. A Job Guarantee would require $A26.5 billion net to reduce the unemployment rate by 6 percentage points (April 30, 2020).
4. Latest employment data for Australia exposes Federal government’s wilful neglect (May 5, 2020).
5. The job losses continue in Australia but at a slower pace (May 19, 2020).
6. Worst is over for Australian workers but a long tail of woe is likely due to policy failure (June 16, 2020).
7. Latest Australian payroll data suggests employment damage from shutdown is worse than thought (July 20, 2020).
8. Australia’s job recovery stalling and soon to head south again (August 12, 2020).
9. Payroll employment falling again as second-wave and inadequate policy response bites (August 25, 2020).
10. Federal government cutting spending as payroll data shows employment still in decline (September 10, 2020).
11. Latest employment data in Australia continues sorry tale and what I would do about it (September 24, 2020).
12. Australian labour market continues to go backwards as government sits idly by (October 20, 2020).
13. Australian labour market struggling with significant sectoral disparities (May 11, 2021).
14. The ideology of neoliberal ‘freedom’ ends up damaging all of us – NSW Covid outbreak (August 10, 2021).
That is enough for today!
(c) Copyright 2021 William Mitchell. All Rights Reserved.

With a husband that works in health care, I am aware of only one metric that determines the rate of re-opening: the capacity of our hospitals to deal with the case load. But we never seem to hear politicians talk in these terms, because it might focus on something the neoliberals don’t want to talk about: increasing public spending on healthcare.
I know for a fact that some furloughed airline staff have been re-employed in support roles in the health system, and very little training was required for this. So, along the lines of a job guarantee type program, governments could easily set up a program to redeploy un-utilised people to support the health system. This would be in all the support roles like cleaning, maintenance, admin, etc., and with a little more training many people could fill basic care roles also.
That is a positive government action that I would like to see, that would support a more rapid re-opening. But it won’t happen. What *will* happen is when the health system inevitably crumbles the neoliberals will blame the rest of us for excessively socialising. Because there is no such thing as society!
The evidence is now indicating that the virus has already become endemic in many places and likely will be everywhere in future.
Current opinion among some leading experts in this field is that he vaccines, while quite safe, did not prove effective enough to develop “herd immunity”, and this means it’s inevitable that over the next few years everyone will be exposed to some form of covid-19 at some point, no matter what measures are taken to prevent that.
The main benefits from the vaccines in the shorter term then are; they do greatly lessen or in some cases eliminate the possibility of illness, for those who are “fully vaccinated” prior to contact with the wild virus, and post vaccination exposure then only further builds and fine tunes the immune response.
Regions with mostly fully vaccinated people are soon likely to become able to avoid further lock down measures, while coping with an additional circulating cold or flu like illness, that doesn’t overwhelm health care resources.
An un vaccinated population without a five star health care system is a population in great peril, and one that will probably lag other regions in economic recovery.
A prerequisite for sound leadership is the possession of the ability to make decisions in a constantly evolving battlefield which maximize the probability of the best outcomes occurring.
Governments who failed to take full advantage of vaccine availability early on deserve more than a time out wearing a dunce cap.
J Christensen envisions a likely scenario of chronic covid, which would easily be worsened by new, more virulent strains of the virus coupled with increasing political resistance in many nations to the resumption of lockdown measures and other aggressive governmental responses. How could a pedal-to-the-metal global neoliberal economy possibly operate under such long-term circumstances? So where, among MMT economists (present company excepted), does one find the unflinching anticipation of this likely scenario, projected analyses of it, practical guidance for weathering it, and bold proposals for using it move structurally from neoliberalism to a less ecocidal, more humane economic system? It seems to me we desperately need a post-covid “Reclaiming the State,” and maybe Bill and Tom will oblige us.
@J Christensen:
I would be interested in your sources here, seems clear to me that the vaccines are about hazard management rather than hazard elimination, but this issue is being elided in most media sources.
It is almost as if we are being gaslighted into a world of frequent booster shots for the wealthy and constant hazard for the rest.
The COVID-19 incompetence of Berejiklian and Morrison threatens us all in Australia.
Brendanm,
We are, but here’s little scientific reason for it. Papers like https://pubmed.ncbi.nlm.nih.gov/34126625/ (discussed on TWIV 796, but that podcast is way too long to listen all the time) have been showing infection+vaccine confers very broad immunity, as the protection keeps evolving. I don’t know if there’s anything on vaccine+infection, but it probably offers similar super protection.
And of course they aren’t infection neutralizing, very few vaccines are, and this damned bug starts replicating before entering the blood to boot,. We can’t keep antibodies against everything around, but the body remembers. Boosters should be investigated, but for the general non-immunocompromised public there’s no reason to care for now (again, per TWIV).
“Current opinion among some leading experts in this field is that he vaccines, while quite safe, did not prove effective enough to develop “herd immunity””
The vaccines were never expected to be sterilising. The most they do is reduce the symptoms of the disease to those “enjoyed” by the average 30 year old. Anything else would be a bonus.
The best sterilising ‘vaccine’ we have is to catch the disease about three weeks after being fully vaccinated.
And right on cue we have John Roskam of the Institute for Public Affairs arguing with transparent hypocrisy in today’s Australian Financial Review that as unemployment has negative effects on life expectancy we should be “opening up”.
I won’t hold my breath waiting for the IPA to take this kind of thinking a bit further and declare a preference for fiscal policy over monetary policy in the pursuit of full employment, abandoning flawed Nairu dogma, or advocating for a Job Guarantee, all of which would also save lives.
There are three aspects to the current pandemic which we need to unpack. These aspects have to do with time, exponential growth and endemism (from “endemic”).
When highly inimical things or processes have the potential to grow exponentially then they have to be “nipped in the bud”. This is true of a skin cancer. It has to be excised promptly or it will spread and possibly metastasize. The progress of this pandemic is of a somewhat like nature. If it had been excised early by eradication it would not have virally spread and mutated all over the world.
The intial, huge mistake made by the rich, neoliberal nations in particular was to let the disease spread in the first place. It was eminently predictable that letting this disease spread would be a disaster. The susceptibility of modern, interconnected global civilization to a pandemic has been analyzed over and over again since at least the 1960s or 1970s.
Scientists have long been worried about another flu pandemic of the size and scope of the 1918 Flu Pandemic. This is well and truly on the record. They were also concerned about the appearances of emergent novel zoonotic diseases which accelerated in the 1980s, 1990s and 2000s. The book “The Coming Plague : Newly Emerging Diseases in a World out of Balance” – by Laurie Garret, published in 1994, provided ample warning. The neoliberal capitalist system ignored all the warnings and here we are.
On the scientific side it was also predictable, to a high degree of certainty, that the new virus being already contagious by aerosol or at least droplet dispersion, and being a mutable RNA virus, would likely rapidly evolve into more contagious and more virulent variants. Really, the odds were London to a brick for this, so why weren’t we told the truth from the start that these were real possibilities?
Instead, the public was faced with a snow job of myths about “herd immunity”, “flattening the curve” and “living with the virus”. Why was the public not told the truth about these real, quite probable and highly dangerous possibilities? Instead we regaled with what were going to be myths with respect to an RNA coronavirus. “Herd immunity”, “flattening the curve” and “living with the virus” were all going to prove to be dreadful myths with respect to this disease. As a layperson, it took me several months of research to fully appreciate what dangerous myths such cliches were in respect of the pathogen in question. However, the most advanced virologists and epidemiologists already knew the dangers were high and that these cliches were, to a high degree of certainty, very likely to be proven myths. Why were the scientists not listened to? Why did the myths get airplay and the advanced science not? The answer is easy in a basic sense: neoliberal capitalism.
@Iconoclast,
Very well said.
I would add that —
Neo-liberal econ. is also to blame for the healthcare systems not being ready to handle a pandemic. We needed infectious disease hospitals that were 90% empty (with trained staff ready to move from their day jobs), we needed store houses of masks and PPE, etc., and a reserve of trained nurses and doctors (maybe working 27 hrs. a week {9 hrs./day x 3 days/week} for full pay).
But, this was not profitable or efficient. So, no nation was ready.
Ikon and Steve: You guys nailed it. The underlying pandemic, the mother of all them all, is the contagion of neoliberal capitalism, which is merely good old fashioned capitalism allowed to develop virtually unimpeded in its natural trajectory. As you both know, Bill and Tom laid this out beautifully in “Reclaiming the State”–a must-read if there ever was one. Because I have concluded, despite myself, that neoliberal capitalism has succeeded beyond its wildest dreams in debasing not only the planet but the people themselves, rendering any sort of political revolution a pipe dream, I have only one remaining question: Will Covid wind up destabilizing the neoliberal world order to the point where it expires, creating the space for something new to emerge in what will likely be a painful and protracted interregnum? If either of you are aware of any thinkers publicly exploring this question, please let me know. Bill’s blog can’t be the only place where this stuff is being intelligently shot around, but all I can find is utter dystopia or mindless denial (of Covid itself or its likely consequences).
First a reply to Newton E. Finn. You can try three economics blogs I know of:
John Quiggin – Left and Keynesian-ish as a blog.
RWER Blog – A real mix of heterodox economics.
Capital as Power – Site with Books, Articles and Blog by Capital as Power (CasP) theorists. Takes some Marxian and Veblenian perspectives but also develops a new theory that cuts the Gordian knot of classical value theory.
For Political Economy try:
The Monthly Review – Marxist to Marxian.
Anything by Prof. Richard D. Wollf, Marxian. He blogs, writes, speaks.
On COVID-19.
Finally, ATAGI and some state governments have seen reason on permitting the Pfizer vaccination choice for over 60s. It started with the NT flagging permission, then W.A., S.A. and now Qld. This became possible when the Pfizer scarcity bottleneck, created by an incompetent Federal Govt., was finally overcome.
“From this weekend, the Pfizer jab will also become available (in Qld.) for those over the age of 60, following similar moves in other states.
“They’ve said to me loud and clear they want to have a choice of vaccines, and I say let’s give it to them,” the Premier said.
“We are able to do this because the supply is finally coming in. Now that everyone form the age of 12 is eligible, I want to see generations of families turning up to get vaccinated.”” – myGC.
There are medically valid reasons why some over 60s will be safer with Pfizer. These extend beyond those conditions listed in the initial ATAGI advice. Finally, the intransigent administrators and governments are caching up with the medical complexities and diversity of conditions people face. It’s about time.