Over the last several years, I have been indicating that I think we are in…
Australian labour market struggling with significant sectoral disparities
Tonight, the Federal Treasurer releases the annual ‘fiscal statement’ (aka ‘The Budget’) and we already know that the Government is now in a period of fiscal contraction despite all the big expenditure numbers being touted in the press. I will write more about that tomorrow. But it is now 6 weeks since the Government abandoned the JobKeeper wage subsidy program and today’s ABS release of the – Weekly Payroll Jobs and Wages in Australia, Week ending 24 April 2021 – might give us some guidance as to the impact of the fiscal withdrawal in terms of job loss. The problem though is that the period in question was also a school holiday period, which confounds things somewhat. Suffice to say that the labour market is definitely not booming. It has gone backwards since the end of March but how much of that is due to the withdrawal of the wage subsidy is difficult to say at this stage. Some sectors are still enduring major job losses with Accommodation and hospitality sector 10.3 points below its March 14, 2020 employment level. Manufacturing is still 2.1 points down, Transport, postal & warehousing is down 6.8 points, and Information media & telecommunications is down 6.7 points. The sectors that have gained the most employment are Electricity, gas, water & waste services (up 3.3 points), Financial & insurance services (up 7.7 per cent), Public Administration (up 10.4 per cent) and Health care & social assistance up 4.9 per cent. Anyway, I have been using my spare time to get up to speed on all the various data trends so I can better understand what tonight’s statement is likely to do.
Past analysis of ATO Payroll Data
Relevant blog posts as I trace this data trail over time are:
1. “We need the state to bail out the entire nation” (March 26, 2020).
2. The government should pay the workers 100 per cent, not rely on wage subsidies (March 30, 2020).
3. A Job Guarantee would require $A26.5 billion net to reduce the unemployment rate by 6 percentage points (April 30, 2020).
4. Latest employment data for Australia exposes Federal government’s wilful neglect (May 5, 2020).
5. The job losses continue in Australia but at a slower pace (May 19, 2020).
6. Worst is over for Australian workers but a long tail of woe is likely due to policy failure (June 16, 2020).
7. Latest Australian payroll data suggests employment damage from shutdown is worse than thought (July 20, 2020).
8. Australia’s job recovery stalling and soon to head south again (August 12, 2020).
9. Payroll employment falling again as second-wave and inadequate policy response bites (August 25, 2020).
10. Federal government cutting spending as payroll data shows employment still in decline (September 10, 2020).
11. Latest employment data in Australia continues sorry tale and what I would do about it (September 24, 2020).
12. Australian labour market continues to go backwards as government sits idly by (October 20, 2020).
In terms of the coverage of the ATO Single Touch Payroll data, the ABS report that:
Approximately 99% of substantial employers (those with 20 or more employees) and 71% of small employers (19 or less employees) are currently reporting through Single Touch Payroll.
Overall jobs recovery uncertain
The ABS – Press Release – notes that:
Payroll jobs rose by 0.4 per cent in the fortnight to 24 April 2021, following a 1.6 per cent fall in the previous fortnight …
… Seasonality around Easter in the previous fortnight makes it difficult to gauge any effect of the end of the JobKeeper wage subsidy on 28 March. The latest fortnight of payroll jobs data continues to show some of the seasonality around school holidays …
… In the latest fortnight of data, payroll jobs were above pre-pandemic levels in every state and territory.
So we cannot be definitive yet.
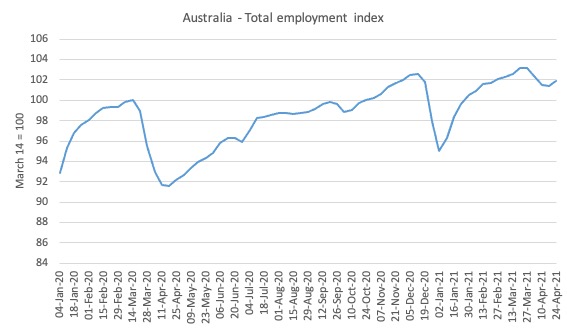
Here is what has happened to total employment in Australia since January 4, 2020 (the ATO data starts at the beginning of the year). The index is based at 100 on March 14, 2020 which appears to be around the peak employment, although it was slowing since February 29, 2020.
1. Overall, there has been a 4.1 per cent contraction between March 21, 2020 and October 3, 2020. The first trough came in the week ending April 18, 2020 and the total employment loss was 8.5 per cent.
2. The second dip coincides with the extended Sydney lockdown before Xmas.
3. However, since the end of JobKeeper, employment has fallen and then in the last two weeks shown some recovery.
4. Once the school holiday effect leaves the data, we will get a clearer picture.
Gender trends
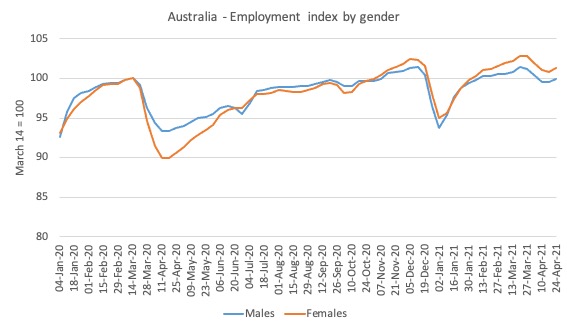
Here is the same series decomposed by gender.
While the pattern was almost identical for males and females up to March 22, 2020, the data for the earlier parts of April showed that the crisis was impacting disproportionately on females.
This bias was driven by the occupational segregation that has women dominating the sectors that were most impacted by the lockdown (accommodation, hospitality, cafes, etc)
As the lockdowns eased and businesses reopened, women started to gain jobs at a faster rate than men.
Wages paid begin to rise
The ABS report that between March 14, 2020 and April 24, 2021, total wages increased by 2.8 per cent.
In the fortnight to April 24, 2021, total wages paid rose by 0.3 per cent.
However, since the end of March, total wages paid fell by 2.7 per cent. How much of that is the school holiday’s seasonality is yet to be determined.
Comparison with prior cycles
As the lockdowns eased, the question was now how quickly the jobs would recover and how many businesses had been lost altogether. The persistence of the unemployment will be dependent on the number of businesses that failed.
The question now, as the situation declines again, is what the hell is the federal government doing about this disaster?
The answer to that question is nothing significant other than try to play politics.
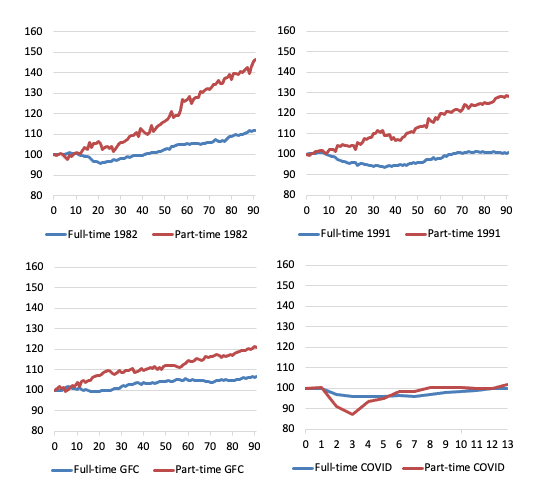
Which then brings us to the following butterfly graphs, which are constructed from ABS Labour Force data. They demonstrate why more fiscal stimulus aimed at job creation is required.
They show for full-time and part-time employment indexes set at 100 for the peak in total employment in the downturns for 1982, 1991, GFC and now the COVID-19 cycles.
For the first three events, they show the trajectory for 90 months after the peak, capturing the dynamics of the cycle.
The pattern in a usual downturn are demonstrated in the first three episodes – even as full-time employment declines as the recession bites, part-time employment continues to grow for a while, until it becomes obvious that the recession is deepening.
At the peak before the 1982 recession, the ratio of part-time to total employment was 16.2 per cent. By the time, full-time employment had reached the peak level again (after 41 months following the peak), the ratio was 17.6 per cent (and rising).
The 1991 recession was particularly bad and there was a major shift away from full-time work. At the peak before the 1991 recession, the ratio of part-time to total employment was 21 per cent. By the time, full-time employment had reached the peak level again (after 65 months following the peak), the ratio was 22.3 per cent (and continuing to rise).
The GFC event was reduced in intensity by the substantial fiscal stimulus that the Federal government introduced. But the part-time ratio still rose and full-time employment took 23 months to return to its pre-GFC peak. The part-time to total ratio in February 2008 (peak before the downturn) was 28.3 JobKeeper cent. After 23 months, the ratio had risen to 30.1 per cent.
While the ratio is rising on a trend basis as the labour market is increasingly casualised and job protections are wound back under the aegis of government policy designed to tilt the playing field towards the employers, there is an acceleration in the ratio during recessions when employers scrap full-time work and replace it in the recovery with part-time, fractionalised and insecure work.
The COVID episode is different given the nature of the job loss – lockdowns – which have directly impacted on the sectors where part-time work dominate.
But it is clear from the observations we have (lower-right panel) from the peak in February 2020 until March 2020, that as the lockdowns were eased, part-time employment rebounded somewhat but full-time employment has struggled
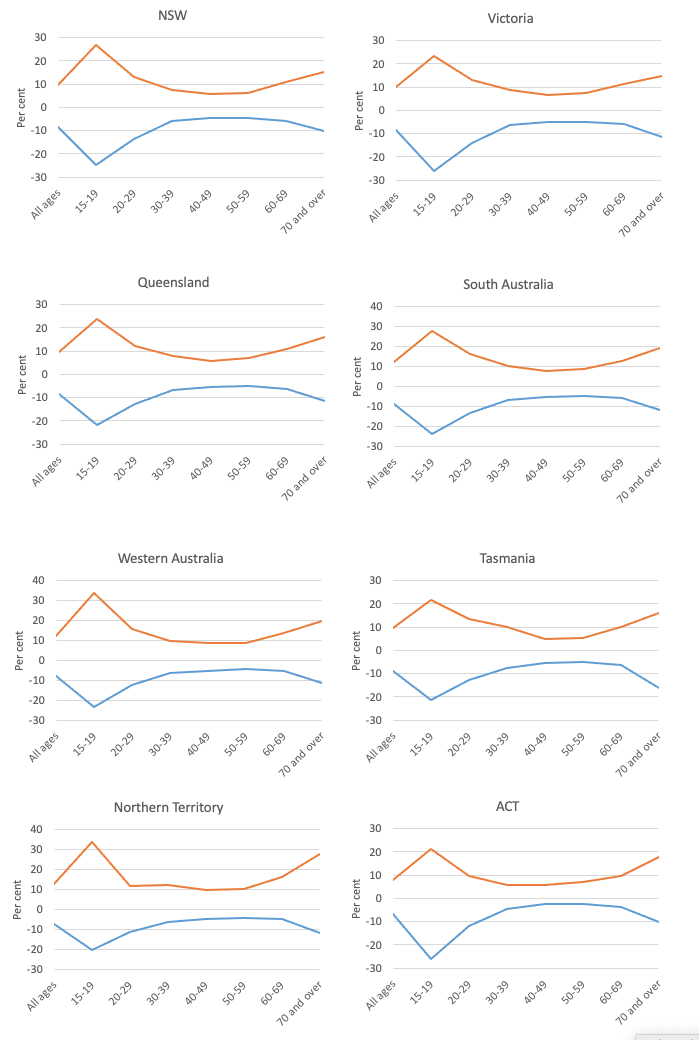
Age breakdown of Job Loss
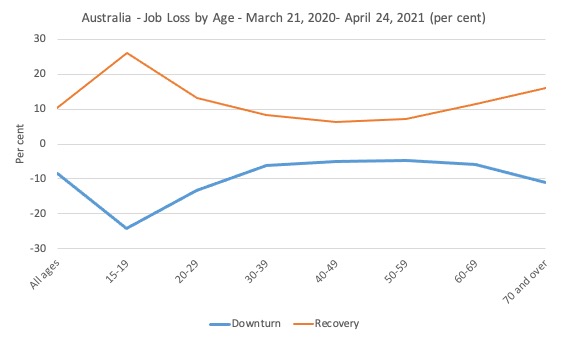
The age breakdowns for Australia as a whole are shown in the next graph.
The two lines show the job loss period (First wave downturn, March 22 to April 18) and then the recovery period since (which came in spurts).
It is clear that the youth bore the brunt of the First wave downturn, largely due to the industrial composition of the job losses – services, accommodation etc.
Older workers also endured greater job losses.
The loss for 15-19 year olds was 24.1 per cent and in the recovery period, employment has grown by 26 per cent. Older workers have also more than regained the jobs lost.
The following sequence of graphs gives the age profiles of the job loss for each State/Territory.
The patterns are similar across all jurisdictions.
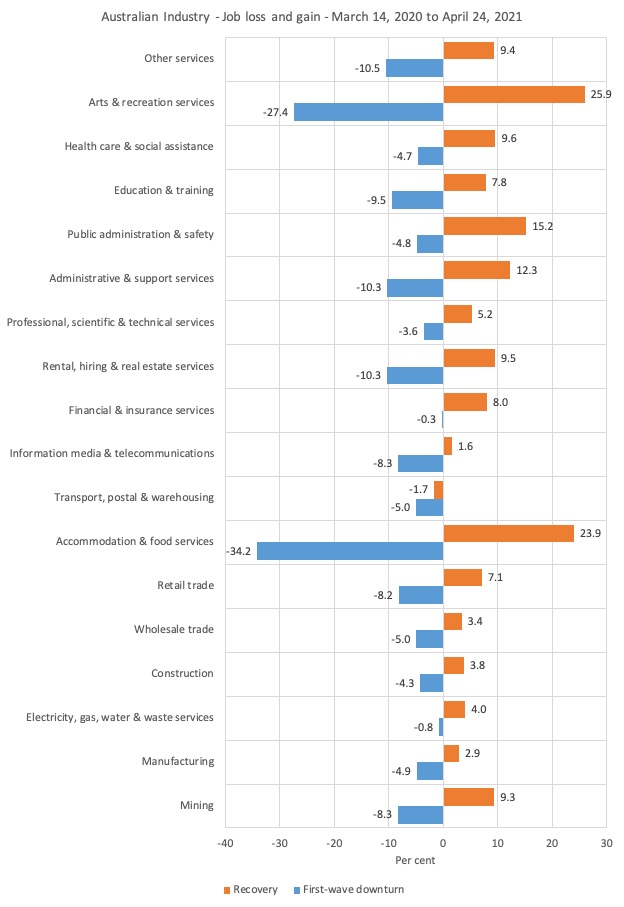
Industry job loss breakdown
The following graph shows the percentage decline in employment between March 21, 2020 and April 18, 2020 for the Australian industry sectors (First-wave downturn) and the recovery period since.
The turning points are based on the overall industry aggregate behaviour.
The worst hit sectors were Accommodation & food services (decline of 34.2 per cent) and Arts & recreation services (decline of 27.4 per cent).
After the restrictions were gradually eased (with occasional backflips as positive COVID cases are detected), the Accommodation and food services sector improved but has clearly not fully recovered yet only increasing employment by 23.9 per cent.
The Arts and recreation services sector recovered by 25.9 per cent as theatres and music venues have reopened.
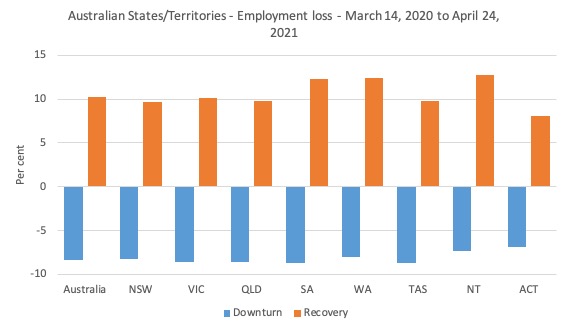
State job loss and recovery breakdown
The following graph shows the employment losses from March 14, 2020 to April 18, 2020 for the States and Territories (blue bars), while the orange bars shows what has happened since.
The smaller states had the worst employment losses but have made the strongest recovery.
The states with the toughest lockdowns have also done the best in the recovery.
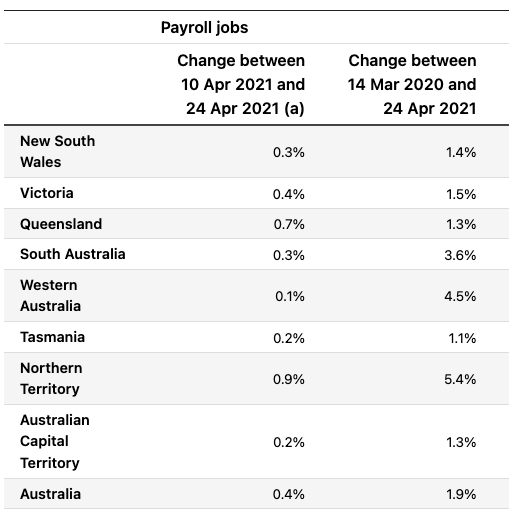
This table comes from the ABS:
Conclusion
The labour market is around where it was a year ago with some notable exceptions in the Accommodation and hospitality sector.
That sector is still 10.3 points below its March 14, 2020 employment level.
Manufacturing is still 2.1 points down, Transport, postal & warehousing is down 6.8 points, and Information media & telecommunications is down 6.7 points.
The sectors that have gained the most employment are Electricity, gas, water & waste services (up 3.3 points), Financial & insurance services (up 7.7 per cent), Public Administration (up 10.4 per cent) and Health care & social assistance up 4.9 per cent.
That is enough for today!
(c) Copyright 2021 William Mitchell. All Rights Reserved.
Looks like a significant fall in employment coming immediately of the heels of the ending of Jobkeeper, but then a bottoming and a small rise at the end of the data. More time is obviously needed to get a clearer picture.
Former ALP senator John Black has spoken the unspeakable on ABC radio program “Drive”, arguing that high levels of immigration have been used to help suppress wage growth and employment and now that it has been cut off, certain sectors that relied heavily on using it in place of local workers are struggling to come to terms with the concept of offering higher pay in order to attract staff.
The interviewers assertion that “when JobKeeper came to an end, there was no increase in the unemployment rate” is obviously a little premature since we don’t yet have the full labour force figures for the time since Jobkeeper ended and the data in Bill’s article shows there was an initial fall. Nonetheless it is interesting. From the interview………
“Interviewer: “Is it correct that Australia’s economic growth has majorly come from immigration rather than internal productivity improvement”?
John Black: “There’s no doubt that the majority of the growth, which is termed often by economists as ‘lazy growth’, has been from migration. It’s increased the size of the economy, but hasn’t increased the per capita income. So people see the economy getting bigger, but they don’t feel like they are better off”.
Interviewer: “You write that about three quarters of Australia’s lazy economic growth has been boosted by universities. Normally, what would they be doing?”
John Black: “As Peter Costello, the former Liberal Treasurer observed, a very large number of universities across Australia were in effect soft selling visas. They were selling citizenship to Australia in exchange for students coming from overseas and studying at their institutions. And what that meant was that as soon as the borders were closed, many of these students had to leave and many who scheduled to come in couldn’t do so. That was driving a lot of employment in the labour market… At one stage we had up to 700,000 of them in Australia, these international students, in the period leading up to COVID. So, you turn that tap off, it just cut the lion’s share of annual jobs growth out of the labour market”…
“What it means is that instead of being able to rely on a source of relatively cheap labour from international students, the employers that want cheap labour… they all of a sudden have run out. So, that means you have got to rely on people that are nominally retired, or people that are unemployed, or spouses of people that are full-time employees… So, it’s a lot harder to drag those into the labour market because they tend to want inconvenient things, like decent wages.”
“Employers in hospitality and the rural sector have been getting it very easy for a long time”.
Interviewer: “Does this explain why when JobKeeper came to an end, there was no increase in the unemployment rate?…”
John Black: “Well that’s because there is no longer a source of, in many instances, relatively cheaper labour. That’s simply gone”…
Interviewer: “For the last 12 months, many of my listeners… fruit pickers, farm, hospitality companies, restaurants and cafes, have been complaining they can’t get employees”.
John Black: “Well I’ve got a tip for them. As an old union official, offering them more money never hurt. Give me a break. If you’ve had an easy run for a long time [via foreign workers], having to pay what you used to pay before this easy run occurred is going to be inconvenient. It’s going to put the price up”.
“Don’t forget, the best union official we’ve got in Australia now is the Reserve Bank, who have been arguing for higher wage inflation for quite some time…. We are now going to start to see a few of them”.
Interviewer: “This means wages are going to go up over the next 12 months?…”
John Black: “Well mate, if you suck a quarter of a million workers in a year out of the potential labour supply, you are going to see that, yes. You are going to see wages go up”.
Interviewer: “Halleluiah. This is good news for workers, isn’t it?”
John Black: “Well yeah. But not so for your [employer] listeners that you mentioned earlier”…
We will see how things pan out and how easy it is to disentangle this effect from others in order to judge it’s proportional importance. https://www.abc.net.au/radio/brisbane/programs/drive/why-wages-could-rise/13337954
I was perplexed as to why there was a dip in the job numbers in the “Australia – Total Employment Index” for the Sydney lockdown but none for the longer Melbourne lockdown. My son (recent UQ PPE graduate) hit on the possible answer immediately. The Melbourne lockdown occurred during the initial Jobkeeper period when more businesses had access to the scheme. Your graph seems to point to a successful relationship between Jobkeeper and job retention during economic disruption. I am somewhat disappointed that the subsidy didn’t morph into a “Business Disaster Relief” program that could be applied in areas affected by bushfire, cyclones and floods where there has been a downturn in income but the business may not be able to get insurance cover.
In an article in ‘Crikey’ today, Professor Richard Holden writes:
“Treasury boss Steven Kennedy – a trained nurse who holds a PhD in economics – has helped usher in a budget prioritising jobs and economic growth, not debt and deficit’.
Holden’s thesis: it was Kennedy who helped Frydenberg convince Morrison to ditch Abbot’s ‘ALP debt and deficit disaster’ narrative. and create job keeper/seeker in April 2020.
I replied to Holden, asking if he would go the next step and support Kennedy to recommend a Job Guarantee in Australia….