Today (January 22, 2026), the Australian Bureau of Statistics (ABS) released the latest labour force…
Australian labour market – recovery over and more fiscal stimulus is needed
The latest data from the Australian Bureau of Statistics – Labour Force, Australia, October 2020 – released today (October 15, 2020) shows that the recovery has stalled on the back of the Stage 4 restrictions in Victoria as that state dealt with the second virus wave. However, Tasmania and the Northern Territory also experienced employment losses in September 2020 and that is in part due to the locked internal borders that remain throughout Australia. Employment growth declined by 29.5 thousand but the rise in unemployment was only 11.3 thousand because the participation rate fell by 0.1 points. So, hidden unemployment rose (the slack sitting outside the official labour force). If we take a broader view of the labour underutilisation rate, underemployment rose by 0.1 points to 11.3 per cent and combined with the uneployment rate, the broad labour underutilisation rate rose by 0.2 points to 18.3 per cent. If we add in the rise in hidden unemployment then that figure rises to 20.3 per cent. Any government that oversees that sort of disaster has failed in their basic responsibilities to society. It must increase its fiscal stimulus and target it towards large-scale job creation.
The summary ABS Labour Force (seasonally adjusted) estimates for September 2020 are:
- Employment decreased 29,500 (-0.2 per cent) – Full-time employment decreased 20,100 and part-time employment decreased 9,400.
- Unemployment increased 11,300 to 937,400 persons.
- The official unemployment rate increased 0.1 points to 6.9 per cent.
- The participation rate decreased by 0.1 points to 64.8 per cent.
- Aggregate monthly hours worked increased 8.7 million hours (0.5 per cent).
- Underemployment increased by 0.1 points to 11.3 per cent, a rise of 11.8 thousand. Overall there are 1,536.8 thousand underemployed workers. The total labour underutilisation rate (unemployment plus underemployment) increased by 0.2 points to 18.3 per cent. There were a total of 2,474.3 thousand workers either unemployed or underemployed.
Employment decreased 29,500 in September 2020
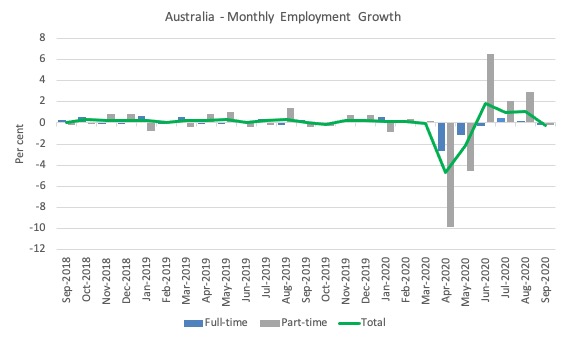
1. Employment growth was negative 0.2 cent.
Since March it has now fallen by 425.1 thousand (-3.3 per cent).
2. Full-time employment decreased 20,100 and part-time employment decreased 9,400.
The following graph shows the month by month growth in full-time (blue columns), part-time (grey columns) and total employment (green line) for the 24 months to September 2020 using seasonally adjusted data.
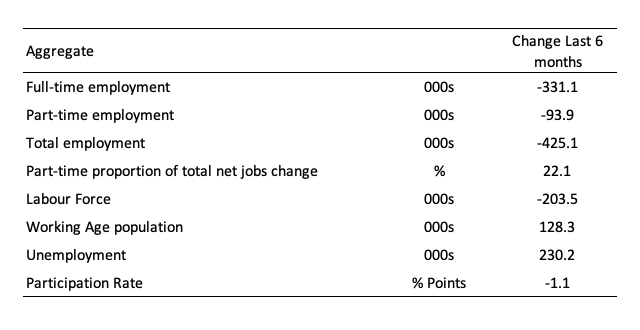
The following table provides an accounting summary of the labour market performance over the last six months.
As the monthly data is highly variable, this Table provides a longer view which allows for a better assessment of the trends.
Assessment:
1. Both the demand- and supply-side have contracted for the same reason – a collapse of employment opportunities. The labour force reduction is less severe than the employment fall, which is why official unemployment has risen.
2. Total employment has fallen by 425.1 thousand and full-time employment losses have dominated. That is a major worry.
3. While official unemployment has risen by 230.2 thousand, hidden unemployment has risen substantially given the labour force has shrunk by 203.5 thousand on the back of a 1.1 points drop in participation.
Given the variation in the labour force estimates, it is sometimes useful to examine the Employment-to-Population ratio (%) because the underlying population estimates (denominator) are less cyclical and subject to variation than the labour force estimates. This is an alternative measure of the robustness of activity to the unemployment rate, which is sensitive to those labour force swings.
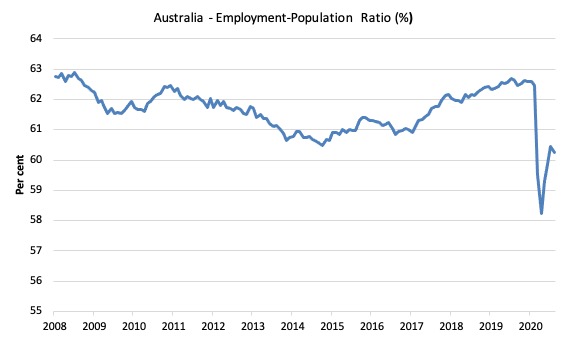
The following graph shows the Employment-to-Population ratio, since June 2008 (the low-point unemployment rate of the last cycle).
It fell with the onset of the GFC, recovered under the boost provided by the fiscal stimulus packages but then went backwards again as the Federal government imposed fiscal austerity in a hare-brained attempt at achieving a fiscal surplus in 2012.
The ratio fell by 0.1 points in September 2020 to 60.3 per cent. The ratio is now 2.6 points below pre-GFC peak in April 2008 of 62.9 per cent.
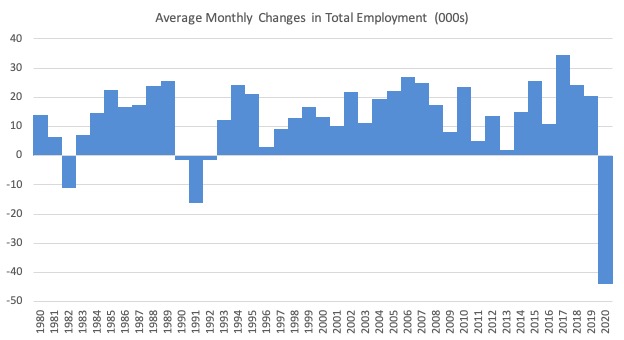
To put the current monthly performance into perspective, the following graph shows the average monthly employment change for the calendar years from 1980 to 2020 (to date).
1. The labour market weakened considerably over 2018 and that situation worsened in 2019.
2. 2020 is off the scale (average employment change so far of -44.1 thousand).
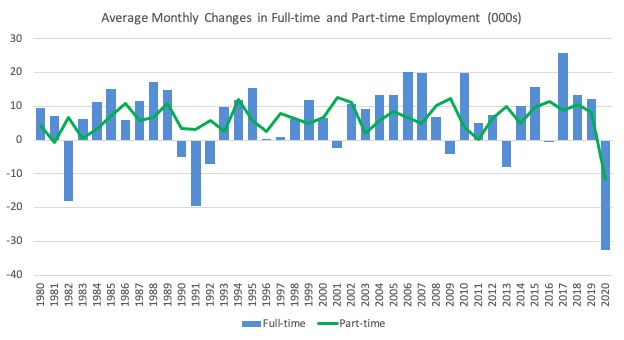
The following graph shows the average monthly changes in Full-time and Part-time employment (lower panel) in thousands since 1980.
The interesting result is that during recessions or slow-downs, it is full-time employment that takes the bulk of the adjustment. Even when full-time employment growth is negative, part-time employment usually continues to grow.
However, this crisis is different because much of the employment losses are the result of lockdowns and enforced business closures in sectors where part-time employment dominates.
But the continuing worsening of the full-time employment situation signals that the demand-side impacts are spreading more widely.
Impact of Stage 4 lockdown in Victoria
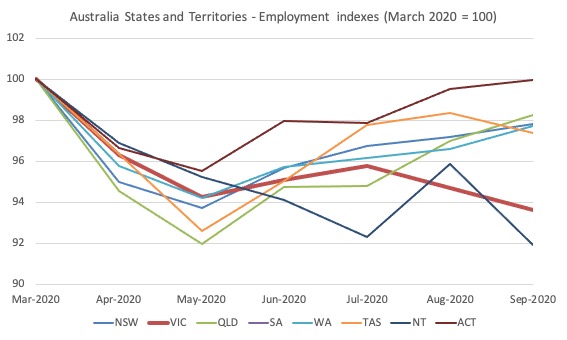
The following graph shows the impact on employment in Victoria as the State 4 restrictions took hold.
Clearly the lockdown has been damaging to employment in Victoria, which is no surprise.
With infection numbers now low and seemingly controlled, the situation will improve in the next month.
Unemployment increased 11,300 to 937,400 persons or 6.9 per cent
The official unemployment rate rose by 0.1 points to 6.9 per cent as the contraction in employment (29.5 thousand) being larger than the contraction in the labour force of 18.3 thousand.
The labour force fell as a result of the fall in the participation rate by 0.1 points.
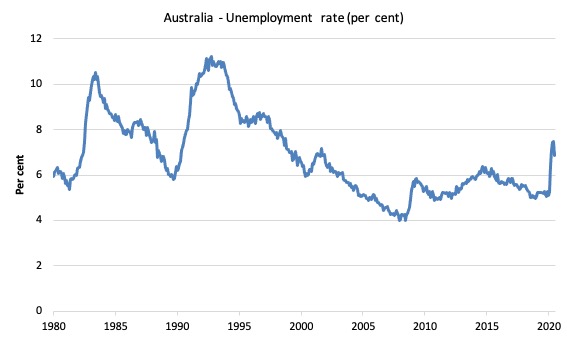
The following graph shows the national unemployment rate from January 1980 to September 2020. The longer time-series helps frame some perspective to what is happening at present.
Assessment:
1. There is clearly still considerable slack in the labour market that could be absorbed with further fiscal stimulus.
2. The government is choosing to allow this rise in joblessness from March to persist.
Broad labour underutilisation increased by 0.2 points to 18.3 per cent in September 2020
The results for September 2020 are (seasonally adjusted):
1. Underemployment rose by 11.8 thousand.
2. The underemployment rate rose by 0.1 points to 11.3 per cent.
2. Overall there are 1,536.8 thousand underemployed workers.
3. The total labour underutilisation rate (unemployment plus underemployment) rose by 0.2 points to 18.3 per cent.
4. There were a total of 2,474.3 thousand workers either unemployed or underemployed.
5. The rise in the broad underutilisation rate has been driven by a combined rise in unemployment and underemployment, which suggests a longer-lasting crisis – full-time jobs are being shed.
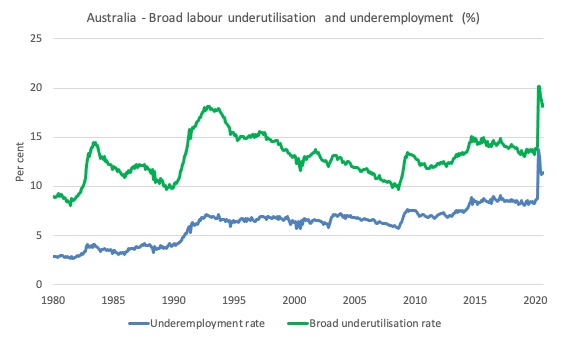
The following graph plots the seasonally-adjusted underemployment rate in Australia from January 1980 to the September 2020 (blue line) and the broad underutilisation rate over the same period (green line).
The difference between the two lines is the unemployment rate.
The three cyclical peaks correspond to the 1982, 1991 recessions and the more recent downturn.
The other difference between now and the two earlier cycles is that the recovery triggered by the fiscal stimulus in 2008-09 did not persist and as soon as the ‘fiscal surplus’ fetish kicked in in 2012, things went backwards very quickly.
The two earlier peaks were sharp but steadily declined. The last peak fell away on the back of the stimulus but turned again when the stimulus was withdrawn.
If the change in hidden unemployment (given the depressed participation rate) is added to the broad ABS figure the best-case (conservative) scenario would see a underutilisation rate around 20.3 per cent at present (see the discussion about participation below). Please read my blog post – Australian labour underutilisation rate is at least 13.4 per cent – for more discussion on this point.
Unemployment and broad labour underutilisation indexes – last four downturns
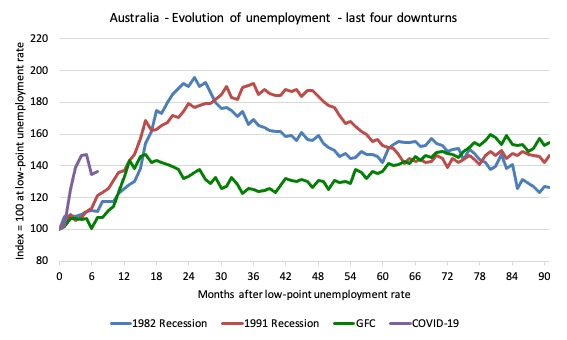
The following graph captures the evolution of the unemployment rates for the 1982, 1991, GFC and COVID-19 downturns.
For each episode, the graph begins at 100 – which is the index value of the unemployment rate at the low-point of each cycle (June 1981; December 1989; February 2008, and January 2020, respectively).
We then plot each episode out for 90 months.
For 1991, the peak unemployment which was achieved some 38 months after the downturn began and the resulting recovery was painfully slow. While the 1982 recession was severe the economy and the labour market was recovering by the 26th month. The pace of recovery for the 1982 once it began was faster than the recovery in the current period.
During the GFC crisis, the unemployment rate peaked after 16 months (thanks to a substantial fiscal stimulus) but then started rising again once the stimulus was prematurely withdrawn and a new peak occurred at the 80th month.
The COVID-19 downturn, while in its early months, is obviously worse than any of the previous recessions shown.
The graph provides a graphical depiction of the speed at which each recession unfolded (which tells you something about each episode) and the length of time that the labour market deteriorated (expressed in terms of the unemployment rate).
After five months, the unemployment had risen from 100 to:
1. 111.6 index points in 1982.
2. 111.2 index points in 1991.
3. 106.7 index points in the GFC.
4. 136.6 index points currently.
Note that these are index numbers and only tell us about the speed of decay rather than levels of unemployment.
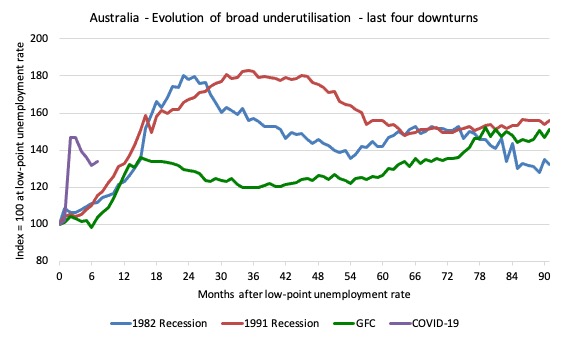
The next graph performs the same operation for the broad labour underutilisation rate (sum of official unemployment and underemployment).
Teenage labour market marks time in September 2020
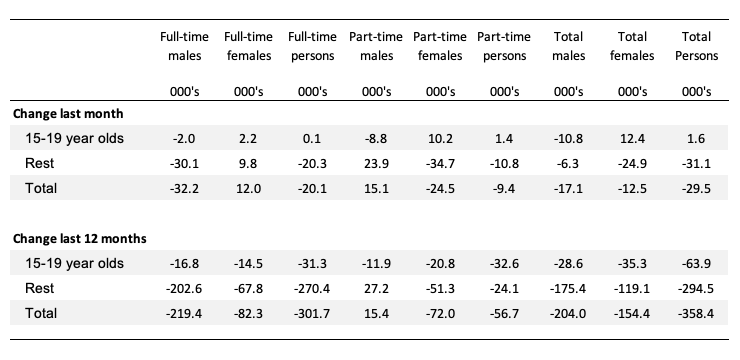
1. Total teenage net employment rose by 1.6 thousand in September 2020 (0.3 per cent).
2. Full-time teenage employment rose by just 0.1 thousand (0.1 per cent) and part-time employment rose by 1.4 thousand (0.3 per cent). With the low-wage service sector now open in most states, one would have expected the part-time opportunities for teenagers to expand more quickly.
3. The teenage unemployment rate rose by 1.8 points to 20.1 per cent and participation rose (1.3 points). These aggregates are volatile.
The following Table shows the distribution of net employment creation in the last month and the last 12 months by full-time/part-time status and age/gender category (15-19 year olds and the rest).
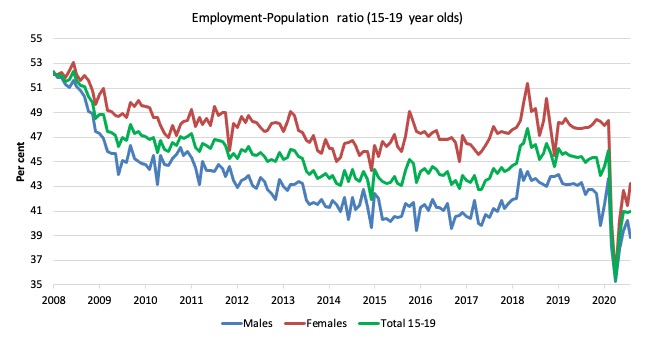
To put the teenage employment situation in a scale context (relative to their size in the population) the following graph shows the Employment-Population ratios for males, females and total 15-19 year olds since June 2008.
You can interpret this graph as depicting the loss of employment relative to the underlying population of each cohort. We would expect (at least) that this ratio should be constant if not rising somewhat (depending on school participation rates).
The absolute loss of jobs reported above has impacted more on females than males.
1. The male ratio has fallen by 13.5 percentage points since February 2008 and 4.8 points since March 2020.
2. The female ratio has fallen by 8.9 percentage points and 5.1 points since March 2020.
3. The overall teenage employment-population ratio has fallen by 11.3 percentage points and 5 points since March 2020.
4. In proportional terms, despite the improvement in June, this remains a devastating result for teenagers.
Aggregate participation rate decreased by 0.1 points to 64.8 per cent
The fall in the labour force participation rate means that that the labour force fell by 18.3 thousand. With employment falling by 29.5 thousand, unemployment fell by 11.3 thousand because 18.3 thousand dropped out of the workforce.
The labour force is still below the March 2020 level by 203.5 thousand and those workers will eventually return as employment rises, which will place a further strain on official unemployment.
By how much would unemployment have changed had the participation rate had not fall?
We can make two calculations:
1. Just the monthly implication.
2. The implication of the participation rate being below its most recent peak of 66.2 per cent in September 2019.
The labour force is a subset of the working-age population (those above 15 years old). The proportion of the working-age population that constitutes the labour force is called the labour force participation rate. Thus changes in the labour force can impact on the official unemployment rate, and, as a result, movements in the latter need to be interpreted carefully. A rising unemployment rate may not indicate a recessing economy.
The labour force can expand as a result of general population growth and/or increases in the labour force participation rates.
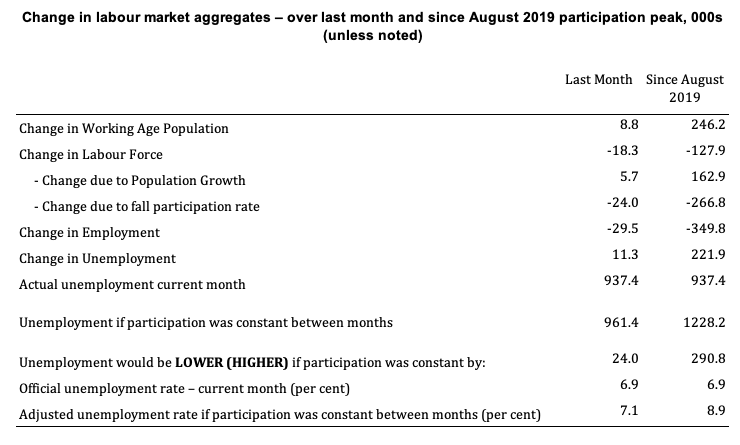
The following Table shows the breakdown in the changes to the main aggregates (Labour Force, Employment and Unemployment) and the impact of the rise in the participation rate.
The change in the labour force in September 2020 was the outcome of two separate factors:
- The underlying population growth added 5.7 thousand persons to the labour force. The population growth impact on the labour force aggregate is relatively steady from month to month but has slowed in recent months due to the border restrictions and the impact they have had on migration rates; and
- The rise in the participation rate meant that there were 18.8 thousand workers re-entering the labour force (relative to what would have occurred had the participation rate remained unchanged).
- The net result was that the labour force rose by 24.5 thousand.
Assessment:
1. If the participation rate had not have fell in September 2020, total unemployment, at the current employment level, would have been 961.4 thousand rather than the official count of 937.4 thousand as recorded by the ABS – a difference of 24 thousand workers (the ‘participation effect’).
2. Without the fall in the participation rate in September 2020, the official unemployment rate would have been 7.1 per cent (rounded) rather than its current value of 6.9 per cent).
3. Hidden unemployment thus increased by 24 thousand.
4. The situation is worse if we consider the collapse since August 2019. The labour force has shrunk by 127.9 thousand and the unemployment rate would be 8.9 per cent rather than 6.9 per cent had those workers not dropped out of the labour force as a result of inadequate job opportunities.
5. If we add the change in hidden unemployment back into the broad labour underutilisation rate currently estimated to be 18.3 per cent, we would get a total wastage rate of 20.3 per cent.
The standard conclusion – policy failure.
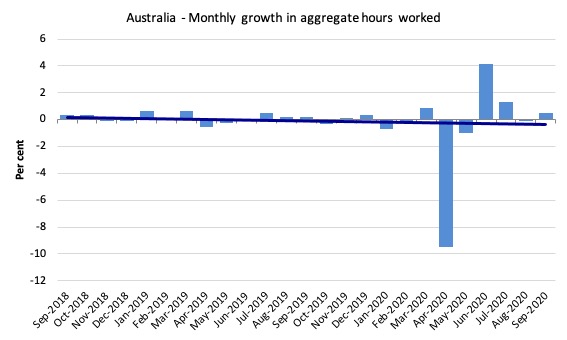
Hours worked increased 8.7 million hours (0.421 per cent) in September 2020
As the lockdown eases, hours worked are returning – albeit very slowly
The following graph shows the monthly growth (in per cent) over the last 24 months.
The dark linear line is a simple regression trend of the monthly change – which depicts a decreasing trend. Even before the coronavirus crisis struck, the trend was downwards.
Conclusion
My standard monthly warning: we always have to be careful interpreting month to month movements given the way the Labour Force Survey is constructed and implemented.
The September 2020 data reveals that the recovery in the Australian economy has stalled somewhat on the Stage 4 restrictions in Victoria as that state dealt with the second virus wave.
However, Tasmania and the Northern Territory also experienced employment losses in September 2020.
My overall assessment is:
1. The current situation can best still be described as near catastrophic.
2. The Australian labour market needs massive fiscal policy intervention targetted at direct job creation.
3. The current federal fiscal support for the economy is grossly inadequate and needs to be increased.
5. Any government that oversees that sort of disaster has failed in their basic responsibilities to society.
That is enough for today!
(c) Copyright 2020 William Mitchell. All Rights Reserved
As bad as the numbers are they still aren’t drastic enough for the ALP to win a federal election.
Also I read in the Australian they are considering Industrial Relations reform where by they (Business lobby Groups) want to see penalty rates, awards and enterprise agreements scaled back, effectively reducing wages and hours, they believe reducing wages and conditions is an economic stimulator
Given the facts that Bill presents – not only in this month’s report but in each of the preceding ones – it would be hard for anyone to deny the justice of his comprehensively damning verdict on the (Australian) government’s record (and, by inference since it offers no real alternative, on that of the opposition too).
However, an equally damning verdict would seem to a greater or lesser degree to be justified in respect of most other “western” governments and their respective oppositions. To state the obvious, the root of the problem must be politics not economics – as was very starkly brought home by some comments on Bill’s recent blog post “Governments should use their fiscal capacity to ensure our youth always can find a job” (Monday, October 12, 2020).
Even if it’s clear – as it is to followers of Bill’s blog (or other forums promoting broadly-aligned economics scholarship) – that awareness by politicians of what an MMT-type analysis can tell them would enable them to adopt the whole range of ameliorative measures which are now essential, that would be no guarantee that they would actually choose to – nor that even if they did *they could expect to command an electoral majority for doing so*.
In a comment on the subsequent blog post “When disaster strikes the poorest nations, the IMF guarantees to make it worse” (Tuesday, October 13, 2020), Derek Henry wrote:-
“I could very easily be wrong but I predict fiscal policy errors the world over and the virus will change very little. They’ll all revert back to type when it’s over because Washington demands it. Cut back the stimulus way too early.
“Democracy is a sham. The current US election is a circus filled with freaks that will change nothing. A sideshow of liberal metropolitan insanity that fuels populism everywhere. That will only end up as complete and utter carnage as the world burns. War is certain, what kind of war it will be is the question. Only guarentee is millions will suffer”.
Whether that dire prediction will be borne-out by events depends (I submit) upon whether or not a fundamental, radical, change takes place in the politics of the whole “western bloc” of nations – in this context treating the EU as a “quasi-nation” (which de facto means, unfortunately:- *German* politics).
Maybe Neil Halliday is right to believe/hope(?) that Great-Power rivalry with China will force the “western” bloc (de facto America) into making such a change. It’s very hard to foresee what else could, barring the emergence of any statesmen or -women in *any* western polity who have yet begun to grasp the enormity of the change that’s required or any glimmering of a compulsion towards trying to lead it. The exact opposite seems to be the case, in fact – namely (as Derek says) a complete dearth of any such figures now or foreseeably.
The Coalition seems to be kicking the can down the road for as long as possible. Surely the Plague will leave us and the economy can return to normal. Surely we can take up where we left off.
I doubt it. The world has overshot its resource base and the Plague has made this obvious. Except for hanging on to power (which is what governments do), the Coalition hasn’t a clue about what to do. Neither does the ALP, hence their deafening silence.
I’m starting to look at what happened to the USSR after 1989 and see if any of that may show up here.
Is there any article about the influence of the central bank’s interest rate and the interest of the private banks to lend to costumers ?