Economics and business correspondents regularly serve as apologists for poor policy. Their motivation is to…
Capital investment in Australia falls off the proverbial in the June quarter
The Australian Bureau of Statistics (ABS) published the June-quarter – Private New Capital Expenditure and Expected Expenditure, Australia – data today as part of the sequence of data releases relating to next Wednesday’s release of the second quarter National Accounts. Remember that this data is ‘backward’ looking, in that it tells us what has gone in the three months from April to the end of June. But it does provide the first signal of the impact of the first-stage lockdowns in April have had on capital formation. Today’s release confirms the worst with Total new capital expenditure falling by 5.9 per cent in the quarter and 11.5 per cent over the last 12 months. Investment in Building and structures fell by 4.4 per cent over the quarter and 9.4 per cent over the 12 month period, while investment in Equipment, plant and machinery fell by 7.6 per cent for the quarter and 13.8 per cent over the year. Crucially expected investment for 2020-21 has nose-dived (down 12.6 per cent on previous plans). By allowing the economy to go into recession and sustain mass unemployment and falling sales, the Australian government has made matters worse. Within the safe health constraints, it could have easily added another $A100 billion to its stimulus and seen unemployment drop to relatively low levels, major construction work undertaken in social housing to address the chronic shortfall, and invest in forward-looking green infrastructure. Instead, it has chosen to penny pinch and today’s figures are just the start of the damage this policy void is causing. This is another case of neo-liberal austerity white-anting the capacity of the economy to deliver prosperity for all.
The ABS data shows that for the June-quarter 2020 (real and seasonally-adjusted):
- Total new capital expenditure fell by 5.9 per cent over the quarter and 11.5 per cent over the year.
- Buildings and structures investment fell by 4.4 per cent over the quarter and 9.4 per cent over the year.
- Equipment, plant and machinery fell per cent over the quarter and 7.6 by per cent over the quarter and 13.8 per cent over the year.
- Mining investment fell 1.2 per cent for the quarter but was 3.9 per cent higher on the year.
- Manufacturing investment fell by 4.5 per cent for the quarter and 7 per cent on the year.
- Non-Mining investment fell by 8 per cent for the quarter and 17.3 per cent on the year.
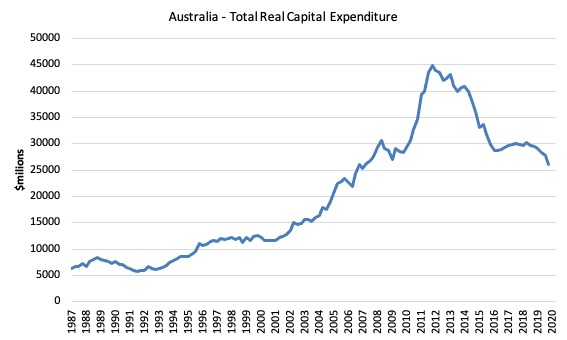
The first graph shows the scale of Australia’s problem with respect to investment in productive capacity. It shows total real capital formation from the September-quarter 1987 (start of sample) to the June-quarter 2020.
The huge hump relates to the once-in-a-century mining boom (see below).
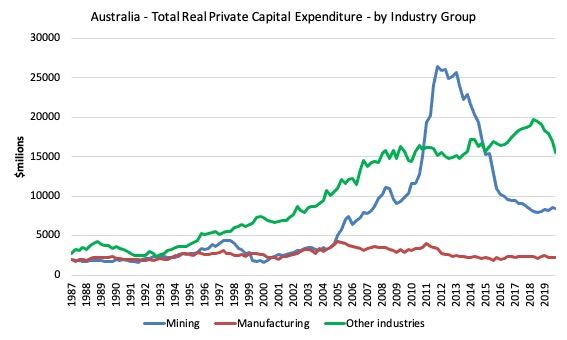
The next graph shows real private capital expenditure by broad sector.
The boom and bust in the Mining sector is quite extraordinary in historical terms.
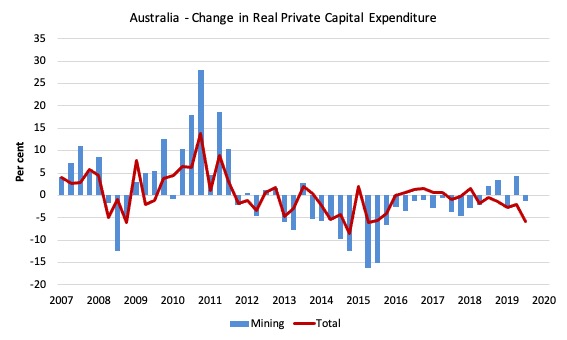
The next graph shows the quarterly percentage change in Total and Mining private capital expenditure in real terms from the December-quarter 2007 to the June-quarter 2020.
The damage to capital formation from the GFC is clear.
It was also the case that there was some sporadic recovery in investment expenditure leading into the pandemic but the June-quarter results have stopped that in its tracks.
I expect worse to come in the next quarter.
The ABS also produce very interesting data on the expected investment expenditure plans over 7 discrete quarters. The ABS conducts a survey “in the 8 or 9 week period after the end of the quarter to which the survey data relate”. They ask firms to “provide 3 basic figures”:
– Actual expenditure incurred during the reference period (Act)
– A short term expectation (E1)
– A longer term expectation (E2).
In relation to this pattern, the ABS say that for 2019-20:
- the first estimate was available from the December 2018 survey as a longer term expectation (E2)
- the second estimate was available from the March 2019 survey (again as a longer term expectation)
- the third estimate was available from the June 2019 survey as the sum of two expectations (E1 + E2)
- in the September 2019, December 2019 and March 2020 surveys the fourth, fifth and sixth estimates, respectively, are derived from the sum of actual expenditure (for that part of the year completed) and expected expenditure (for the remainder of the year) as recorded in the current quarter’s survey
- the final (or seventh) estimate from the June quarter 2019 survey is derived from the sum of the actual expenditure for each of the four quarters in the 2019-20 financial year.
As a result we get the following graph of Total Capital Expenditure (black columns) and Expected (clear columns), which allows you to trace the shifting expectations of expenditure (the plans) and what actually transpires.
It is clear that expected (planned) private investment expenditure for 2020-21 is significantly lower than it was in 2019-20.
The ABS note that:
Estimate 7 for 2019-20 is $116,839m. This is -4.3% lower than Estimate 7 for 2018-19.
Estimate 7 is 1.3% higher than Estimate 6 for 2019-20.
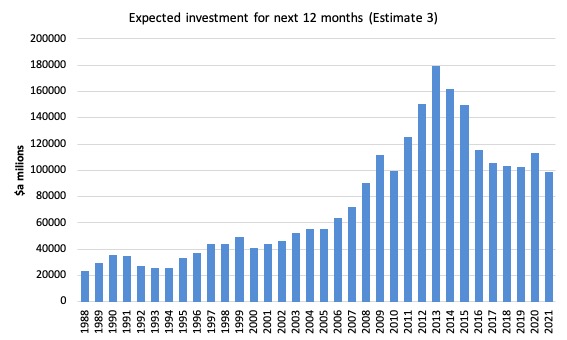
Estimate 3 for 2020-21 is $98,624m. This is -12.6% lower than Estimate 3 for 2019-20.
Estimate 3 is 8.9% higher than Estimate 2 for 2020-21
In other words, investment plans by corporations are pointing to a contraction in spending over the next 12 months, which is unsurprising and will make the recovery much harder to achieve.
The next graph shows the expected investment for the next 12 months (Estimate 3), which is the most recent we have for 2020-21.
It contracted by 12.65 per cent in the most recent update.
Why does this matter?
A basic insight to come out of the economic growth literature (Harrod-Domar approach) is that any notion of a steady-state (where the economy is at rest) will be transitory because of the dual characteristic of investment spending.
1. Investment adds to aggregate spending in the current period (demand-side effect) and stimulates income growth.
2. It also adds to the productive capacity of the economy (supply-side effect) and increases potential income and output in the future.
To fully utilise the growing productive capacity the economy must also experience appropriate aggregate demand growth to absorb the increased output levels made possible by the increased productive capacity.
This means that the income level that might be consistent with full employment of capital and labour in the current period will be deficient over time as the productive capacity grows via investment expenditure.
Thus, aggregate demand has to grow in the next period to ensure the extra capital is fully utilised. The expenditure side of the economy can be seen as always chasing the growth in capacity that it creates.
The dual nature of investment raises the possibility of crises occurring where capital and labour resources lie idle as a result of aggregate demand failing to keep pace of the growth in productive capacity.
The problem is different when investment spending falters as it has been over some period now in Australia.
Then the growth of productive capacity slows and the inflation ceiling falls.
What does that mean?
It means that potential GDP (the capacity of the economy to produce output) falls at the same time as actual output is falling due to a lack of current expenditure driving firm cutbacks but also cutting their forward-looking investment expenditure plans.
Which means that the economy can support only lower rates of overall GDP growth (and employment creation) without coming up against capacity constraints.
That becomes a major issue for nations after prolonged recessions.
Another aspect of investment behaviour that we observe in the real world is asymmetry. Investment in new capital stock usually requires firms to make large irreversible capital outlays.
Capital is not a piece of putty that can be remoulded in whatever configuration that might be appropriate (that is, different types of machines and equipment). Once the firm has made a large-scale investment in a new technology they will be stuck with it for some period.
In an environment of endemic uncertainty, firms become cautious in times of pessimism and employ broad safety margins when deciding how much investment they will spend.
Accordingly, they form expectations of future profitability by considering the current capacity utilisation rate against their normal usage.
They will only invest when capacity utilisation, exceeds its normal level. So investment varies with capacity utilisation within bounds and therefore productive capacity grows at rate which is bounded from below and above.
The asymmetric investment behaviour thus generates asymmetries in capacity growth because productive capacity only grows when there is a shortage of capacity.
This insight has major implications for the way in which economies recover and the necessity for strong fiscal support when a deep recession is encountered.
Two conclusions arise from these observations.
1. Currency-issuing governments should do everything they can within their capacity to avoid recessions because they not only have damaging short-term impacts, but, also lead to investment shortfalls, which cause problems into the future as a result of capacity shortages.
2. Knowing investment is asymmetric means that policy should endeavour to instil confidence in the sales environment for several period out to encourage firms to invest in new capacity based on the confidence that the output that capacity can support will sell.
Assessment
With those points in mind, it is clear that the Federal government is failing in these primary fiscal responsibilities.
While it is no longer raving on about debt and deficits, it is clear that their unwillingness to provide the necessary fiscal support to prevent unemployment rising and output collapsing, is driven by their DNA-objection to using their fiscal capacity constructively.
It has been dragged into expanding the deficit because they knew if they didn’t there would be no political comeback for them.
But their penny-pinching is seriously eroding business confidence and the longer the malaise persists the worse it will get.
They should announce a $A100 billion stimulus focusing on direct job creation, apprenticeships, social housing (we are 400,000 short of what is needed at present), and green infrastructure.
That would be a reliable way to reverse the pessimism in the investment community.
It could also be done without violating the need for health scrutiny.
Conclusion
Next Wednesday, the Australian National Accounts come out and we will see by how much this negative investment performance drags down growth.
Australia is demonstrating how an affluent country can undermine the well-being of its citizens through poorly conceived macroeconomic policy.
That is enough for today!
(c) Copyright 2020 William Mitchell. All Rights Reserved.
Hi Bill,
Does it have an effect on the floating exchange rate ?
How will that play out for Australia ?
As there is a theory out there that with both Domestic capital investment and FDI there is a 18 month – 2 year lag before it shows up in the rate.
It would be a great read that. If all your recent Australia articles were summarised and if they continue down the “sound money route” that were highlighted in the Australia articles
How it plays out over the longer term for the external sector and Aussie exchange rate and what that means for Australia over the next couple of years.
If they implemented a JG and went down the MMT route as the JG encourages capital investment and FDI.
What that would mean for Australia’s external sector and the Aussie exchange rate.
What policy choices are best for Australia, which they kept a very close eye on regarding the exchange rate in the white paper from 1945.