Yesterday, the Reserve Bank of Australia finally lowered interest rates some months after it became…
Australian minimum wage case decision – a scandalous indictment of our system
On June 19, 2020, Australia’s wage setting tribunal, the Fair Work Commission handed down its – Decision: Annual wage review – which saw the National Minimum Wage (NMW) rise by just 1.75 per cent per cent from July 1, 2020. However some of the flow-on increases (awards linked to the NMW), which would normally have been adjusted on the same date have been staggered (November 1, 2020 for Group 2 Awards and February 1, 2021 for Group 3 Awards). The new minimum wage will be $753.80 per week or $19.49 per hour (a measly 35 cents per hour extra). In terms of any inflation measure you want to choose, the FWC’s decision represents a real wage cut for the lowest paid workers (Group 1) and even larger cuts for the other Groups as a result of the staggered wage rises. There is certainly no joy for workers when the mindless pursuit of austerity by the federal government slows growth (before the pandemic), which the government’s own wage setting tribunal then uses as a pretext (the slow growth) to cut real wages. Meanwhile the major employer groups argued for zero nominal rise while enjoying growth in profits with rising productivity growth. A scandalous indictment of our system.
In this blog post – Australia’s minimum wage rises – but not sufficient to end working poverty (June 6, 2017) – I outlined:
1. Progressive minimum wage setting principles.
2. The way staggered wage decisions (annually) lead to falling real wages in between the wage adjustment points.
I won’t repeat that analysis here. But it is essential background to understanding why the decisions taken by Fair Work Australia have been inadequate for a long time.
The FWA Decision
In its 2020 decision – Fair Work Australia wrote:
The factors we are required to take into account have led us to award an increase of 1.75 per cent. The NMW will be $753.80 per week or $19.84 per hour. The hourly rate has been calculated by dividing the weekly rate by 38, on the basis of the 38-hour week for a full-time employee. This constitutes an increase of $13.00 per week to the weekly rate or 35 cents per hour to the hourly rate.
The Decision applies to around “2.2 million or 21.0 per cent of all employees in Australia” through flow-on effects via Australia’s award pay system.
However, “the proportion of all employees that are paid at the adult NMW rate is estimated to be 1.7 per cent (or around 180 200 employees)”.
The Fair Work Commission decision took into account the following considerations:
1. “gross domestic product (GDP) growth is lower and GDP is expected to fall significantly over 2019-20 before a forecasted strong rebound”
2. “real net national disposable income (RNNDI) increased by 2.4 per cent over the year to the March quarter 2020 compared with 3.7 per cent over the year to the December quarter 2018”
3. “labour productivity increased by 1.4 per cent over the year, higher than at the time of the last Review (0.8 per cent)”
4. “the profits share of total factor income increased by 0.4 percentage points, from 28.6 per cent in the December quarter 2018 to 29.0 per cent in the March quarter 2020.”
5. “the unemployment rate is higher”
6. “headline inflation increased significantly, particularly due to effects from the drought and bushfires, as well as COVID-19.”
7. “wages growth, as measured by the Wage Price Index (WPI), declined slightly”
In summary, profits have risen, wages growth has declined (at record low levels) and labour productivity has risen.
The flat wages outlook with rising inflation (due to calamities not labour cost inflation) combined with rising productivity growth has redistributed national income towards profits.
But also think about the logic going on here.
The FWC makes a big deal of the slowing economy but fails to acknowledge that before the pandemic this was all down to the ridiculous pursuit of a fiscal surplus by the Federal government, which starved the economy of spending and had already caused unemployment and underemployment to rise.
And then, the FWC wants to punish the lowest paid workers by suppressing wages growth because the economy might not be able to ‘afford’ it.
Perfect vicious circle.
Austerity kills growth and pushes up unemployment and then the government’s own wage setting tribunals further punish the lowest paid workers who manage to keep their jobs.
You might also wonder who gets the NMW and who fits into the Group 2 and Group 3 awards, which are pay agreements linked to the NMW.
Understanding this will help you appreciate my assessment.
As the FWC states:
The modern awards in Group 2 cover industry sectors adversely impacted by the pandemic, but not to the same extent as the sectors covered by the Group 3 awards …
The modern awards in Group 3 cover the industry sectors which have been most adversely affected by the pandemic.
In other words, in addition to the pain of unemployment, initially forced on these workers by government dictate (lockdown) and refusal to create alternative work for the displaced workers, the FWC is now punishing them further by delaying the annual wage increase, in the worst hit cases until February 1, 2020.
That is 8 months after these workers would normally get their increase.
Real wage cuts for lowest paid workers
Now what is the impact of a 1.75 per cent increase in the NMW? Is it a real wage increase for the lowest paid workers?
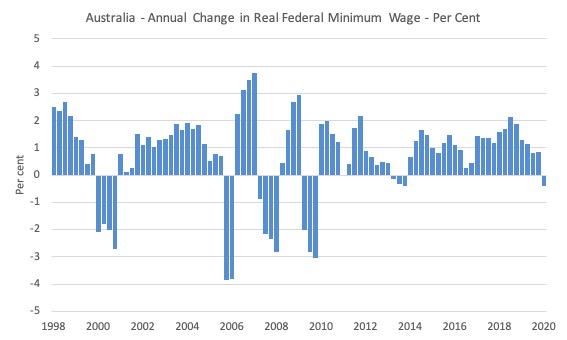
The following graph shows the annual percentage change in the real National Minimum Wage since the September-quarter 1998 up to September-quarter 2020 (the first quarter the new level will be applicable).
I assume the inflation rate will be constant at its March-quarter 2020 value for the next two quarters.
Conclusion: The real purchasing power equivalent of the NMC will be cut by 0.4 per cent over the 12 months to the September-quarter 2020 as a result of the FWC decision.
So even for workers (Group 1) who receive the increase as of July 1, 2020, the FWC’s decision undermines their real wage.
I find that reprehensible especially during a recession.
The FWC was open about the implications of this:
We acknowledge that any increase we award which is less than increases in prices and living costs would amount to a real wage cut. Such an outcome would mean that many award-reliant employees, particularly low-paid employees, would be less able to meet their needs. For some households such an outcome would lead to further disadvantage and may place them at greater risk of moving into poverty.
But still they chose to undermine real wages.
But it gets worse.
Once we take into account the tax free threshold of $18,200 and then compute the higher tax the workers will be paying, their disposable annual wage income only grows by around 1.5 per cent.
So with the RBA forecasting CPI-inflation to be 2.75 per cent over the next year, the actual real wage cut in disposable income terms for the lowest paid workers is very substantial.
And for those in Groups 2 and 3, the cuts are much worse, given that the inflation is eroding their purchasing power on a continuous basis and they have to wait to get the nominal increases in their pay (as above).
Wages increases and demand for goods and services
The Australian Council of Trade Unions had sought a rise of 4 per cent increase arguing that:
… as restrictions begin to lift, it is hoped that conditions improve for all Australians that have been affected. In our view, a real lift to minimum wages will help rather than hinder the transition …
Wages play two different roles in the economy. While they are a key cost to employers, they are also a major source of income for consumers. If the real incomes of all or a significant proportion of consumers are reduced, aggregate demand for goods and services will decline …
If real wages were to fall for the low paid even further as result of the Commission decision (i.e. less than rate of inflation over the coming year) there would be negative macroeconomic consequences and we would be repeating the mistakes of the Great Depression.
This had overtones of the debate between Keynes and the Classical economists during the Great Depression.
FWC admitted in its decision that this issue has been canvassed and assessed in past minimum wage cases:
… an increase in minimum wages … was ‘likely to have some effect on consumer demand that needs to be taken into account …
As it turned out they ignored it and chose to go with capital.
Relativities
There was a lot of discussion about a “fair” minimum wage and the concept of a living wage, which is often considered to be 60 per cent of the median wage.
The Fair Work Commission agreed that there were many workers in highly disadvantaged situations:
Our overall assessment is that while the relative living standards of NMW and award-reliant employees have improved over recent years, some low-paid award-reliant employee households have disposable incomes less than the 60 per cent of median income poverty line. Further, many household types are also likely to have disposable incomes that do not reach the threshold of the relevant minimum income for healthy living (MIHL) budget.
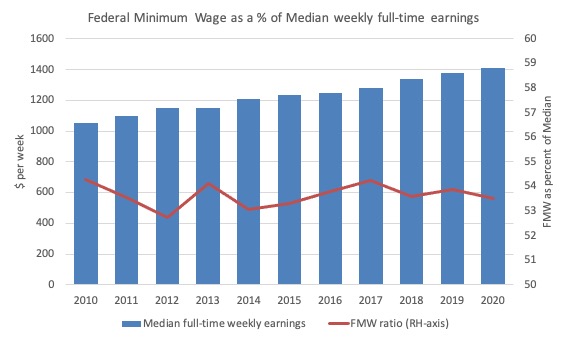
The following graph shows Median weekly earnings of full time employees from 2010 to 2020 (blue bars) and the Federal weekly minimum wage as a proportion of the median (red line, right-axis, per cent).
For median earnings I extrapolated the annual growth from 2018-19.
Over time, this desired ratio has languished well below 60 per cent, which is the benchmark that is universally used to denote a ‘poverty threshold’.
The Federal Minimum Wage relativity has worsened in this recent decision.
Conclusion: The Federal Minimum Wage is around $91 per week shy of reaching the 60 per cent of median benchmark and the gap is rising.
The scandal is that the major employer groups like the Australian Chamber of Commerce and Industry (ACCI), the Australian Industry Group (Ai Group), the National Farmers Federation, the National Retail Association (NRA), and the Restaurant and Catering Industry Association (R&CA) argued that “there be no increase to the NMW and modern award minimum wages”, even though profits and productivity have been rising.
They ran the usual story that wage increases would kill employment.
They said the same thing when they persuaded the FWC to cut penalty rates (weekend and public holidays) for the lowest paid workers and promised an employment bonanza. The data shows that even before the pandemic employment was not rising in the sectors that had cut wages.
And they never say boo when they are handing out massive CEO payments to themselves.
One gets angry at times dealing with all of this.
These groups routinely lie and should be disregarded.
The Australian government also did not show any leadership in the issue. It hinted that FWC should follow the lead of the major employer groups.
Wage Parity
I have already showed the parity with respect to the accepted poverty threshold (see above).
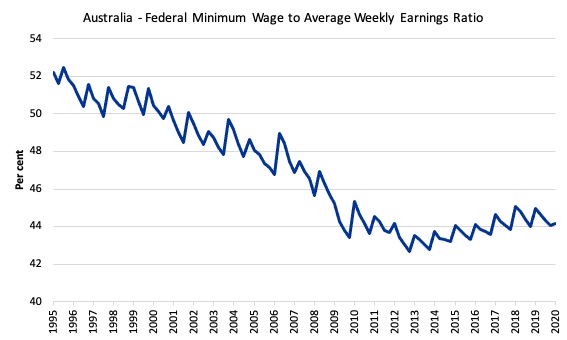
In terms of other parities with other wage earners, the following graph shows the ratio of the Federal minimum wage to the Full Time Adult Ordinary time earnings series provided by the ABS (the latest being for the December-quarter 2017). This series in now bi-annual (previously quarterly). I have interpolated on the basis of the most recent growth.
I simulated this series out to September-quarter 2020 (the quarter after which the latest FWC Annual Wage decision will start impacting) based on a constant growth in earnings (assessed over the last 12 months).
The new FWC applies from July 1, 2020 so will be constant over the September-quarter.
The logic of the neo-liberal period which encompasses the data sample shown was to at least achieve cuts at the bottom of the labour market, given that workers with more bargaining power would put up resistance against generalised cuts.
Successive minimum wage decisions forced workers at the bottom of the wage distribution to fall further behind in relative terms.
In the December-quarter 1993, minimum wage workers earned around 55 per cent of the Full Time Adult Ordinary time earnings. By June 2019, this ratio will have fallen to around 44.3 per cent.
There has been a serious erosion of parity over the last 23 years.
But in the last two years, as the general Wage Price Index grows at record low levels (and overall real wages flat-line) and the FWC awards moderate real wage increases to the minimum wage workers, the erosion in the parity ended.
The recent decision appears to have started a new period of erosion, even with the general index at record low levels of growth.
The ratio reached a low of 43.2 per cent in the June-quarter 2015 but was only 44.2 per cent in the current quarter.
Depriving workers a share of productivity growth
Another way of looking at this dismal outcome is to compare the movement in the Federal Minimum Wage with growth in GDP per hour worked (which is taken from the National Accounts). GDP per hour worked is a measure of labour productivity and tells us about the contribution by workers to production.
Labour productivity growth provides the scope for non-inflationary real wages growth and historically workers have been able to enjoy rising material standards of living because the wage tribunals have awarded growth in nominal wages in proportion with labour productivity growth.
That relationship has been severely disrupted by the neo-liberal attacks on unions, wage fixing tribunals and other legislative initiatives that have eroded the capacity of workers to share in labour productivity growth.
The widening gap between wages growth and labour productivity growth has been a world trend (especially in Anglo countries) and I document the consequences of it in this blog post – The origins of the economic crisis (February 16, 2009).
But the attack on living standards has targetted more than the bottom end of the labour market, although the minimum wage workers have certainly been more deprived of the chance to share in national productivity growth than other workers.
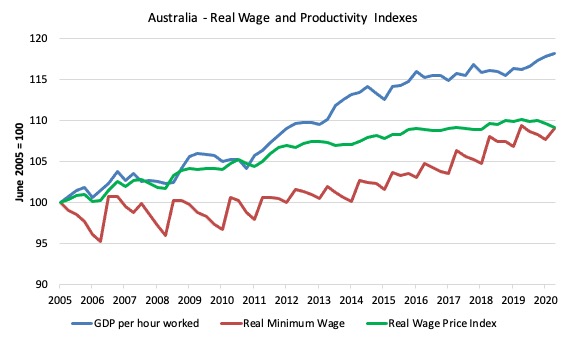
The following graph shows the evolution of the real Federal Minimum Wage (red line), GDP per hour worked (blue line), and the Real Wage Price Index (green line), the latter is a measure of general wage movements in the economy.
The graph is from the June-quarter 2005 up until September-quarter 2020 (indexed at 100 in June 2005 and extrapolated as above out to September 2020).
By June 2020, the respective index numbers were 117.8 (GDP per hour worked), 109.6 (Real WPI), and 107.7 (real FMW).
Overall, all workers have failed to enjoy a fair share of the national productivity growth, and that minimum wage workers in Australia have been largely excluded from sharing in any of the productivity growth although the low-paid workers have fared a little better in recent years.
Of-course, like all graphs the picture is sensitive to the sample used. If I had taken the starting point back to the 1980s you would see a very large gap between productivity growth and wages growth, which has been associated with the massive redistribution of real income to profits over the last three decades.
Staggered adjustments in the real world
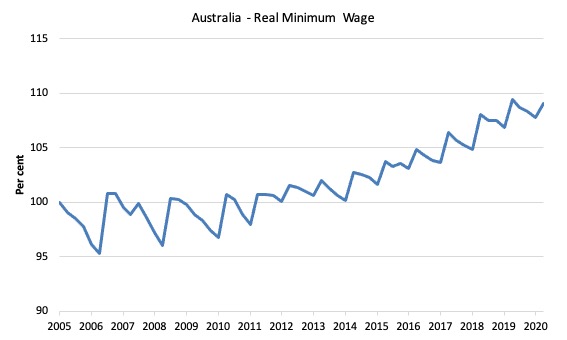
The following graph shows the evolution of the real Federal Minimum Wage (FMW) since the June-quarter 2005 extrapolated out to September-quarter 2020 (the quarter in which the recent decision will start impacting) based on a constant (current) inflation rate.
This is the FMW expressed in purchasing power terms.
You can see the saw-tooth pattern that the theoretical discussion I provided in this blog post – Australia’s minimum wage rises – but not sufficient to end working poverty (June 6, 2017) – describes.
Each period that curve heads downwards the real value of the FMW is being eroded. Each of the peaks represents a formal wage decision by the Fair Work Commission.
You can gauge the annual growth in the real wage by comparing successive peaks.
The decisions since 2012 have provided for some modest real income retention by these workers although it depends on how inflation is measured.
You can also see the troughs are shallower in recent years than in the past because the inflation rate has moderated as a result of the GFC and the austerity since that has kept economic activity at moderate levels.
So while each adjustment provides some immediate real wage gain for workers, those gains are ephemeral and the inflation process systematically cuts the purchasing power of the FMW significantly by the time the next decision is due – these are permanent losses.
The current peak for the September-quarter 2020 will be below the peak for the September-quarter 2019, which means that the erosion of purchasing power throughout the year has resulted in an overall reduction in real purchasing power.
Conclusion
While Australia’s lowest-paid workers received a small nominal annual wage rise from the FWC, the rise translates into a significant real wage cut and worsens working poverty.
In terms of the accepted 60 per cent of median full-time weekly earnings, the Federal Minimum Wage remains some $91 per week shy of reaching that benchmark.
The gap reflects a history of decisions by Australia’s wage setting tribunals which have undermined the capacity of low-paid workers to enjoy real wage gains and keep pace with productivity growth.
The way to deal with a recession is not to cut the wages of the lowest paid workers who have propensities to consume close to or equal to one.
That is enough for today!
(c) Copyright 2020 William Mitchell. All Rights Reserved.
The minimum wage in Canada runs a little over $11/hr.
Given the opposition of Neo-liberals this will never pass, but —
I think that the poverty income level and minimum wage income for a weeks work should be Constitutionally set as some percentage of the highest tax bracket’s income level.
When the rich raise that top bracket to get more income taxed at the lower rate, this would automatically raise the poverty income level and min. wage.
I’m no expert, but setting the poverty level at 60% of the median income is not always going to work. If corps. are able to depress wages then it will push more people into grinding poverty. Why let this happen?
Oh. I know! Economics doesn’t care about the mass of the people, at all. !!!
Dear J. Christensen (at 2020/07/02 at 3:16 pm)
Yes, it is $11.06 per hour.
But the question is what will it buy?
I did a calculation:
1. Tesla Model X – Canada $112,990, Australia 158,029
2. Hours at minimum wage to buy one – Canada 10,216, Australia 8108.
Could be a stupid example but it is a standardised product in both countries.
Our minimum wage workers are probably better off than Canada’s minimum wage workers. But that doesn’t mean they are very well off here. Quite the contrary.
best wishes
bill
Interesting example.
UK Model X: £82,980. Minimum wage £9.80. Hours to buy one: 8923
USA Model X: 79,990USD. Minimum wage 7.25USD. Hours to buy one: 11034
They create austerity to keep wages down. Then complain about a low economy and confidence to keep wages down more.
Poverty rises as do profits.
When unions complain, it’s said to be bad for competitiveness.
That’s why larger deficits and MMT is so dangerous to guardians of this nauseous system.
The hours needed to buy a luxury car comparison is interesting, but one should also consider the share of the minimum wage required to be spent on basic necessities and the remainder left over for an odd treat or that could be set aside for luxury car purchase in a future era. In London, a significant amount of that minimum wage disappears in putting a roof over ones head with just about room to swing a cat (and no pension for securing that roof for old age years), while down the road the millionaires have their unlived in luxury investments, with spare change left over for cars and yachts.
Dear Patrick B (at 2020/07/02 at 8:33 pm)
I was aware of the ‘luxury’ juxtaposition with the minimum wage, which is why I said it is probably not a great example.
But I used it because it was an example, one of few available (prices on Internet in all currencies), of a standardised commodity that is exactly the same in all nations.
best wishes
bill
Very insightful analyses by Bill, thanks so much once again as always, for the knowledge sharing.
Last time, you explained the unemployment situation among the Australian population. Now, you explained the way the latest minimum wage setting will affect them, with complete evidences.
Bleak outlook for these group of workers!
Taken together, one can predict very well the appropriate fiscal policies and required expansions to offset this shortfalls, if one wishes to steer the economy for realistic survival for the months to come.
Bill, I wasn’t trying imply that minimum wage workers in Australia are somehow fat cats.
I don’t think anyone working for minimum wage in either country will be buying a Tesla; there simply is no possibility for savings, and minimum wage workers have difficulty even meeting the credit criteria to qualify for an apartment to live in, no matter how many jobs they work.
Perhaps if Tesla just gave all the minimum wage workers a car they could live in it and get around to all their workplaces on time, provided they could at least pay the insurance.
I was hoping to embarrass our rulers though.
What did we expect? That an economic system built upon, fueled by–WORSHIPING–crippling austerity for the masses and wanton exploitation of people and planet would suddenly, as a consequence of a pandemic, find a heart? As Bill is fond of saying, MMT is but a LENS through which to observe and analyze the operation of our current fiat money system. Given that this operation is controlled by plutocrats and imperialists, how could the view through the MMT lens be a pretty one? MMT is somewhat like a conscientious journalist in a war zone (alas, a vanishing breed), who observes and reports, sometimes even ferrets out, what is happening at Ground Zero (God, how I hate that term). When the conscientious journalist becomes aware of this or that atrocity, he or she feels duty-bound to report it BUT TO DO NOTHING MORE. You see, he or she is only a journalist, an observer and reporter, and thus it would be inappropriate, out-of-character–actually WRONG–were he or she to attempt to DO anything about the atrocity other than document it and perhaps discuss it. The DOING of something, if something is to be done, even if it cries out to done, is someone else’s business, someone else’s role, someone whose duty or job is to DO THINGS instead of only documenting and discussing them. Lest anyone think I’m singling out MMT here, let me hasten to say that the above description applies to ALL academics in EVERY discipline. And let me also hasten to say that this description does NOT apply to Bill, who throws himself with seemingly inexhaustible energy into righting the wrongs he observes and describes with such extraordinary detail and accuracy. But let us be clear about this, as Bill himself is clear about MMT being a value-free lens. When Bill so admirably throws himself into righting wrongs, even those–ESPECIALLY those–which seem to be futile fights from the get-go, he does so as a MAN, as a human being, NOT as an academic. Academics, like journalists, can help us become aware of something, understand it, figure out ways to impact or change it. His knowledge is what makes Bill’s actions effective, to the extent they can be, but that action comes from an entirely different place than his knowledge–what Bill calls values; others, a soul. So yes, let us learn all we can by peering through the MMT lens at Ground Zero, but let us not leave it there, tell ourselves that we must not step outside the boundaries of our social and professional roles–either as society defines them or as we ourselves would choose to define them–that it’s OK to continue, perhaps for a lifetime, merely to observe, report, and discuss. No, God no, let us be men and women who choose to be human beings FIRST, role-players second, and let Captain Picard’s favorite order forever ring in our ears: “ENGAGE!”
Boy…. Newton Finn, you’ve beaten all the acknowledgement passages in all the theses I have read in recent times! You will do well as a copy writer, if you are not one already.
I am somewhat convinced that alot of our problems can be dramatically lessened if people have some curiosity and start reading to find out why the system is so rotten.
Bill,
Jessica Irvine has an article on MMT in today’s Melbourne Age. It contains a number of inaccuracies on debt and the Job Guarantee.
I thought you might want to read it and perhaps respond if you want to correct her article.
The Conversation published an article on MMT today by Ross Guest. It has so many flaws it is difficult to know where to start.
Dear Allan (at 2020/07/03 at 10:50 am)
Simple answer: don’t start anyway. The Conversation is a disgrace and regularly publishes this sort of drivel masquerading as academic opinion backed by research evidence.
That is why I refuse to write for them despite previous requests.
best wishes
bill
I’ve seen the McDonalds Big Mac used as a rather more mundane PPP comparator, if that helps anyone. This is not an endorsement of eating any McDonalds products, mind you, but given their ubiquity and the fact that they are more likely to actually be purchased by minimum wage earners, it may be useful:
https://www.economist.com/news/2020/01/15/the-big-mac-index
Here in Canada I believe that the minimum wage is set Provincially, so I’m guessing that $11.06 figure is an average? In Ontario where I live it’s $14.00, but the current Progressive Conservative (the jokes just write themselves, eh?) government put their stamp on things by cancelling a planned increase as one of their first actions upon being elected in 2018. Their slogan is, “Ontario, open for business”
Neoliberal to the core, I’m afraid …
It’s the same here in the US–set by state. I’m in NY and the minimum wage went up to $15/hr. this past January. The Federal Government has a minimum wage, but I’m ashamed to say that I don’t remember what it is right now, but I do remember hearing that it went up recently, as well. So, for the example above, a New Yorker earning minimum wage would have to work 5332 hrs. to earn enough to buy a Tesla at the price quoted above. I actually like the example above and wish someone would explore this further with more examples to show how inadequate minimum wages generally are.
Eg: It appears that $11.06/hr for “Canada” is a fictional number derived who knows how?
It is the number a google search gave at the time I mentioned it , and Bill confirmed shortly thereafter. Interesting, when google, at the same time, says the provincial minimum wage is $11.65 in Newfoundland/Labrador and Manitoba. and that the minimum is $15.00 in Alberta.