Over the last several years, I have been indicating that I think we are in…
Back to the future – employment freezes – they only degrade services
A report in the The Washington Post (January 23, 2017) – The Trump administration just told a whopper about the size of the federal workforce – caught my attention earlier this week because it cut across some work I had been doing on public employment. The headline is self-explanatory – the accusation was that Sean Spicer lied in his first press briefing following the inauguration of the new President. The reporter in question (Christopher Ingraham) promoted his article with a Tweet and accompanying image which was then circulated widely on the Internet. The graph is what attracted my attention given that I rarely read the Washington Post, since it sold pages to the likes of Peter Peterson and allowed propaganda to parade as news. In this case, the problem was that the graph provided was highly misleading and didn’t refute anything that Sean Spicer had said about US federal government employment. Spicer had lied. But the Washington Post tweet didn’t prove that. This failing highlights an often-made confusion in the public – the difference between proportions and levels and the way graphs can lure us into wrongful conclusions. The sort of puzzle that young students in statistics are taught to work through. The other point is that employment freezes degrade public services and end up not saving cash anyway.
On January 23, 2017, the new White House Press Secretary, Sean Spicer gave a long press briefing to the Washington press gallery. The Press Briefing video goes for 2:15:49 but the relevant statement was at the 44:44 mark.
Spicer said that:
Finally, the President issued a memorandum outlining executive branch hiring. This memorandum counters the dramatic expansion of the federal workforce in recent years. In particular, it prevents filling vacant positions and creating new positions except when necessary to meet national or public security responsibilities. It does not apply to military personnel. And it ensures that American taxpayers get effective and efficient government.
Okay, a freeze on federal government hiring other than within the Defense Department. Pretty much typical Republican-type position.
The two-page memorandum (January 23, 2017) – Presidential Memorandum Regarding the Hiring Freeze – outlines the operational details.
The freeze will precede the publication (within 90 days) of “a long-term plan to reduce the size of the Federal Government’s workforce through attrition” produced by the Office of Management and Budget (OMB) in liaison with the Office of Personnel Management (OPM).
It also prohibited any “Contracting outside the Government to circumvent the intent of this memorandum”.
It instructs department managers to “seek efficient use of existing personnel and funds to improve public services and the delivery of these services”, which means it believes there is the capacity within the public service to deliver more with less – again a common assumption of the conservatives (and neo-liberal progressives).
In Australia, the conservatives (and that includes both sides of politics) have made an art form of the term “efficiency dividend” where they cut public employment and expect better services to be delivered.
The evidence from most nations is that if there was ever slack in public sector bureaucracies, decades of scrutiny by neo-liberal administrations have weeded it out and what results from further cuts in the name of ‘efficiency’ are degraded public service delivery – in scope and quality.
The recent Centrelink debacle where computer algorithms are now doing complex matching of welfare payments and tax records because there are not enough staff left to actually perform the tasks reasonably is a classic result of this search for efficieny – but which is really just an ideological bean-counter type attack on public workers.
In the Centrelink case, the vast majority of debts claimed against the poorest citizens in Australia as a result of the ‘algorithm’ have proven to be wrongful. Please read my blog – The Centrelink letters – a clear breach of human rights – for more discussion on this point.
On the same day (January 23, 2017), the relevant union, AFGE (American Federation of Government Employees) issued a statement – President Trump’s Federal Hiring Freeze Will Cost Taxpayers and Hurt Americans – pointing out that the freeze and subsequent plan (within 90s days) was rather odd for a President who campaigned on his capacity to generate jobs.
It argued that:
Numerous studies have shown that contractors are two to three times more costly than each federal employee they replace …
A result that spans the globe really. Cutting public servants always means “longer lines at Social Security offices, fewer workplace safety inspections, less oversight of environmental polluters, and greater risk to our nation’s food supply and clean water systems”.
Remember the floods in Britain – see my blog – Austerity is the enemy of our grandchildren as public infrastructure degrades – for more discussion on this point.
There are countless examples in the literature of how public services degrade when these sorts of cuts are made.
But that is a separate issue to the point to be made.
Here is the graph that the Washington Post tweeted to promote their story.
The title says “A shrinking federal government” and the declining line is quite stark and obvious. The heading would leave one to conclude that the size of federal workforce has been shrinking since the 1950s.
And the Tweet opined that “Spicer says there’s been a ‘dramatic expansion of the federal workforce in recent years.’ This is unequivocally false.”
Well, the graph neither shows a “shrinking” federal workforce nor counters Spicer’s lies.
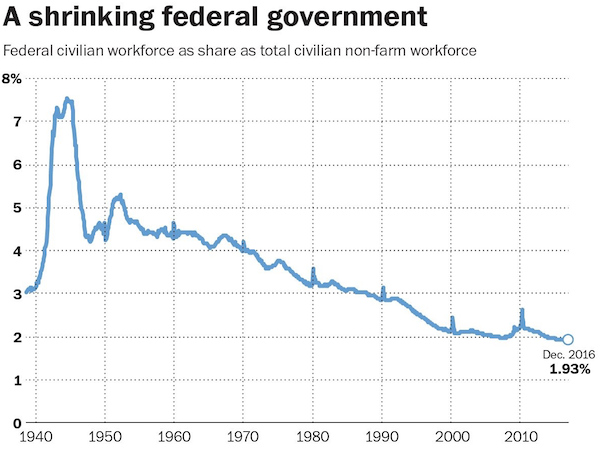
All it shows that as a proportion or share of total civilian non-farm employment in the US, the federal government accounts for less. It doesn’t tell us about levels of employment at all – one way or another.
Later, the journalist provided an new graph (the second one in his article). I didn’t see that being retweeted much (but that is, in part, a function of my network reach as much as anything).
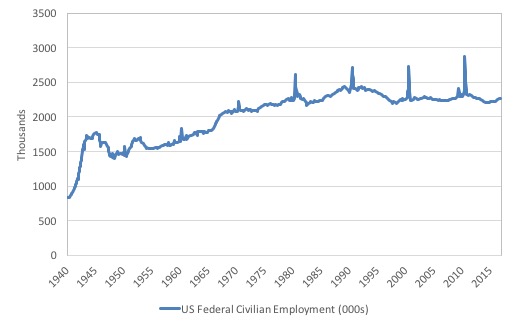
The second graph shows the level of the US Federal civilian workforce, which allows us to determine whether Spicer was telling the truth or not.
It might be that Spicer has a different definition of the term “dramatic” but if he broadly shares the meaning with the rest of us then he lied.
The following graph (using US Bureau of Labor Statistics data) shows the US Federal civilian workforce since January 1940 (data series CES9091000001 less CES9091911001).
Total federal employment has been held around 2,200 thousand or thereabouts since the early 1970s. That is why the share of federal employment has declined so dramatically as the US economy has grown and the population (and overall labour force) has expanded.
The next graph zooms in on the Obama period.
When Barack Obama took office (January 20, 2009) total Federal employment was 2775 thousand and by December 2016 it had grown by 24 thousand to 2799 – an average annual rate of growth of 0.1 per cent.
In other words, virtually not at all.
But claims that federal employment have shrunk over the Obama period are wrong as are claims that it has “dramatically increased”.

The question then is – with this employment freeze – how has the government been able to maintain services with such a ‘shrinking’ share of total employment. The Post article correctly points out the massive increase in outsourcing – the consulting trough!
But these federal hiring freeze stunts are not new in the US. President Carter (Democrat) introduced three such freezes in his time as President.
And, with great fanfare, on January 20, 1981, the newly inaugurated President Reagan issued the – Memorandum Directing a Federal Employee Hiring Freeze – on the grounds that (wait for it) “the national budget is out of control”.
The archives show that he couldn’t wait to sign the order (doing it on Capitol Hill immediately following his inauguration rather than waiting to get back to the White House). The fervour of an ideologue!
All the usual nonsensical anti-government slogans were there:
1. “controlling the growth and size of government and stopping the drain on the economy by the public sector.”
2. “This begins the process of restoring our economic strength and returning the Nation to prosperity.”
There was considerable opposition to the freeze at the time and it was pointed out that no actual reductions in government outlays occurred.
The US Comptroller General (the General Accounting Office, now called the Government Accountability Office) performed an audit in 1982 and released the analysis on March 10, 1982.
The audit report – Recent Government-wide Hiring Freezes Prove Ineffective In Managing Federal Employment – challenged the Reagan Administration’s claim that “the hiring freeze” would “reduce the size and cost of the Federal work force”.
The investigation found that:
1. While “Publicity surrounding the hiring freezes has helped create an impression that they substantially reduce the size and cost of Government … the recent Government-wide hiring freezes have not been an effective means of controlling Federal employment.”
2. “While the Government-wide hiring freezes … provided an illusion of control on Federal employment and spending, they had little effect on Federal employment levels …”
They found that:
– the freezes did not substantially reduce employment,
– some agencies compensated for the freezes by hiring part-time and temporary employees,
–some agencies compensated for freezes by using contractors or overtime, and
–some agencies hired more employees than allowed.
3. “Because they ignored individual agencies’ missions, workload, and staffing requirements, these freezes disrupted agency operations, and in some cases, increased costs to the Government.”
The problem was that the freezes:
– caused decreased oversight of Federal programs by making it more difficult for the Inspector General offices to do their jobs:
– caused lost revenue and uncollected debts;
– increased the cost of Government operations by causing inefficient staff utilization and clerical shortages , and by damaging recruiting efforts …
The Report was a categorical condemnation of this sort of knee jerk policy decision.
But as we know – neo-liberals forget history as soon as it happens and when they somehow remember it they quickly revise it to suit themselves.
It is also the case, that Republicans haven’t been very good at cutting US federal employment.
The accompanying Table shows the US federal employment status for each of the US Presidents since the Democrat Harry S. Truman took office on April 12, 1945.
It shows the level of federal employment at the start and end of each Administration, the change (in 000s) for total, civilian and defence; and the annual growth in total federal employment during the period of office (%).
The Clinton presidency stands out. He savaged federal employment with a loss of jobs overall of 356 thousand (divided between the civilian and military) at an average rate of decline of 1.4 per cent per annum.
Far from cutting total employment, Ronald Reagan expanded it by 195 thousand (0.8 per cent on average per annum)
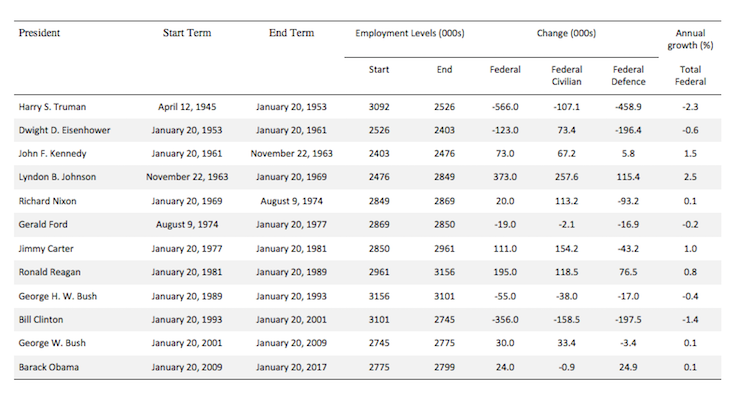
The Party breakdown in net terms (across all relevant Presidents):
1. Republicans: Total federal +48 thousand; Federal civilian 298.4 thousand; Defense department -250.4 thousand.
2. Democrats: Total federal -341.0 thousand; Federal civilian 212.5 thousand; Defense department -553.5 thousand.
That conclusion should be tempered with the retrenchment of the military that Harry S. Truman engaged in as peace resumed after the Second World War.
If we take that outlier out then Democrat Presidents have added in net terms 225 thousand jobs.
Conclusion
I think many misperceptions are clarified by the data presented in this blog (and the actual Washington Post article – not the first Tweet).
We now know that Spicer is a liar despite earlier in that press conference promising to tell the truth the American people.
We now know that US federal employment is higher now than it was just before the GFC, but not by much.
We now know that Republican presidents overall have added to total US federal employment while Democrat presidents have cut it.
We also know that employment freezes degrade public services but don’t accomplish reductions in government spending or public employment.
That is enough for today!
(c) Copyright 2017 William Mitchell. All Rights Reserved.
The idea of the media calling anyone a liar is laughable.
“Bill Mitchell reports that Federal Employment grew by 24% under Obama” would be a grossly unfair headline given the rest of your article and all the data provided. All the same, you might want to correct that typo.
But Washington Post is somewhat more “true”, a reasonable way to measure had been government workforce per 100 thousand population or alike. I suppose share of non-farm workforce come close to that.
That’s the only reasonable way to make country comparison. The need of gov. workforce is significantly different on Island vs USA.
But it should also take in to account how responsibilities have shifted from federal to local gov. and vice versa.
Doesn’t neoliberal policy’s also want to shift from federal level to local? Which as a part of the economy must balance its budget. And is a much weaker negotiator vs big business than the state/federal level.
All under the disguise of subsidiarity and closer to the people. When in fact it is to avoid dreadful gov. deficits that can be created out of thin air if it want to.
Being a liar is nothing new in government nor in the MSM. Now that Trump has it out in the open it has encouraged the usual suspects to get in a lather about it. The hypocrisy is actually worse than the lies. It might make some unwisely to think lying didn’t happen much before Trump’s ascendency. You look in press conferences where a reporter asked Trump if he would tell the truth in future. Trump should have rejoindered asking the same of the media. The “household analogy” comes easily to mind.
Still, there may be an advantage for the future if we got the message that lies are currency of every day.
Here is Federal employees per 100k
https://s26.postimg.org/9qbavyqux/us_fed_employ_min_Def.png
Trump claim he want to make America Great Again, due to decay in the latest decades. I suppose America was Great back then when it had about 40% more fed. employees per 100k?
And two diagram from some blog that I don’t know the authentic of. But the first is some estimate of private contractors hired by gov.
https://s26.postimg.org/3qnjsb62h/empl_contract.png
the second claim to be real Fed, state and local gov. per capita spending from 1990 – 2012, don’t know the source of the data and if it’s cleaned from double counting of federal spending, i.e. first as fed. then as state/local.
https://s26.postimg.org/luqkcy3qx/exp_fed_state_local.png
First time here, after watching the utube by Steven Hail (2014). Getting exposed to Modern Monetary Theory.
Article is good, except the end. The last table is misleading; it didn’t include contractors. Yet the article highlighted how much more expensive and trendy contracting has been (since John Howard too!).
Surely, a better table would include contractors. This would compare the POTUS better.
Dear Herman K (at 2017/01/26 at 3:15 pm)
Yes it would be good to get a gauge on the contract labour used but there is no coherent data to allow that. You can estimate it from various departmental fiscal statements but even then it is mostly guesswork. That is why I chose to ignore it. It has certainly expanded in use since Clinton was President.
best wishes
bill