The Australian Bureau of Statistics (ABS) released the latest labour force data today (June 25,…
Australia – weak employment growth, rising unemployment – need for policy shift
The latest labour force data released today by the Australian Bureau of Statistics – Labour Force data – for December 2016 shows total employment barely increased and the ABS said the trend to part-time work remains. Over the last 12 months, Australia has lost 34 thousand full-time jobs (in net terms) and added only 91.5 thousand overall. This status as the nation of part-time employment growth carries many attendant negative consequences – poor income growth, precarious work, lack of skill development etc. The teenage labour market remains in a poor state and went backwards in December. It requires urgent policy intervention. Overall, with weak private investment now on-going and real GDP contracting (in the September-quarter), the Australian labour market is weak and there needs to be a policy shift. It is clear that the current policy position adopted by the Federal government is not sufficient to redress the inadequate non-government spending growth.
The summary ABS Labour Force (seasonally adjusted) estimates for December 2016 are:
- Employment increased by 13,500 (0.1 per cent) with full-time employment increasing by 9,300 and part-time employment increasing by 4,200.
- Unemployment increased by 14,700 to 741,100 – second consecutive month of increase.
- The official unemployment rate rose by 0.1 points to 5.8 per cent.
- The participation rate rose by 0.1 points to 64.7 per cent. Its behaviour has been quite erratic over the last 6 months. It remains well below its November 2010 peak (recent) of 65.8 per cent.
- Aggregate monthly hours worked increased 6.9 million hours (0.42 per cent).
- The monthly (unadjusted) broad labour underutilisation data for December 2016 rose by 0.7 percentage points to 14.7 per cent. This ratio has risen by 1.2 percentage points since October 2016. Underemployment was estimated to be 9.1 per cent.
- The latest quarterly broad labour underutilisation data was published last month. Underemployment 8.3 per cent of the labour force in the November quarter. The total labour underutilisation rate (unemployment plus underemployment) was 14.1 per cent. There were 1,059.4 thousand persons underemployed and a total of 1,784.5 thousand workers either unemployed or underemployed.
Article on Job Guarantee versus Basic Income Guarantee
The ABC published an article that I had some input into today – Why a universal basic income is a poor substitute for a guaranteed job – by Claire Connelly, a freelance journalist in Australia.
It generally makes all the relevant points and is worth reading and spreading.
Employment growth – remains weak
Employment rose by a miserly 13,500 in December 2016 with full-time employment increasing by 9,300 and part-time employment increasing by 4,200.
I indicated several months ago that Australia was becoming a part-time employment nation. That trend has not been reversed by these figures.
The ABS said that in terms of its trend data:
Over the past year we have seen a shift towards part-time employment, particularly in the first half of 2016. There are now around 120,900 more people working part-time than there were a year ago, and around 35,300 fewer people working full-time. Since December 2015, the share of part-time employment increased from 31.1 per cent to 31.9 per cent
In seasonally-adjusted terms, 137.2 per cent of the net jobs created in Australia in the last 12 months have been part-time.
The zig-zag pattern that we have observed over the last 36 months or so – where the employment estimates have been switching back and forth regularly between negative employment growth and positive growth with the occasional spikes – continues.
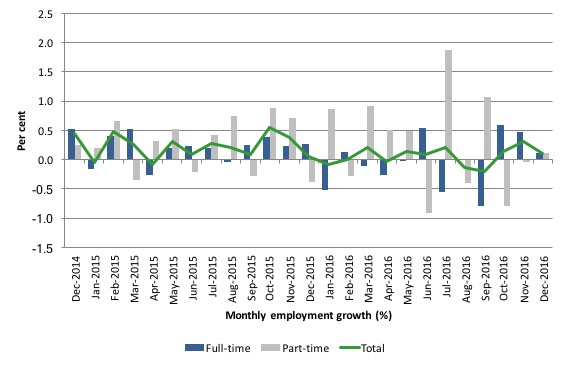
The following graph shows the month by month growth in full-time (blue columns), part-time (grey columns) and total employment (green line) for the 24 months to December 2016 using seasonally adjusted data.
It gives you a good impression of just how flat employment growth has been over the last 2 years. You can also see the dominance of part-time employment growth over the same period, especially in the last year or so.
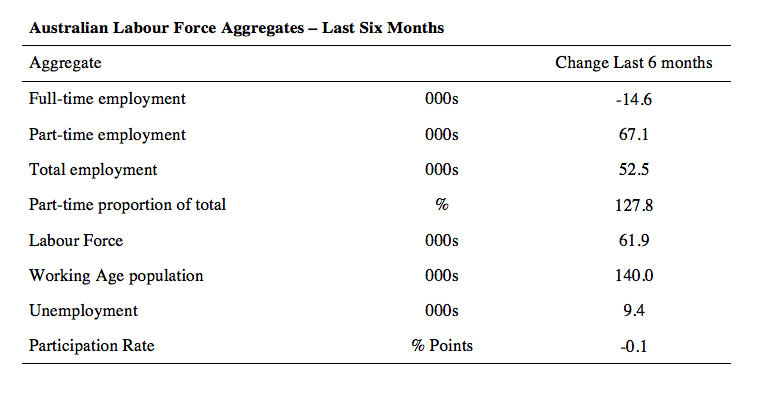
The following table provides an accounting summary of the labour market performance over the last six months. The monthly data is highly variable so this Table provides a longer view which allows for a better assessment of the trends. WAP is working age population (above 15 year olds).
Full-time employment has risen fallen by 14.6 thousand jobs (net) over the last 6 months, while part-time work has risen by 67.1 thousand jobs.
The conclusion – overall there have only been 52.5 thousand jobs (net) added in Australia over the last six months while the labour force has barely increased (up 61.9 thousand). Employment growth has thus failed to keep pace of the sluggish labour supply growth with the result that unemployment has risen by 9.4 thousand.
Overall – a very weak labour market.
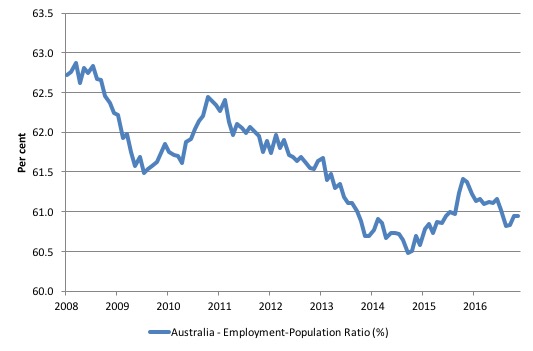
Given the variation in the labour force estimates, it is sometimes useful to examine the Employment-to-Population ratio (%) because the underlying population estimates (denominator) are less cyclical and subject to variation than the labour force estimates. This is an alternative measure of the robustness of activity to the unemployment rate, which is sensitive to those labour force swings.
The following graph shows the Employment-to-Population ratio, since February 2008 (the low-point unemployment rate of the last cycle).
It dived with the onset of the GFC, recovered under the boost provided by the fiscal stimulus packages but then went backwards again as the last Federal government imposed fiscal austerity in a hare-brained attempt at achieving a fiscal surplus.
The ratio began rising in November 2014 which suggested to some that the labour market had bottomed out and would improve slowly as long as there are no major policy contractions or cuts in private capital formation.
However, the peak in November is now gone and the ratio is once again in retreat or flat.
The on-going fiscal deficit is still supporting some growth in the economy as the spending associated with the mining boom disappears. But the deficit is clearly too small given the behaviour of the real aggregates.
The series fell by 0.1 points in December 2016 at 60.9 per cent and remains a staggering 2 points below the April 2008 peak of 62.9 per cent.
There is no good news here.
Teenage labour market – going backwards in December
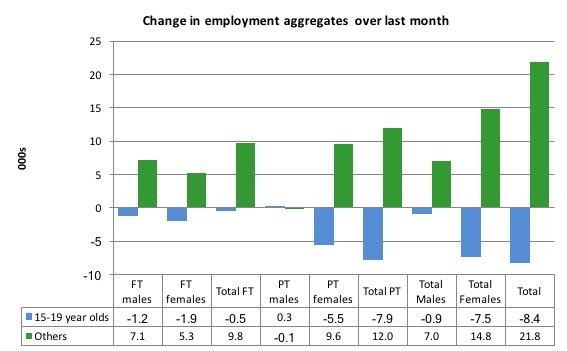
The teenage labour market saw full-time employment fall by 0.5 thousand jobs and part-time employment fall by 7.9 thousand (net) jobs in December 2016.
Total employment thus fell by 8.4 thousand (net), which continues the poor performance of this segment of the labour market.
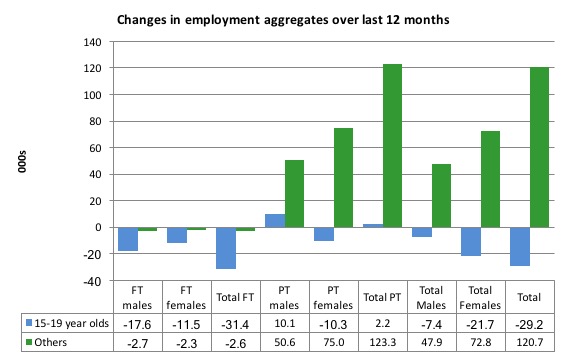
The following graph shows the distribution of net employment creation in the last month by full-time/part-time status and age/gender category (15-19 year olds and the rest)
Over the last 12 months, teenagers have lost 29.2 thousand (net) jobs overall while the rest of the labour force have gained 120.7 thousand net jobs. Remember that the overall result represents a fairly poor annual growth in employment.
Full-time employment for teenagers over the last 12 months has fallen by 31.4 thousand and they have barely participated in the part-time employment growth (where they are traditionally strongly represented).
The teenage segment of the labour market is being particularly dragged down by the sluggish employment growth, which is hardly surprising given that the least experienced and/or most disadvantaged (those with disabilities etc) are rationed to the back of the queue by the employers.
The following graph shows the change in aggregates over the last 12 months. It is as if the teenagers have not had a stake in the labour market either way (blue bars barely visible).
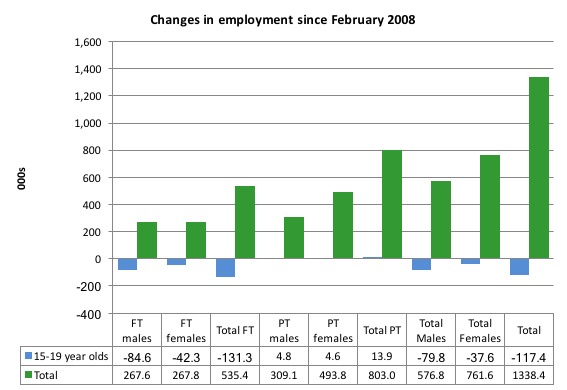
To further emphasise the plight of our teenagers, the following graph extends the time period from February 2008, which was the month when the unemployment rate was at its low point in the last cycle, to the present month (December 2016). So it includes the period of downturn and then the so-called ‘recovery’ period. Note the change in vertical scale compared to the previous two graphs.
Since February 2008, there have been only 1,338.4 thousand (net) jobs added to the Australian economy but teenagers have lost a staggering 117.4 thousand over the same period. It is even more stark when you consider that 131.3 thousand full-time teenager jobs have been lost in net terms.
Even in the traditionally, concentrated teenage segment – part-time employment, teenagers have gained only 13.9 thousand jobs (net) even though 803.0 thousand part-time jobs have been added overall.
Overall, the total employment increase is modest. Further, around 60 per cent of the total (net) jobs added since February 2008 have been part-time, which raises questions about the quality of work that is being generated overall.
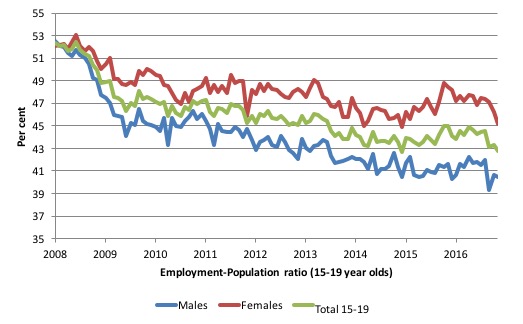
To put the teenage employment situation in a scale context the following graph shows the Employment-Population ratios for males, females and total 15-19 year olds since February 2008 (the month which coincided with the low-point unemployment rate of the last cycle).
You can interpret this graph as depicting the loss of employment relative to the underlying population of each cohort. We would expect (at least) that this ratio should be constant if not rising somewhat (depending on school participation rates).
The facts are that the absolute loss of jobs reported above is depicting a disastrous situation for our teenagers. Males, in particular, have lost out severely as a result of the economy being deliberately stifled by austerity policy positions.
In the latter months of 2015, with the part-time employment situation improving, there was some reversal in the downward trends in these ratios.
However, that short improvement has now disappeared and the rations are once again trending downwards.
The male ratio has fallen by 12 percentage points since February 2008, the female ratio has fallen by 5.9 percentage points and the overall teenage employment-population ratio has fallen by 9 percentage points. That is a substantial decline in the employment market for Australian teenagers.
The other staggering statistic relating to the teenage labour market is the decline in the participation rate since the beginning of 2008 when it peaked in January at 61.4 per cent. In December 2016, the participation rate was just 52.3 per cent (a decline of 1.9 points since August, the most recent peak).
That is an additional 134.7 thousand teenagers who have dropped out of the labour force as a result of the weak conditions since the crisis.
If we added them back into the labour force the teenage unemployment rate would be 30.3 per cent rather than the official estimate for December 2016 of 18.2 per cent.
Some may have decided to return to full-time education and abandoned their plans to work. But the data suggests the official unemployment rate is significantly understating the actual situation that teenagers face in the Australian labour market.
Overall, the performance of the teenage labour market remains extremely poor. It doesn’t rate much priority in the policy debate, which is surprising given that this is our future workforce in an ageing population. Future productivity growth will determine whether the ageing population enjoys a higher standard of living than now or goes backwards.
I continue to recommend that the Australian government immediately announce a major public sector job creation program aimed at employing all the unemployed 15-19 year olds, who are not in full-time education or a credible apprenticeship program.
Unemployment increased by 14,700 to 741,100
The official unemployment rate rose 0.1 points to 5.8 per cent in December 2016 as a result of poor employment growth and a rising participation rate.
Overall, the labour market still has significant excess capacity available in most areas and what growth there is is not making any major inroads into the idle pools of labour.
The following graph shows the national unemployment rate from February 1978 to December 2016. The longer time-series helps frame some perspective to what is happening at present.
After falling steadily as the fiscal stimulus pushed growth along, the unemployment rate slowly trended up for some months.
It is now above the peak that was reached just before the introduction of the fiscal stimulus. In other words, the gains that emerged in the recovery as a result of the fiscal stimulus in 2009-10 have now been lost.
Given the weak (negative) employment growth, the unemployment rate would be much higher if the labour force was growing as previous trend rates (see analysis below).

Broad labour underutilisation – rises sharply to 14.7 per cent
The ABS publishes monthly and quarterly labour underutilisation data. The quarterly data will be updated in March 2017 (for the February quarter).
The monthly underutilisation series shows that (in unadjusted terms), broad labour underutilisation (the sum of unemployment and underemployment) rose sharply in December 2016 to 14.7 per cent (males 12.9 per cent, females 16.9 per cent).
This rate rose by 0.7 points since November 2016 and 1.2 percentage points since October 2016.
The breakdown for December 2016 (in original terms, no seasonal adjustment):
1. Unemployment 5.6 per cent (males 5.7 per cent, females 5.5 per cent).
2. Underemployment 9.1 per cent (males 7.2 per cent, females 11.3 per cent).
3. Total underemployment 1,165.0 thousand persons.
The ABS published its quarterly broad labour underutilisation measures for the November-quarter 2016 in last month’s data release.
In the August-quarter, total underemployment was 8.3 per cent (1,059.4 persons – down by 40.7 thousand or 3.7 per cent since May) and the ABS broad labour underutilisation rate (the sum of unemployment and underemployment) was 14.1 per cent (down by 0.2 percentage points).
There were 1,059.4 thousand persons underemployed and a total of 1,784.5 thousand workers either unemployed or underemployed.
Clearly, the monthly data is showing a further deterioration in the broader indicators of labour market well-being.
The following graph plots the history of quarterly (seasonally-adjusted) underemployment in Australia since February 1978 to the November-quarter 2015.
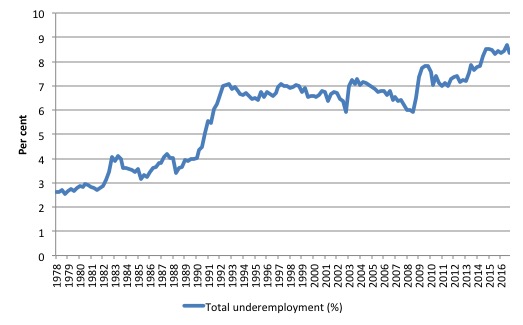
The next graph shows the evolution of the broad underutilisation rate over the same period. You can see the three cyclical peaks corresponding to the 1982, 1991 recessions and the more recent downturn.
Unemployment was a higher proportion of the two earlier peaks but underemployment now dominates the current cycle (just).
The other difference between now and the two earlier cycles is that the recovery triggered by the fiscal stimulus in 2008-09 did not persist and as soon as the ‘fiscal surplus’ fetish kicked in in 2012, things went backwards very quickly.
The two earlier peaks were sharp but steadily declined. The last peak fell away on the back of the stimulus but turned again when the stimulus was withdrawn.
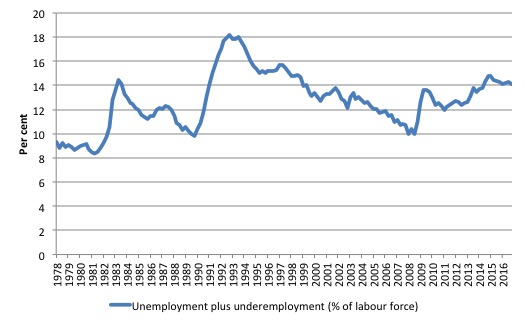
If hidden unemployment (given the depressed participation rate) is added to the broad ABS figure the best-case (conservative) scenario would see a underutilisation rate well above 16 per cent at present. Please read my blog – Australian labour underutilisation rate is at least 13.4 per cent – for more discussion on this point.
The next update will be for the February-quarter 2016 and will be published published in the March 2017 Labour Force release. In between those releases, the monthly estimates are available to guide our thinking.
Aggregate participation rate – rose by 0.1 points to 64.7 per cent but remains at depressed levels
The December 2016 participation rate rose by 0.1 points to 64.7 per cent. It had previously fallen by 0.4 pts in the August and September and was steady last month.
The participation rate remains substantially down on the most recent peak in November 2010 of 65.8 per cent when the labour market was still recovering courtesy of the fiscal stimulus.
The rising participation rate this month meant that the unemployment rose by 14.7 thousand even though total employment rose by 13,500 thousand.
The rising participation rate added an extra 12.8 thousand persons to the labour force (over the 15.4 thousand that were added as a result of underlying population growth).
So the weak employment growth was unable to match the underlying population growth and the rising participation rate exacerbated this weakness.
If the participation rate had not increased the unemployment rate would have remained steady at 5.7 instead of rising to 5.8 per cent (from 5.6 per cent).
However, the participation rate remains at depressed levels.
What would the unemployment rate be if the participation rate was at the last November 2010 peak level value?
The following graph tells us what would have happened if the participation rate had been constant over the period November 2010 to December 2016. The blue line is the official unemployment rate since its most recent low-point of 4 per cent in February 2008.
The red line starts at November 2010 (the peak participation month). It is computed by adding the workers that left the labour force as employment growth faltered (and the participation rate fell) back into the labour force and assuming they would have been unemployed. At present, this cohort is likely to comprise a component of the hidden unemployed (or discouraged workers).
In recent months the gap between the lines has diverged which signals a deteriorating situation.
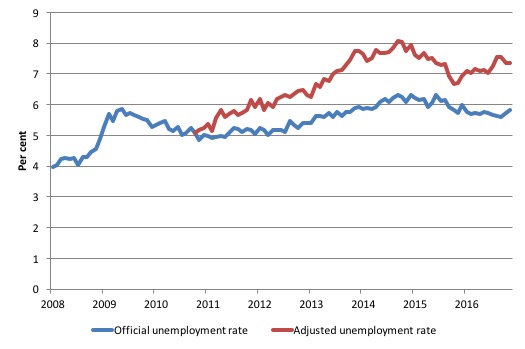
Total official unemployment in December 2016 was estimated to be 741.1 thousand. However, if participation had not fallen relative to November 2010, there would be 953.9 thousand workers unemployed now given growth in population and employment since November 2010.
The unemployment rate would now be 7.4 per cent instead of the official unemployment in December 2016 of 5.7 per cent.
The difference between the two numbers mostly reflects, the change in hidden unemployment (discouraged workers) since November 2010. These workers would take a job immediately if offered one but have given up looking because there are not enough jobs and as a consequence the ABS classifies them as being Not in the Labour Force.
There has been some change in the age composition of the labour force (older workers with low participation rates becoming a higher proportion) but this only accounts for less than 1/3 of the shift. The rest is undoubtedly accounted for by the rise in hidden unemployment.
Note, the gap between the blue and red lines doesn’t sum to total hidden unemployment unless November 2010 was a full employment peak, which it clearly was not. The interpretation of the gap is that it shows the extra hidden unemployed since that time.
This gap shrinks as participation rises relative to the November 2010 peak.
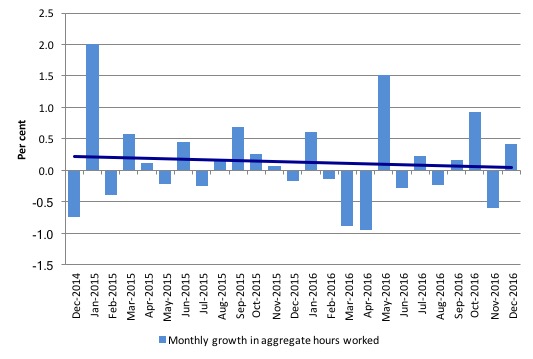
Hours worked – rose by a modest 0.42 per cent in December 2016
Seasonally-adjusted aggregate monthly hours rose by 6.9 million hours (0.42 per cent) in December 2016.
The following graph shows the monthly growth (in per cent) over the last 24 months. The dark linear line is a simple regression trend of the monthly change – which depicts a distinct negative trend
You can see the pattern of the change in working hours is also portrayed in the employment graph – zig-zagging across the zero growth line.
Conclusion
I repeat my standard monthly warning – we always have to be careful interpreting month to month movements given the way the Labour Force Survey is constructed and implemented.
Today’s figures show that the Australian labour market remains in a weak state and confirms that the September-quarter GDP figures, which showed real GDP growth being negative were probably part of a downwards trend.
Total employment barely increased and the ABS said the trend to part-time work remains.
Over the last 12 months, Australia has produced only 91.5 thousand (net) jobs with 125.5 thousand of them being part-time jobs. In other words, full-time employment has fallen by a disturbing 34 thousand (net) jobs over the same period.
This status as the nation of part-time employment growth carries many attendant negative consequences – poor income growth, precarious work, lack of skill development etc.
The teenage labour market went backwards in December with significant further full-time job losses.
The teenage labour market remains in a poor state and requires urgent policy intervention.
Overall, with weak private investment now on-going and real GDP contracting (in the September-quarter), the Australian labour market is weak and there needs to be a policy shift.
Australia needs a rather sizeable fiscal stimulus. My bet is that the Government will not have the good sense to introduce this required boost to total spending.
That is enough for today!
(c) Copyright 2016 William Mitchell. All Rights Reserved
ff Topic, Bill;
The Conversation has today an article by Richard Holden which has brought MMT supporters out in large numbers. many quoting your site and reputation. You might find it amusing as well as interesting:
https://theconversation.com/printing-more-money-isnt-the-answer-to-all-economic-ills-71334#comment_1185894
I repeat my comment on yesterday’s blog. The article by Richard Holden all utter tosh and should be treated with the contempt it deserves.
Holden seems to belong to the usual ‘Weimar/Zimbabwe’ school of thought -hardly worth arguing with and I’m sure Bill has better things to do!
I think the core of Holden’s errors, the key piece of mainstream illogic, the stumbling block to understanding MMT is expressed here in his:
“If the government prints money and doesn’t back that by issuing bonds then there is inflation.”
and
“don’t you understand the difference between printing money and printing money backed by bonds. really?”
Holden thinks there is a difference. But of course there is no difference. The idea that there is a difference, held by so many modern economists is utterly absurd. As FDR put it in his second fireside chat:
“Government currency & government credit are one and the same thing.”
This bizarre belief in a difference, that one piece of paper (or electrons) printed by a government called a “bond” can back another piece of paper called “money” is something which has weirdly captured even many dissenting economists, to the point that they can’t even see that it is a belief, a proposition which could be true or false- rather, they think of it as a law of thought. And so they don’t realize that many earlier economists and politicians understood how laughable, how self-contradictory it is.
This belief that one debt can back another debt, just because it pays interest is so comically self-contradictory that it is actually in Lewis Carroll, as Keynes noted in “Economic Possibilities for our Grandchildren”, referring Carroll’s lesser known work Sylvie & Bruno. I noticed the same passage myself before I read Keynes, as I had gotten that book as a birthday present long ago.
I just went over to the Richard Holden article on the conversation and fired a few shots. The well informed responses from students / followers of MMT is a wonderful thing to see.
The blokes got no idea and the MMT crowd are knocking down the house he’s built brick by brick.
Some Guy:
Perhaps another or alternative explanation is the fact that no risk bonds pay some interest that represents corporate welfare to the banks. There was a brief period in Australia when the Reserve proposed to discontinue them but there was pressure from the aforesaid banks to continue them and they succeeded in persuading the Reserve to do so. I think that is interesting.
Holden’s error is that he invents a claim that MMT is making, then refutes the invented claim. It’s the Chewbacca Defense (https://en.wikipedia.org/wiki/Chewbacca_defense)!
I am not an economist but I have been thinking about the taxation system for a number of years now and I would like to hear your opinion on it. Inam 78. In my view Nothing can be done until the taxation system is overhauled. I believe that income tax is a relic of the past and with its myriad of deductions and exceptions has created a monster unproductive industry designed to exploit those deductions and exceptions. If we look at the premise that everybody should contribute to the running of their country then it is failing dramatically. The extreme is the large international companies exploiting those loopholes but it happens at every level of society. Unfortunately the tax burden falls mainly on the wage and salary earners. With fewer and fewer people being wage and salary earners with many being required to be independent contractors, a new system of tax collection must be looked at. In a world where we are now told that cash is to be replaced with electronic transactions then the system I would like to see, based on Prof Tobin’s FTT of 1% of the 1970s, would be a gradual replacement of the existing income tax based system in its entirety with an FTT one. It would attach to all Bank electronic amd cash deposits, with the word ‘Bank’ being widely defined. It would be collected by the Banks and paid directly to Government. So, imagine, each time you paid someone then that amount would recorded in their bank statement as such and then the statement would show an amount of tax deducted and paid to Government. Now look at that from the very real picture of your and every persons grocery shopping at the supermarket. The amount collected each and every day is huge and would attract, even at a tax rate of 1%, a large revenue for Government. Then look at that nationwide. Businesses would not be adversely affected because remember they are now not paying any income tax and even if they tried to recover that revenue and increased prices it would be futile and not matter anyway because people would have more money in their pockets and any increase in prices would attract more tax revenue. An FTT is not difficult and is a simple and elegant system of taxation. The aim is to clean up the existing structure. There would be no income tax, no deductions and no GST, (which hurts the lower income people).The politics of how to spend the money comes later. We have to clean up the system first so that everybody contributes to the running of the country. My politics would then come into play because I believe that we could then consider the actual percentage rate for the FTT in order to seriously consider a UBI which would not only help our grandchildren but everybody who is being affected by the technological changes that are being foisted on us. We could also have a world class hospital system, a world class education system etcetera. I would also impose a progressive tax on all income over $100,000.00 and reintroduce the inheritance tax but that would be for the purpose of reducing inequality not revenue. This country could, to paraphrase America, be great again!
Patricia Smith,
Taxes do not fund government spending. The main issues today are income distribution and a lack of jobs.
Through a Jobs Guarantee the Government can become an employer of last resort.
It will also create more options for workers and force Businesses to lift their game with respect to income distribution.
If companies instead want to go abroad looking for cheaper labour options then let them. But tax them within an inch of their life for doing so when they want to sell their products in Australia.
Again, in relation to the Holden article, it was a great opportunity to debunk and challenge a mainstream economist as well as to spread the word on MMT.
Patricia, bill has written on a FTT previously under Tobin tax – look it up. He believes speculative financial trades that have no benefit should just be banned and I agree. Simpler solution to end the speculative profits from capital.
While I agree that the problem is the view that taxation DOES fund government spending, until that view is altered, which in my view will take forever – well certainly not within my lifetime – could we not look at an alternative form of taxation in the meantime and I do believe that the alternative I have suggested above would be the ideal.
Richard Holden probably did more to validate MMT today than he realises. And when a bunch of MMT lightweights put him and his Chicago School midwives on the canvas that easily he should be thankful the heavyweights like Bill, Warren, Randal, and Stephanie don’t enter the ring – it would have been a massacre.