In the annals of ruses used to provoke fear in the voting public about government…
Only the top-end-of-town in the US have seen real income gains since 1999
The US Census Bureau released the latest edition of the – Income and Poverty in the United States 2014 – yesterday (September 16, 2015) along with a treasure trove of Income data and Poverty data. The data comes from the 2015 Current Population Survey Annual Social and Economic Supplement. Enough detail to keep anyone of the streets for a considerable time! The data can tell a lot of stories if prompted in a variety of ways but what I was interested in exploring was the cyclical movement as the US economy started its recovery and is now, seemingly, reaching the end of the current upturn. Who has gained from the recovery in national income and to what extent have the massive losses incurred during the Great Recession been recovered? That is what the blog is about today. A data hunt!
One of the extraordinary things that we are reading at present with respect to the success of Jeremy Corbyn is that he is all hot air with no substance.
Whatever happened to the – UK Guardian – over the years is unknown to me but from its origins as the “radical Manchester Observer” (1821) to now there has been quite an ideological leap towards neo-liberalism.
Wikipedia claims it is Centre-left, which just goes to show how far the distribution has been skewed towards the right.
The UK Guardian article (September 16, 2015) – Corbyn’s Labour is a party without a point, led by a rebel with a cause – is a case in point.
My reading of the material and statements put out by the Corbyn camp is that he has a very distinct agenda. According the Guardian article “his views have not changed in 30 years … and I think that it’s a problem”. Corbyn is dismissed as a “unspun unmoderniser”.
Somehow modernity is about abandoning past held views. Things do change but there are also fundamentals that do not. The future is unknown but in macroeconomic terms there will be some basics that will still be there whatever new social media modality we are all clicking, swiping, pressing or whatever.
There are some values that do not become ‘old fashioned’ or ‘unmodern’. Modernity is not about abandoning value systems previously held and accepting some new values that just happen to favour a particular segment of the population over others.
Jeremy Corbyn and Bernie Sanders in the US are leading the political voices at present that are talking about who gets the income that is produced in the economy and what are we going to do about it if we don’t like the answer.
The patterns that we can draw out of the latest Census Bureau data exemplify what Corbyn and Sanders are on about. There is something deeply wrong with the way in which the economy distributes the income that is produced.
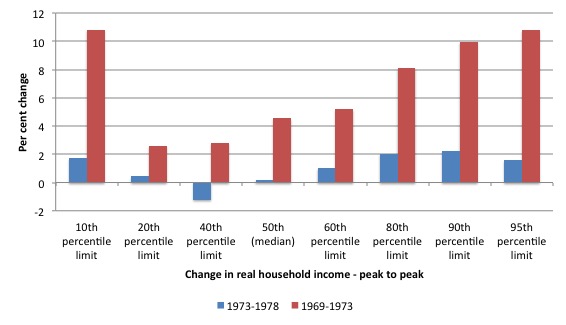
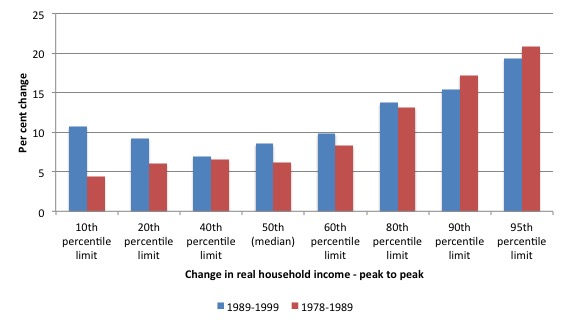
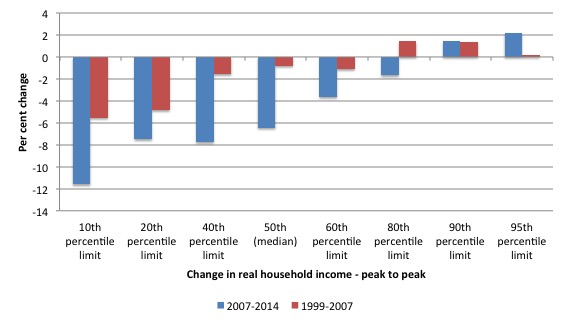
Using the real median household income (expressed in 2014 dollars) and the percentile limits for the 10th percentile, 20th percentile, 40th percentile, 50th (median), 60th percentile, 80th percentile, 90th percentile and the 95th percentile, I traced what happens after the peak of each cycle since 1969 through the downturn and back to the next peak. The peaks are calculated for median household income.
The following three graphs trace the six cyclical periods (2 per graph to make it easier to see the patterns).
In the first graph (with one exception), all income groups participated in each of the growth cycles that followed the downturn associated with each starting peak.
In the 1980s and 1990s, the growth in incomes between the peaks of each cycle was much more evenly (albeit still disparate) spread and all household benefited. Low income earners were clearly able to make gains in household income as the economy grew again.
This pattern changed dramatically in the last two cycles and the new pattern has clearly intensified. In the most recent cycle, associated with the GFC, the peak real Median Household income was achieved in 2007 ($US57,359).
Over the period 2007 to 2014, which incorporated a massive downturn and subsequent recovery in national income, which in real terms has grown by 7.3 per cent since 2007 (up until 2014) after taking a 3 per cent hit between 2007 and 2009.
The period was chosen because the December-quarter 2007 was the peak real GDP prior to the downturn.
Between the peak in 2007 and 2014, median real household income fell by 6.5 per cent (it was $US53,657 in 2014) but the lowest income earners (measured at the 10th percentile limit) have endured an 11.6 per cent decline.
The top-end-of-town have enjoyed real household income increases over the period (90th percentile limit and the 95th percentile limit), albeit somewhat subdued relative to early decades.
The other result that might surprise is that since the 1999 peak (that is the top of the previous cycle), real median household income in the US has declined by 7.2 per cent.
The impact on the lowest 10 percent of the income distribution has been dramatic – a 16.5 per cent drop in real household income.
Over that period (1999-2014), all but the top two cohorts shown have taken real household income losses. As the US Census Bureau note:
Comparing changes in household income at selected percentiles shows that income inequality has increased between 1999 (the year that house- hold income peaked before the 2001 recession) and 2014 … Incomes at the 50th and 10th percen- tiles declined 7.2 percent and 16.5 percent, respectively, while income at the 90th percentile increased 2.8 percent between 1999 and 2014. In 2014, the 90th to 10th percen- tile income ratio was 12.83, not statistically different from the 2013 ratio. Since 1999, the 90th to 10th percentile income ratio increased 23.1 percent.
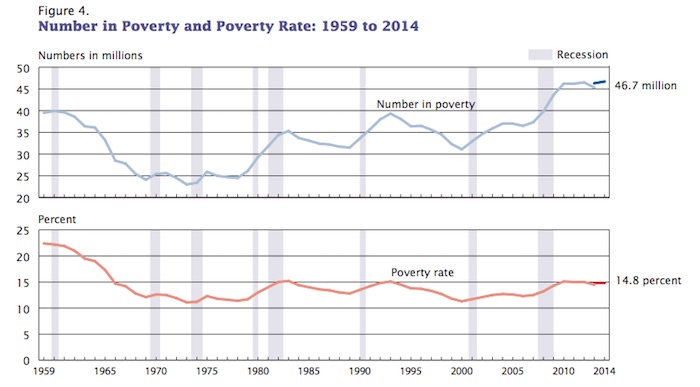
The upshot is that the poverty rate in the US has increased. The US Census Bureau says that “In 2014, the official poverty rate was 14.8 percent … The 2014 poverty rate was 2.3 percentage points higher than in 2007, the year before the most recent recession”.
The following graph comes from the Census Bureau publication. It shows the evolution of poverty in the US since 1959. The bottom panel is the poverty rate (which controls for scale).
It shows that in the recovery very little change in the poverty rate has occurred after its sharp rise in 2008.
Conclusion
What this data tells me is that the policy structures in the US have allowed a dysfunctional income distribution to evolve and intensify since the start of the current century.
It is unsustainable for a system to have workers producing more and more real income (that is, output) but only the top 10 per cent benefit from the production.
There are many intertwined factors involved that I will consider in later blogs.
1. The rise of the unproductive financial sector – which should be severely trimmed back to those activities that help real producers achieve some degree of certainty.
2. The capacity of workers to achieve real wages growth in line with productivity growth – the gap between the latter and the former has grown since the 1980s and had led to the redistribution of national income towards profits.
3. Persistent de-skilling and the hollowing out of middle-income jobs.
4. Persistent unemployment and underemployment – which have damaged household incomes and allowed bosses to suppress real wages growth.
5. Attacks on the income support system.
All these factors and more have been characteristic of the neo-liberal era. For a sustainable future there has to be major shifts in policy to address these issues.
The GFC was bad but the trends were in place long before the GFC hit and as I have argued before were causal factors in the emergence of the GFC.
The next crisis is awaiting us if we do not address the driving factors which are also producing the income distribution that this data summarises.
These are factors that Jeremy Corbyn and Bernie Sanders are clearly seeking to address. For the Guardian to say there is no agenda is just to signal they don’t want to know about the grass roots movements that are growing in protest to these trends.
Advertising: Special Discount available for my book to my blog readers
My new book – Eurozone Dystopia – Groupthink and Denial on a Grand Scale – is now published by Edward Elgar UK and available for sale.
I am able to offer a Special 35 per cent discount to readers to reduce the price of the Hard Back version of the book.
Please go to the – Elgar on-line shop and use the Discount Code VIP35.
Some relevant links to further information and availability:
1. Edward Elgar Catalogue Page
2. Chapter 1 – for free.
3. Hard Back format – at Edward Elgar’s On-line Shop.
4. eBook format – at Google’s Store.
That is enough for today!
(c) Copyright 2015 William Mitchell. All Rights Reserved.


Dear Bill
Averages and aggregates are statistical abstractions. Nobody consumes the whole pie or the average slice. The average Canadian woman has 1.6 child. Have you ever seen a woman with 1.6 child? People only consume their own slice. Conservatives prefer to talk about averages and aggregates because then they don’t need to talk distribution. I always use the following example. Suppose that there are 2 groups of 10 people. In group A, 9 people have an income 25,000 and the 10th has an income of 125,000, for a total of 300,000. In group B, 9 people have an income of 20,000 and the 10th has an income 180,000, for a total of 360,000. Which group is better off? Obviously, it is group A because 90% of the people in it are better off than in group B, even though total income in B is 20% higher.
Instead of asking about GDP growth, we should ask about how many people are becoming better off and by how much. Also, it is the growth of the smallest slices that matters the most. Let’s say that the poorest 90% have 50% of national income and the richest 10% also 50%. In case A, the poorest 90% enjoy an increase of 10% while the income of the top 10% is stagnant. That’s a GDP growth of 5%. In case B, the poorest 90% enjoy an increase of 2% and the richest 10% of 20%. Now GDP growth is 11%. Still, if you think that case B is better than case A, then you qualify for membership in the Republican Party. Only when nearly everybody is poor should we concentrate on making the whole pie grow.
Newspapers, instead of reporting GDP growth, should report how many people are becoming better off. Too bad that you don’t write for a mainstream newspaper.
Regards. James
James
A nice argument, but please check your sums.
9×25 + 125 = 350!
Otherwise, very sound.
Brian
Dear Brian
Thanks for pointing out this error. I always do these sums in my head, and this time my head failed me. I should have written that the 10th person in group A has an income of 75,000. Then it adds up to 300,000.
Cheers. James
Suzanne Moore is the author of the Guardian piece Bill critiqued and she isn’t very good. Instead of asking the principals, she talks with Corbynites and cites them as indicative of the state of the Labour Party. It is too early to do what she is trying to do, which is to predict in advance what is going to happen. She used to work for Marxism Today. So what. That was then. Now is now.
What she seems to have failed to notice in PMQ on Wednesday is what Corbyn did not do. And that was to combat Cameron’s reiteration, almost ad nauseum, of the Tory’s successful management of the economy and the fact that the good things that both he and Corbyn want can only be achieved by a growing economy, mentioning a number of times that taxation underwrites government spending and that governments must live within their means. Corbyn did not respond to any of this. He simply asked his six questions. Cameron actually didn’t really answer most of them, deflecting them by referring to their wonderful economic policies. Corbyn never followed any of this up.
This can be interpreted in a number of ways. One is that his team are still building their economic policy structure and, thus, to answer Cameron at this time would have been premature. Moore is right when she wrote that Corbyn can’t continue in this vein. I don’t expect him to, but I don’t know this for certain. But neither does she, and she is constructing what purports to be an argument with hardly any evidence to support it. The same goes for her contention that he despises the mainstream media. Well, Corbyn is right to say that they don’t produce decent “copy” and for that reason does not trust them. He is right to do so.
Moreover, I think she is wrong about why Varoufakis is liked. He is liked for the same reason Corbyn is liked – they say what they think without spin, and she advocates a spin doctor. Varoufakis rejects spin doctors. Moore has got Varoufakis wrong.
With two or three notable exceptions, Bill is right about the Guardian and the Observer. Under the Guardian, a good deal of this neoliberal shift has taken place under Rusbridger’s editorial regime.
Generals hoarding all the assets = kaput army
dumb; fails logic 101
Do the uber wealthy really think that if they hoard all of the assets that they’ll still have a functioning nation, culture or humanity?
Or are they simply not thinking enough, at all?
Something strange happened to the Guardian high-ups about 15 years ago that caused them to get into bed with the city. They adopted a neoliberal editorial policy, partnered up with Apax partners, took part in leveraged buyouts, set up a tax avoiding company, closed down the Scott Trust charity and replaced it with a privately owned limited company (Scott Trust Limited).
In response to being found out, Alan Rusbridger published an article which effectively said that the Guardian has to be neoliberal because there is no alternative. On twitter he also made a statement about Scott Trust Limited which is untrue. He said that Scott Trust Limited has no connections with HSBC. Had he done even the flimsiest of research he would have known that board members of Scott Trust Limited have connections with banking and HSBC specifically. Did he really not know?
My main theory is that London is run by an evil vampire race who farm their human cattle for food… but my second theory is that the staff at the Guardian are cowards who were easily corrupted.
Suzanne Moore also wrote for the Daily Mail.
Roger Erikson,
What you said reminded me of reading this from Marriner Eccles:
“It is utterly impossible, as this country has demonstrated again and again, for the rich to save as much as they have been trying to save, and save anything that is worth saving. They can save idle factories and useless railroad coaches; they can save empty office buildings and closed banks; they can save paper evidences of foreign loans; but as a class they can not save anything that is worth saving, above and beyond the amount that is made profitable by the increase of consumer buying. It is for the interests of the well to do – to protect them from the results of their own folly – that we should take from them a sufficient amount of their surplus to enable consumers to consume and business to operate at a profit. This is not “soaking the rich”; it is saving the rich. Incidentally, it is the only way to assure them the serenity and security which they do not have at the present moment.”
Hard to believe he was a wealthy conservative republican. Hopefully Bernie Sanders will use references to Eccles in his campaign.
Have you been to Equatorial Guinea, roger?
I like Richard Wolff’s straightforward, hard-hitting analysis that the gap between wages and productivity has been ‘rented’ out by the banks in the form of household debt-so it’s a sort of double whammy, creaming off and renting out -what a corker!
This should be a simple message to get across to populations but instead they cower, adopting the American Dream crap that they are poor and struggling because they haven’t worked hard enough. In the UK the Labour Party could have used this analysis as a hammer blow (though the duped populace might still not be able to eradicate their TINA-ed mind-set) – I suppose we’ve given up on politicians being educative -Corbyn has a chance but he has 210 of his MP’s against him-so it feels like a Myth of Sysiphus job!
“Have you been to Equatorial Guinea, roger?”
No. Why do you ask? Another well endowed military dictator controlling a sham army?
The Gambia is in the same boat.