Regular readers will know that I hate the term NAIRU - or Non-Accelerating-Inflation-Rate-of-Unemployment - which…
Eurozone unemployment – little to do with international competitiveness
The so-called ‘Informal European Council’ released a document on February 12, 2015 – Preparing for Next Steps on Better Economic Governance in the Euro Area: Analytical Note – which has been used as a background paper to batter the Greeks into submission in the latest round of the Eurozone crisis. It was published under the authorshop of Jean-Claude Juncker (President of the European Commission) with “close cooperation” with Donald Tusk (President of the European Council), Jeroen Dijsselbloem (President of the Eurogroup of Finance Ministers) and Mario Draghi (ECB boss). All that is missing is the Madame from the IMF to complete the Troika. This is a very dishonest document, deliberately framed to advance the austerity agenda and damage the living standards of some of the nations within the monetary union. It is hard how any serious economist would put their name to this sort of analysis.
The document opens with an extraordinary account of “The nature of Economic and Monetary Union”.
Factually, everything is fine. But what it denied is the interesting part.
It says that:
The euro is more than a currency. It is also a political project. Our monetary union requires Member States give up their previous national currencies once and for all and permanently share monetary sovereignty with the other euro area countries. The euro has thus created a “community of destiny” between the 19 Member States that share the euro as their currency; this requires both solidarity in times of crisis and respect by all for commonly agreed rules.
The great European visionaries in the immediate post World War II period did not desire to put the European economies into a straitjacket of austerity and hardship.
Rather they aimed to achieve peacetime prosperity. Europe’s political leaders devised the ‘European Project’ as an ambitious plan for European integration to ensure that there were no more large scale military conflicts fought on continental European soil.
The Project began at a time when the advanced nations had embraced a broad Keynesian economic policy consensus with governments committed to sustaining full employment.
The Keynesian era emerged out of the Great Depression, which taught politicians that without major government intervention, capitalism is inherently unstable and prone to delivering lengthy periods of unemployment.
Full employment came only with the onset of World War II as governments used deficit spending to prosecute the war effort. The Keynesian era of macroeconomic policy that followed was thus marked by government deficits supplementing private spending to ensure that all workers who wanted to work could find jobs.
The broad political and economic consensus that emerged after the war brought very low levels of unemployment in most Western nations, which persisted until the mid 1970s, although some European nations had bouts of sustained higher unemployment as a consequence of having to defend their weaker currencies.
Within this broad policy consensus, the discussions about integration were conditioned by Franco-German rivalry. France was determined to create institutional structures that would stop Germany from ever invading it again.
It saw an integrated Europe as a way of consolidating a dominant role in European affairs but was determined to cede as little national sovereignty as possible to achieve these aims.
France was also resentful of the influence that the US was exerting in Europe, particularly through the Marshall Plan, which intrinsically tied West Germany to the US.
The Germans, suffering a deep shame for their past militarism and associated deeds, had only their economic success including the ‘discipline’ of the Bundesbank to generate national pride.
As well as a need to expand its export markets, Germany wanted to be part of the ‘European Project’ to demonstrate a rejection of its ugly history.
But an obsessive fear of inflation meant that this participation had to be on German terms, which meant that the new Europe had to eventually accept the Bundesbank culture. This became a grinding process.
Within the German ‘stability’ environment, it was seemingly overlooked that Germany, in fact, relied on robust import growth from other European nations for its prosperity. The fact that not all nations in a Bundesbank centric ‘stability environment’ could have balance of trade surpluses was ignored.
The common currency became a reality in the late 1980s after several failed attempts to advance a coherent plan (Werner Report, McDougall Report) not through a diminution in Franco-German national and cultural rivalry but rather a growing homogenisation of the economic debate.
The surge in Monetarist thought within macroeconomics in the 1970s, first within the academy, then in policy making and central banking domains, quickly morphed into an insular Groupthink, which trapped policy makers in the thrall of the self regulating, free market myth.
The accompanying ‘confirmation bias’ (the tendency of people to assemble evidence that supports their view and reject or ignore contrary evidence) overwhelmed the debate about monetary integration.
The introduction of the Monetarist inspired Barre Plan in 1976, by French Prime Minister Raymond Barre, under President Valéry Giscard d’Estaing, showed how far the French had shifted from their Gaullist ‘Keynesian’ days.
Across Europe, unemployment became a policy tool aimed at maintaining price stability rather than a policy target, as it had been during the Keynesian era up until the mid 1970s. Unemployment rose sharply as national governments, infested with Monetarist thought, began their long-lived love affair with austerity.
This is the context that the Delors Report was received in 1989 and the design of the monetary union conceived.
The Eurozone is now locked down in a straitjacket of economic austerity, driven by an economic ideology that is blind to the evidence of its own failure.
The neo-liberal policies of deregulation and the demonisation of the use of discretionary fiscal deficits (government spending greater than tax revenue) created the crisis in the first place, and now the same sorts of policies are prolonging it.
The current policy approach has institutionalised economic stagnation, widespread retrenchment, and the deterioration of working conditions and retirement pensions. Millions of European workers are now unemployed, inequality and poverty rates are rising, and massive daily losses of national income are being endured.
The dramatically high youth unemployment rates will ensure that the damage will span generations and undermine future prosperity as a cohort of jobless youth enter adulthood with no work experience and a growing sense of dislocation from mainstream societal norms.
Yet the European Council can still endorse documents that construct the problem as one of microeconomic inefficiency (structural impediments) rather than a macroeconomic shortage of spending.
The document just repeats this dogma.
Moreover, it talks about the “common interest” of all Member States but expresses that in terms of adhering to the rules, which are allegedly designed to achieve a “clear set of goals – inclusive and sustainable growth, price stability, sound fiscal positions and high levels of employment”.
One would suggest that non of these goals have been achieved after 15 years of operation, which might lead one not trapped in the Groupthink to conclude that the “set of common rules” are defective.
It is an amazing situation really. I live in a functioning federal system but there is never talk about trade imbalances between say, New South Wales and Victoria. There is not data published to tell us about the flows of spending between the states.
We also accept that the National government will always ensure that the fortunes of each state will not diverge much.
There is no way we would accept the sort of disparities that have emerged in this so-called “community of destiny” that the European Council wants to promote.
Of course, the difference, the crucial difference is that Australia is a functional federation with a coherent federal government, which aligns the fiscal policy function with the monetary policy function. It also operates to ensure no state is really left behind.
The so-called “community of destiny” has no such capacity so all inter-state transfers are constructed in terms of ‘German taxpayers bailing out lazy Greeks, who don’t pay taxes’ or some such idiocy.
There is no “community of destiny” within this narrative. It is rather a fractured, warring monetary arrangement between nations, who are different in significant respects – culturally, language, economic structure.
It lacks the essential ingredients to make it work and to cover for that lack by imposing rules that ensure it won’t work.
That is the Eurozone of 2015.
But the narrative they are seeking to promote remains in denial of that reality.
Take this graph for example, which is presented as Chart 4 in the paper. It shows the change in unit labour costs between 2001 and 2009 (horizontal axis) against the change in the unemployment rate between 2009 and 2013.
Unit labour costs (ULCs) are total labour costs in euros (in this case) divided by the total real GDP. So it is an expression of the euro costs of each unit of real GDP produced.
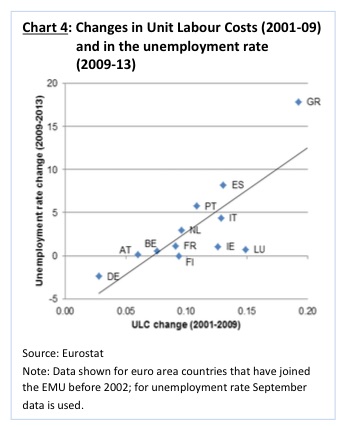
The black line is a simple linear regression between the two series.
The linear regression is arrived at by relating (in statistical terms using ordinary least squares methods) the horizontal axis variable on the right hand side of the equation to the vertical axis variable on the left as the dependent variable.
In other words, we understand this to mean that changes in ULCs drive changes in unemployment rates.
The accompanying text says:
Against this background, during the first decade of the euro, the cost of labour (measured in unit labour costs) grew significantly in a number of euro area countries, making their products more expensive, thereby reducing their compe- titiveness and leading to a negative balance of payments vis-à-vis other euro area countries which had kept labour unit cost stable or even lowered them.
This brought about higher unemployment rates during the crisis (see Chart 4).
“This brought about” is a causal statement. That the higher unit labour costs caused the higher unemployment. That is certainly what the graph is intending to portray.
First, count the data observations – 12 in total.
The document has a footnote that the data covers the “euro area countries that have joined the EMU before 2002”. This seems a bit artificial given that of the current 19 nations now participating formally in the Eurozone, all joined the – Exchange Rate Mechanism (ERM II) – well before the crisis.
The ERM II was established on January 1, 1999 to:
… to ensure that exchange rate fluctuations between the euro and other EU currencies do not disrupt economic stability within the single market, and to help non euro-area countries prepare themselves for participation in the euro area.
Several of the nations joined in June 2004 (Estonia, Lithuania, Slovenia) while others joined in 2005 (Cyrpus, Latvia, Malta and Slovakia).
Many nations also pegged against the euro well before they formally joined the ERM II.
In some cases (Cyprus and Estonia) the pegs came in with the common currency, while other nations pegged a little later (Lithuania, 2002; Slovenia, 2004; Latvia, 2005).
So it appears to be a little artificial to segment the sample into the original 12 formal members and the remaining current members who were effectively bound by the same monetary arrangements as those 12.
The following graph reproduces “Chart 4” from the ‘Informal European Council’ paper shown as the red diamonds with the upward sloping black line representing the linear regression between these 12 observations as explained above.
Now if we add the other 7 euro nations to the graph (shown by the blue diamonds) we get a very different picture.
The downward sloping black line is the simple regression between all 19 observations (blue and red diamonds)
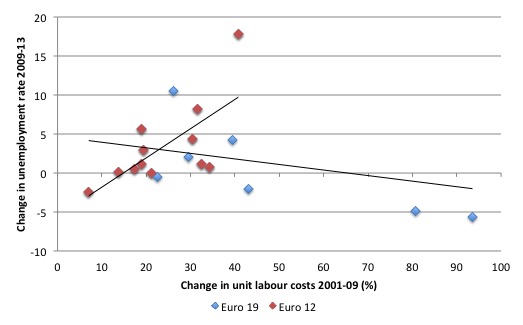
There are four other Eurozone nations (Estonia, Latvia, Lithuania and Slovenia) which experienced increases in ULC between 2001 and 2009 that were as large or larger than Greece, yet had dramatically different unemployment rate changes in the period 2009 to 2013.
Even if we took the ‘outliers’ Estonia and Latvia out of the picture the regression line would not be upward sloping (it is in fact rather flat).
Some might say that after the crisis, the Baltic nations took the structural adjustment pain which Greece has ‘refused’ to take (which is the popular narrative) and that is why they experienced lower unemployment rates in the recent period.
Here is a graph for the 19 Euro nations which shows the change in ULC between 2009 and 2013 and the change in the unemployment rate between 2010 and 2014 – the lag to give the change in ULC a chance to ‘work’ (consistent with the mainstream narrative).
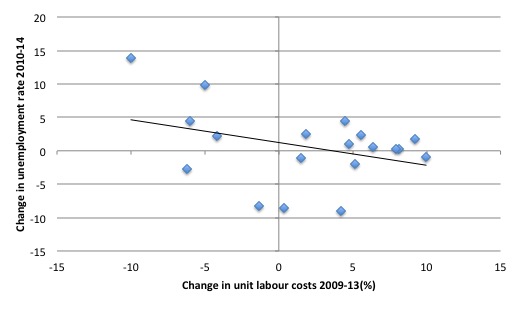
In fact, Greece has experienced the largest percentage fall in ULC sover the crisis period. Estonia has seen a rise of 4.2 per cent, Latvia a rise of 0.4 per cent and Lithuania a fall of only 1.3 per cent.
So there seems to be something else going on. More on this soon.
The other problem with the European Council analysis is that it does not take into account price level changes. The implication is that if there are disparate changes in ULCs, then the relative competitiveness of the nations will be divergent.
The following graph uses the data from the Bank of International Settlements monthly Effective exchange rate indices – which are published from January 1994 to February 2015.
You can learn about this data from their publication – The new BIS effective exchange rate indices – which appeared in the BIS Quarterly Review, March 2006.
There was an earlier publication – Measuring international price and cost competitiveness – which appeared in the BIS Economic Papers, No 39, November 1993.
Real effective exchange rates provide a measure on international competitiveness and are based on information pertaining movements in relative prices and costs, expressed in a common currency. Economists started computing effective exchange rates after the Bretton Woods system collapsed in the early 1970s because that ended the “simple bilateral dollar rate” (Source).
The BIS ‘real effective exchange rate indices’ (REER) adjust nominal exchange rates with other data on domestic inflation and production costs.
The BIS say that:
An effective exchange rate (EER) provides a better indicator of the macroeconomic effects of exchange rates than any single bilateral rate. A nominal effective exchange rate (NEER) is an index of some weighted average of bilateral exchange rates. A real effective exchange rate (REER) is the NEER adjusted by some measure of relative prices or costs; changes in the REER thus take into account both nominal exchange rate developments and the inflation differential vis-à-vis trading partners. In both policy and market analysis, EERs serve various purposes: as a measure of international competitiveness …
If the REER rises (falls) then we conclude that the nation is less (more) internationally competitive.
Analysis of the movements in REERs can help us answer the question: Does internal devaluation boost external competitiveness?
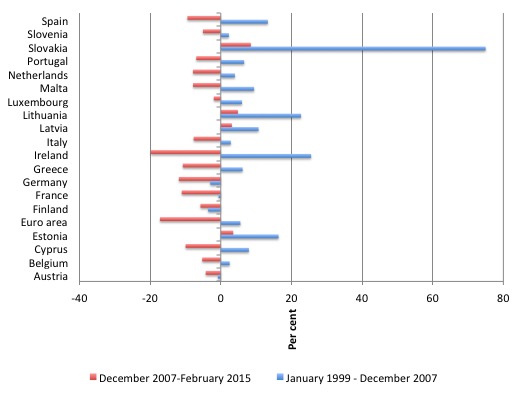
The following graphs shows movements in real effective exchange rates since 1999, split into two sub-samples – January 1999 to December 2007 and January 2008 to February 2015, roughly coinciding with the period of growth and the period of recession.
The data shows that following the introduction of the euro, international competitiveness for all the nations shown declined except in the cases of France, Finland and Germany.
Following the crisis, the general tendency has been for real effective exchange rates to decline. However, despite the massive austerity program that Greece has endured, the decline in its real effective exchange rate was less than the decline against Germany (10.8 per cent relative to 11.9 per cent).
Of th Eurozone nations, only Ireland has improved its position relative to Germany (19.8 per cent) since the onset of the crisis.
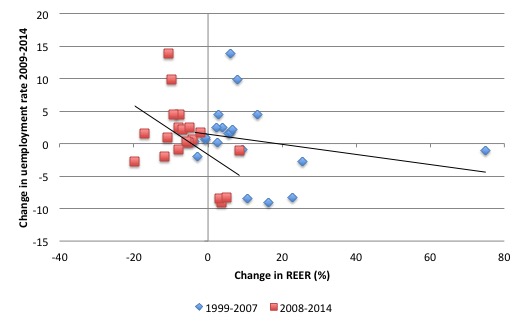
The next graph shows the change in the unemployment rate between 2009 and 2014 against the percentage change in REERs from 1999-2007 (blue diamonds) and from 2007-2014 (red diamonds). The black lines are the corresponding regression lines.
In the first case (blue diamonds) the relationship would be lagged whereas the second is largely contemporaneous.
Once again if you believed the regression results you would conclude that the larger the rise in REERs the greater would be the reduction in unemployment rates, which of course is likely to be a spurious result.
That relationship intensified (black line steeper) in the recession period, which makes it even more nonsensical.
Lesson: simple bi-variate regression lines are dangerous to rely on by way of inference.
The evidence suggests internal devaluation does not provide a sound basis for growth. First, it is a ‘race to the bottom’ strategy that attempts to drive down unit costs via cuts in wages, which undermine domestic spending.
But if workforce morale also falls as a result of the wage cuts, it is likely that industrial sabotage and absenteeism will rise, undermining labour productivity.
Further, overall business investment is likely to fall in response to declining spending, which also erodes future productivity growth. There is thus no guarantee that there will be a significant fall in unit labour costs.
There is robust research evidence to support the notion that by paying high wages and offering workers secure employment, firms enjoy higher productivity growth and the nation improves its international competitiveness as a result.
Eurostat data shows that between 2008 and 2013, labour productivity per hour worked rose by 1.8 per cent in Germany, but fell in Greece, the worst hit by the austerity, by 8.5 per cent and in Italy by 0.7 per cent.
So not only does the internal devaluation approach fail to lift competitiveness, it locks in a low productivity path, which undermines increases in real living standards. The massive costs for nations being subjected to these austerity programs in the form of millions of lost jobs and the very high youth unemployment are much higher in the long term than any benefits that might arise.
Obviously something else has been driving these relationships. What might that be? Well European Council analysis doesn’t mention it for obvious political reasons. After all, they are promoting an austerity, privatisation, cut working conditions story.
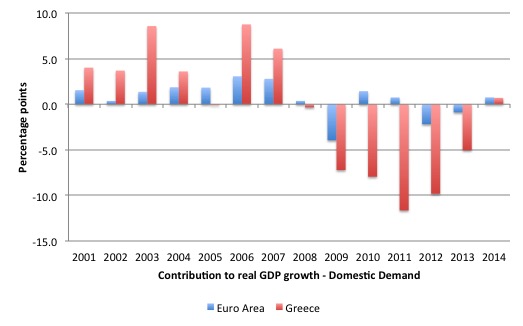
The following graph shows the contribution to real GDP growth of domestic demand from 2000 to 2014 (in percentage points) for the Euro area in total (19 nations) and Greece.
Domestic demand is total spending net of net exports. While it might be argued investment spending is sensitive to trade competitiveness, the reality is that for Greece, as competitiveness slipped in the pre-crisis period (see earlier graph) gross investment was booming as was real GDP growth.
Once the crash came and the Troika started to deliberately sabotage private and public spending in Greece did domestic demand collapse. Over that time, competitiveness was rising.
Conclusion
There are other highly contentious graphs in the document. But analysing one has given me a sufficient headache.
The reason that unemployment rose so sharply in the Euro countries between 2008 and 2014 has nothing much to do so-called trade imbalances or differential ULCs.
Those imbalances (as they call them) and different ULCs are not new. What happened in 2008 was a major aggregate spending collapse which was then reinforced by the imposition of austerity.
If I graphed the change in fiscal position (as measured by the differential austerity imposed) and the change in the unemployment rate I would get a very strong positive relationship (more austerity, higher the rise in unemployment rates) which would have some meaning.
That should be the starting point for the European Council – but then that would require them to ask questions about their patently dysfunctional fiscal rules.
That is enough for today!
(c) Copyright 2015 William Mitchell. All Rights Reserved.
Bill,
In your conclusion you say, “Those imbalances (as they call them) and different ULCs are not new. What happened in 2008 was a major aggregate spending collapse which was then reinforced by the imposition of austerity.”
OK then – if there was a “major aggregate spending collapse” in Australia and unemployment shot up in Melbourne but not Sydney, the explanation for the rise in unemployment in Melbourne would quite clearly not JUST be the aggregate demand spending collapse.
Much the most likely explanation would be that Sydney was competitive: it can make and sell stuff that people outside Sydney (in the rest of the world and Australia) actually want.
In contrast, Melbourne could prevent unemployment rising too fast in Melbourne by borrowing and spending on stuff produced IN MELBOURNE, but that rise in its debt would not be sustainable in the long run.
So,the EMU is a political project. That’s interesting as there has never been political union in Europe,even under the great Unifier,Napoleon.Maybe there needs to be a latter day Boney in Brussels with nukes to herd all those cats.
The great “project” is doomed to fail. I wonder how much the common man has to suffer before that realisation seeps into the seemingly impenetrable “minds” of the elite.
Dear Ralph (2015/03/23 at 16:08)
It will still be a deficiency of aggregate demand.
Further, the Euro crisis was not confined to one state while others prospered. They are all in a mess including Germany.
best wishes
bill
Bill,
See socialeurope.eu for more analysis of these dubious graphs and the duplicity involved!
Dear Bill
You wrote that Germany “relied on robust import growth from other European nations for its prosperity”. I know what you meant, but wouldn’t it have been less ambiguous if you had written that Germany “relied on robust export growth to other European nations…”?
Canada and the US are also federations, but the federal government in Canada or the US is never liable for the debts of the provinces or states. The main difference between the Eurozone and Canada and the US is the size of the central government. The EU spends about 150 billion per year, which is around 300 euros per EU inhabitant. The Canadian federal government spends about 280 billion, which is around 8000 per Canadian. The smaller the central government is in terms of its share of GDP, the less capable it is to carry out effective fiscal policies. The larger a central government is, the more likely it will help depressed regions simply through the automatic stabilizers. If Florida is hit much more severely by a fall in aggregate demand than the rest of the US, then it will pay less taxes to the federal government and receive more benefits from it, while the rest of the country will pay taxes and receive benefits as before, so the rest of the country is helping Florida without any special program.
The main condition for a functioning monetary union is a common inflation rate. All the members should target the same inflation rate because within the union there are no longer any exchange rate variations to correct different inflation rates. That’s where it went wrong because countries like Germany and the Netherlands kept their inflation rates below the rest of the Eurozone.
Regards. James
@podargus.
Rome?
“Rather they aimed to achieve peacetime prosperity. Europe’s political leaders devised the ‘European Project’ as an ambitious plan for European integration to ensure that there were no more large scale military conflicts fought on continental European soil.”
This is absurd. European integration was undertaken in, and due to, the context of the Cold War, not WWII. The narrative that it was WWII that gave the impetus to build the European institutions is just that : a narrative. Maybe the founders of the project really believed in their own narrative, I don’t know. But one thing is for sure : in the context of the Cold War, devising plans to avoid “large scale military conflicts” – moreover between military allies, members of NATO – is absurd. If politicians in those days feared a large scale conflict, it was between NATO and the USSR, not between France and Germany.
However, looking at the data, it is clear that public opinion support for the project is deeply tied to the Cold War, not to WWII. If it was tied to the memories of WWII, support would tend to weaken as time goes by, with the content of European policies having a big impact either to increase or to decrease said support. If it is the Cold War that is responsible, then we should see rising support through the Cold War and decreasing support afterwards, with the effects of the content of European policies being negligable before the Cold War effect. Looking at the Eurobarometer archives, it is evident that the later is correct, not the former : support for integration rose in a quasi linear fashion until 1991 and underwent two waves of collapse, 1991 and 2008, and changes in European policies or new entries in the EU make almost no dent in the trends.
From there, it is easy to interpret what’s happening. Everything is the result of the consequences of the European project being dependent not only on the content of the project itself, but also of the broader context in which the project is implemented. As long as the Cold War was going on, the proponants of European integration enjoyed rising support and could use the external conflict to forcefully advance their ideas. In this context, it was possible (though not necessarily likely) that European integration be archieved more or less peacefully. Once the cold War was out of the picture though, Europe went back to a more normal situation, where the only way to integrate pre-existing sovereign spaces is a Civil War (like the American Civil War, or the Sonderbund War). In the current context, attempts to further integration can only deepen the already existing split in public opinion, until it becomes impossible to ignore the disagreement. At which point we can expect anything between massive terrorism to full scale continental – or even global – war.
To understand what’s going on, the first requirement is to let go of the idea that the desirability of European integration depends on its content. The effects will change depending on the interaction of the project with the context. Just because the EU was designed to foster peace in the context of the Cold War, it doesn’t follow either that it really succeeded in that function, or that it does so in every possible context.
Bill, Wren-Lewis has a piece on the comparison of Greece and the UK interms of debt to GDP ratios. Any comment?
http://mainlymacro.blogspot.co.uk/2015/03/controlling-past.html — Controlling the Past
He also discusses Cameron when perhaps in the context he ought to be discussing Osborne.
Dear Nietil (at 2015/03/24 at 0:19)
I suggest you read your history a bit more and especially the immediate post WWII documents (mostly in French).
best wishes
bill
jake?
Bill,
You say “They are all in a mess including Germany” nut Germany has a reported unemployment rate of 4.7% which isn’t too bad at all.
Germans tend to think that their trade surplus of 7% is a good thing. But, when I point out to them that a surplus in Euros, which they can’t spend (otherwise they wouldn’t have a surplus), is actually a deficit in real goods and services, and there is adversely affecting their living standards, they go quiet. It’s almost as if they hadn’t thought of it that way before.
So, I’d agree that the whole of the EZ is “in a mess”. Except the Germans, and perhaps the Dutch too, don’t think they are. But they should!
Professor Mitchell,
Perhaps this is not the proper place but I am wondering if there is a good measure to estimate a given political economy’s “Savings Desires?”
Running a trade surplus is socially irresponsible. Even if there are small clique at the top who benefits, it cheats millions of people out of fruits of their labor.