I started my undergraduate studies in economics in the late 1970s after starting out as…
Labour force data surprises …
The ABS published the January Labour Force Survey data this morning which is the monthly indication of how the labour market is faring. All expectations were that with other indicators such as the NAB Business Confidence Index and the ANZ Job Advertisements count all heading south very rapidly in the last month that the Labour Force data would be equally grim and signal the slide into recession. How wrong we all were. But should we believe the data?
The data shows that for the period between December 2008 and January 2009 the labour market actually grew. In seasonally adjusted terms, total employment grew by a net 1200 (full-time jobs up 33,700 after diving by that much last month; part-time jobs down 32,600); unemployment rose by 36,800 to 540,200 but this was because … surprisingly, the labour force participation rate increased by 0.1 percentage points.
The net effect on the summary unemployment rate is that it increased by 0.3 percentage points to 4.8 per cent. But on the back of a “growing economy” if the numbers are to be believed. Should we believe them? I don’t.
First, as noted above they are at odds with other data which has had a good track record of leading the cycle. The NAB survey shows business confidence is at recession levels. The ANZ Job Ads data also confirms a rapid decrease in jobs on offer.
Second, these movements are at odds with what happens when there is a general slowdown going on. Full-time work typically drops consistently after the peak and part-time work offers some respite as employers make hours adjustment before finally shedding labour.
Third, the effects of the December stimulus may have been at work but unlikely, especially in terms of full-time work.
The answer may lie in the major changes that the ABS has made in recent months to the way it collects the labour force data. The estimates in the ABS publication are based on a sample survey which introduces sampling variability into the exercise. This means that in making the move from the sample estimate to the population estimate errors are introduced. Statisticians use the concept of a standard error to capture the variability that sampling involves. They also deploy the estimated standard errors to construct 95 per cent confidence intervals around the estimate published.
In words this means that we are 95 per cent sure that the true value for the population lies within the lower and upper confidence interval. For January 2009, the 95% Confidence intervals for the change in the aggregates were:
| Labour Force category | Change Dec-Jan | Confidence Interval |
| Total Employment | 1,200 | -59,600 to 62,000 |
| Total Unemployment | 36,800 | 1,600 to 72,000 |
| Unemployment rate | 0.3 pts | -0.1 pts to 0.7 pts |
| Participation rate | 0.1 pts | -0.3 pts to 0.5 pts |
In other words, total employment might have dropped by 59,600 or risen by 62,000 with the published estimate being a modest rise of 1,200.
But statisticians handle this level of uncertainty all the time and understand its properties. The worry, however, is that the ABS has been forced to introduce more inaccuracy into the estimates over the last several months because of budget cuts.
In an Information Paper: Labour Force Survey Sample Design the ABS indicated that from July 2008, the sample size used for the Labour Force Survey (LFS) was to be cut by 24 per cent.
Initially, the ABS has been able to improve its sampling efficiency (read: getting better from less) by introducing a new estimation technique. The result was an 11 per cent reduction in the sample size without a loss in quality.
But because the Federal government cut the ABS budget significantly in 2008-09 the national statistician has been forced to further reduce the sample size, below that warranted by any efficiencies.
What does this mean? Well fewer people are being asked to complete the LFS questions across the Austraia and so the reliability of the enumeration that translates the sample estimates into population estimates will be necessarily lower. The ABS claim that:
The new LFS sample, while smaller, will still be representative of the geographic distribution of the Australian population. There will be increased volatility in the estimates, particularly the original and seasonally adjusted estimates, but this volatility will be random. The ABS continues to encourage users to focus on the trend estimates because the increased volatility seen in the original and seasonally adjusted estimates will be dampened through the ‘trending’ process.
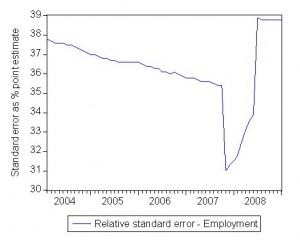
To evaluate the increase in volatility (error) in the monthly statistics, statiticians use relative standard errors (RSEs). The ABS reports that
Overall, the RSEs for estimates of employment and unemployment at the national, state and territory level are expected to be approximately 15% higher on average than those expected from the 2006 sample design. The impact of the increased RSEs is best demonstrated by consideration of the confidence intervals surrounding the respective estimates. By way of example, say the national estimate for employment is 10,000,000. If this figure were produced under the 2006 design, there would be 19 chances in 20 that the real value is within the range 9,932,600 to 10,067,400. With the reduction in sample from July 2008 that range will increase to 9,922,800 to 10,077,200. Similarly for unemployment, if for example a national estimate of 500,000 was produced under the 2006 design, there would be 19 chances in 20 that the real value is within the range 474,000 to 526,000. With the reduction in sample that range will increase to 470,200 to 529,800.
So the differences are not small. The standard errors for all the main labour force aggregates are now larger – around 15 per cent higher than those expected from the previous (2006) sample size. In the past a lot of the data that the ABS produces at regional level or industry level have been plagued with high standard errors. But now this sort of unreliability is creeping into the national statistics which so heavily condition the public debate and influence policy design.
The ABS say:
The sample reduction will increase the number of estimates with high standard errors (ie. subject to sampling variability too high for most practical purposes).

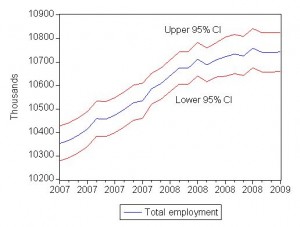
The second graph shows the evolution of seasonally adjusted employment with the upper and lower confidence intervals shown. So in any month total employment could be anywhere between the red bounds. The intervals (our measure of precision in the estimate) have increased a little (as noted above) since the sample size was cut by the budget vandals.
This is a matter for concern. An activist macroeconomic policy strategy – and spending $42 billion is certainly activist – requires timely and accurate data to fine-tune the policy parameters. The last thing the Government wants to do is to introduce pro-cyclical fiscal policy initiatives – that is, policies that expand the economy when it is expanding and vice versa. That is the sure way to discredit fiscal policy activism. The neo-liberals may be punched down at the moment because of their stupidity and lack of guile in economic management (witness: global financial disaster) but they are not gone. Any poorly designed policy will allow them to take the stage again and wreak further havoc on the economy and our community welfare.
In other words, the Federal Government should be investing more in the national statistics effort not less. It should be providing enough capacity to the ABS to increase its sample size so that the regional labour market data becomes more reliable. It is lunacy to do otherwise.
On indicators of economic activity: I have just been sent a fairly good dataset for the volume of coal going out the loaders in the Port of Newcastle. This includes the length of the tanker queue waiting off the coast to enter the Port; the average number of vessels loaded per week and other interesting data. The queue which at times has reached 80 ships is currently falling below 20 and is looking to be around 12 by the end of February. I am looking to see if I can solve the identification problem (is the dwindling queue because of structural efficiencies on the supply side or lack of orders on the demand side or both!) and come up with a nice indicator (close to my home) of generalised economic activity.
On the Job Guarantee: I never thought I would applaud Senator Fielding … but he is about the only voice in Canberra that is batting for direct public job creation programmes. Lucky he has some voting clout!

Thanks for the analysis Bill. I can’t imagine that there would be many, regardless of their politics, who could argue now is a time for sloppy statistics.
Can the ABS get a slice of the stimulus package? I would guess that the reason they’re taking less of a sample is that they’ve reduced the hours available to telephone surveyors, who are relatively lowly-paid. Is there an argument that putting the ABS budget levels back up would increase the money going to a group of people (‘telemarketers’) more likely to spend it?