I grew up in a society where collective will was at the forefront and it…
The US labour market is still in a deplorable state
Last week (February 1, 2013), the – US Bureau of Labor Statistics – released their latest – Employment Situation – January 2013 – which showed that total “nonfarm payroll employment increased by 157,000 in January, and the unemployment rate was essentially unchanged at 7.9 percent”. The question is whether that is a good outcome or not in the scheme of things. The answer is that it remains a fairly bleak outcome especially when we consider the data more deeply. The economy is not growing fast enough to absorb the backlog of workers who were made unemployed in the downturn. There is massive waste now being endured by the economy and disproportionately being borne by the most disadvantaged workers in that economy. It is madness for the politicians to argue about debt ceilings and the rest of the irrelevancies when there is this much waste being created.
The data was the subject of an interesting UK Guardian article (February 1, 2013) – The unemployment crisis that lies behind the US monthly jobs report – which is about the only commentary that focused on the chronic unemployment that is being hidden by the employment growth.
The author said that the latest data represented a “relatively good employment report” with good jobs being created and signs of recovery in construction (new housing growth) and a strengthening positive trend in jobs growth overall.
The author downgraded the recent – US Bureau of Economic Analysis – national accounts data release, which showed the December quarter real GDP growth was negative, largely due to cut backs in military spending. There were other things that slowed the economy, which I will comment on in a separate blog (including the payroll tax rises associated with the fiscal cliff nonsense).
But the Guardian article correctly observes that despite the signs of growth:
… we still have an joblessness crisis. And as long as the actual numbers appear to get “better”, then it will not be treated like a crisis, but more like an inconvenience. For the duration of the US unemployment crisis, we have had no answers. No one is really working on any solutions to it except “wait and hope, and hope and see.”
This is the major problem that happens after every growth cycle. As optimism starts to return it is overlooked how much inertia there is in the unemployment rates and durations in the aftermath.
Employment growth is rarely enough to not only cope with the growth of the labour force, which itself increases as recovery takes hold (due to the hidden or discouraged workers re-entering the labour force), but to also eat into the pool of unemployed that was created in the downturn.
Unemployment is very asymmetric in its response to the economic cycle. It quickly rises but only falls slowly again.
There are several things to look for as a first glance when the labour force data is released.
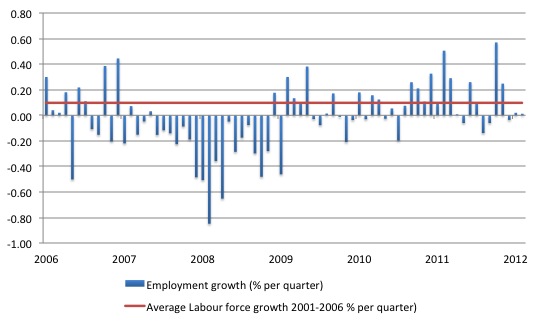
First, what has happened to employment? The BLS tell us that “nonfarm payroll employment increased by 157,000” and total employment grew by 0.01 per cent in January and by 1.21 per cent over the 12 months to January 2013. The labour force grew by 0.84 per cent over the period.
However, employment growth slowed substantially over the last quarter: -0.04 per cent in November 2012, 0.02 per cent December 2012, and 0.01 per cent in January.
The following graph shows the monthly employment growth since the low-point unemployment rate month (December 2006). The red line is the average labour force growth over the period December 2001 to December 2006 (0.097 per cent per month).
Unemployment rises if the employment growth is below the labour force growth rate.
What is apparent is that a strong positive and reinforcing trend in employment growth has not yet been established in the US labour market since the recovery began back in 2009. The labour market is limping along.
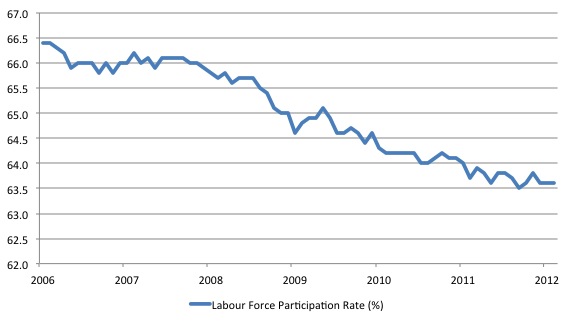
Second, I always look at participation rates because they tell me what is happening on the margin of civilian working age population and the labour force. If, for example, the participation rises, unemployment can rise even though employment growth is strong. That is a virtuous sign because it means that the economic situation is improving and discouraged workers are coming back into the labour force as the jobs market looks more hopeful.
We juxtapose that situation with one where the participation rate is falling – which suggests discouraged workers are giving up on job search because of the dearth of vacancies available and even though unemployment might actually fall, the signs are bleak. All that sort of economy is doing is trading official unemployment for hidden unemployment. The weakness just leaves the labour force.
The next graph shows what has happened to the participation rate since December 2006.
The fall in participation since December 2006 has been stark – from 66.4 per cent to 63.6 per cent. What does that mean in numbers?
You can compute how much larger the labour force would be if the participation rate now was at its December 2006 peak by working out the current working age population and multiplying it by the peak labour participation rate.
The difference between the actual labour force now and the “potential” labour force represents the number of workers that have given up looking for work as a result of the lack of job opportunities available.
This difference is approximately what we might call the rise in hidden unemployment and in the case of the US is equal to 6310 thousand workers.
If we added them back into the labour force and considered them to be unemployed (which is not an unreasonable assumption given that the difference between the two categories – unemployment and hidden unemployment is due to whether the person had actively searched for work in the previous month) – then the unemployment rate would rise to 12.5 per cent rather than the current official unemployment rate of 7.9 per cent.
In other words, a lot of the continuing slack is being hidden in the not in the labour force category. If employment growth speeds up then we can expect to see unemployment rise as the participation rate rises due to improving opportunities for employment. That is not happening yet although the deterioration in the participation rate seems to have levelled out in recent months.
The next thing to consider is the shifting duration of spells of unemployment. The BLS reported that:
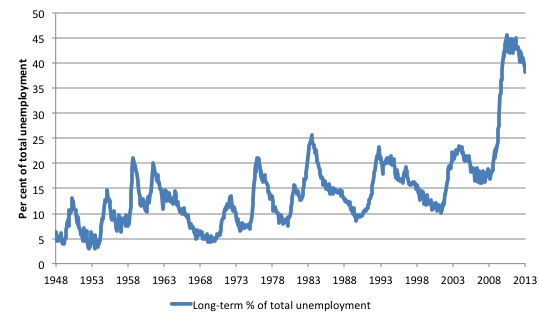
In January, the number of long-term unemployed (those jobless for 27 weeks or more) was about unchanged at 4.7 million and accounted for 38.1 percent of the unemployed.
The following graph shows the evolution of this proportion (those unemployed for 27 weeks or more as a percentage of the total unemployed) since January 1948. The previous recessions are indicated by the spikes up to around 25 per cent.
The most recent recession is an outlier in terms of severity with the proportion peaking at 45.6 per cent in June 2010.
The UK Guardian article comments on these trends by noting that:
In the real economy, we still have a significant number of unemployed people – and more importantly, we have a core group of long-term unemployed people, who become more unemployable the longer they are out of work. There are another 2.4 million people who are “marginally attached”, meaning they were “not in the labor force, wanted and were available for work, and had looked for a job sometime in the prior 12 months. They were not counted as unemployed because they had not searched for work in the four weeks preceding the survey.”
The facts are correct other than the conclusion – “unemployable”.
This perspective goes back to the start of the neo-liberal onslaught.
The rising long-term unemployment has allowed the neo-liberal assertions that were highly influential in the design of the 1994 OECD Job Study to resurface – this time (and for the first-time) in the context of the US debate. The long-term unemployment rates have always been higher in Europe and Australia.
The Jobs Study was the bible for governments everywhere, which were intent on abandoning their commitment to full employment and, instead, concentrate labour market policy on supply-side initiatives. This was the so-called activism agenda – the pursuit of “employability” rather than ensuring there were enough jobs available. It was claimed that persistent unemployment was due to poor attitudes and lack of training.
The principle claim was that long term unemployment possessed strong irreversibility properties. Irreversibility is sometimes referred to as hysteresis and suggests that the long term unemployed constitute a bottleneck to economic growth which can only be ameliorated through supply-side (rather than demand-side) policy initiatives.
The OECD considered that only by “market-based” developments – privatising public employment services, harsh welfare-to-work changes, tightened activity tests, reductions in the real value of income support for the unemployed etc – that this alleged irreversibility would be alleviated.
The problem is that the facts never supported the ideologically-obsessed narrative that the neo-liberals pushed, which were used to justify the dismantling of the public sector and the privatisation of labour market programs. Unemployment did not fall until there was strong enough growth in aggregate demand.
The reason? Please read my blog – What causes mass unemployment? – for more discussion on this point.
In earlier work that I have done studying the rise in long term unemployment I found no evidence that there had been any major structural shifts in the relationship between long-term unemployment and total unemployment in most nations.
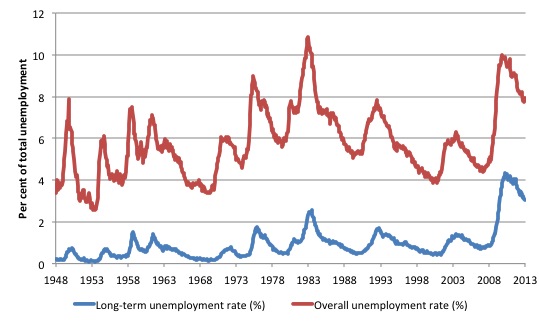
The sharp rises in long-term unemployment occur as a consequence recessions. In the next graph you can see this very clearly. The long-term unemployment rate (LTUR) rises with a slight lag with the official unemployment rate (UR). The lag is because it takes 27 weeks in the US classification system before a person who becomes unemployed today is counted as being long-term unemployed.
So during a prolonged downturn, the flows into short-term unemployment feed longer duration spells of unemployment which then cascades over into long-term unemployment. All the dynamics of the LTUR are demand-driven. I have never been able to construct them as steady structural shifts driven by behavioural supply side changes.
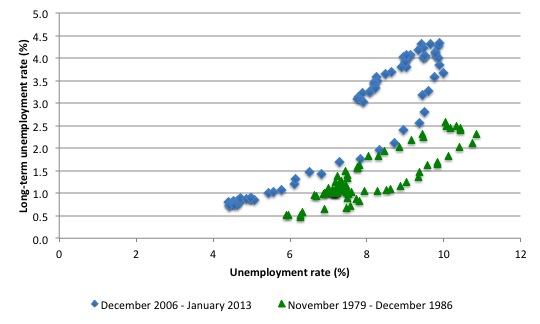
The next graph compares the relationship between the official unemployment rate (horizontal axis) and the long term unemployment rate (vertical axis) for two cycles coinciding with the 1982 recession (low-point unemployment rate – November 1979 was 5.9 per cent) and the current downturn (low-point unemployment rate – December 2006 was 4.4 per cent). The data for the 1982 recession shows that the economy started with a higher unemployment rate which rose sharply and drove a rise in the long-term unemployment rate.
In the recovery phase, the long-term unemployment rate dropped (in a lagged pattern) with the improvements in the official unemployment rate.
The current recession started from a better position but has endured for longer even though the unemployment rate only rose to 10 per cent rather than 10.8 per cent in November 1982. It is the persistent of the slackness that accounts for the continuing rise in the LTUR.
But if you compare the actual slope of each of the recoveries (one the LTUR peaks and starts to fall again) they are almost identical. So just as the LTUR fell to low levels as the 1982 recovery strengthened, I would expect the same to happen in the current period. However, the longer the recovery is stalled the worse the consequences are for those who remain long-term unemployed.
We can add a bit more graphical insight to this discussion given the excellent data provided by the BLS.
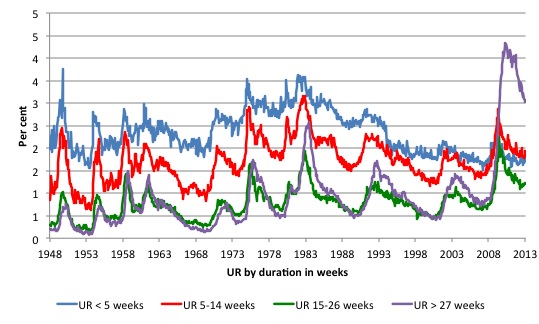
The next graph shows the evolution from January 1948 to January 2013 of the unemployment rate (%) by duration segments in weeks. The marked feature of this recession compared to earlier downturns is the extent of the rise in those unemployed for longer than 27 weeks as a proportion of the labour force.
That is a guide to the entrenched nature of the event and the fact that employment growth in the recovery has been insufficient to eat in to the pool of unemployed that built up in 2008-09.
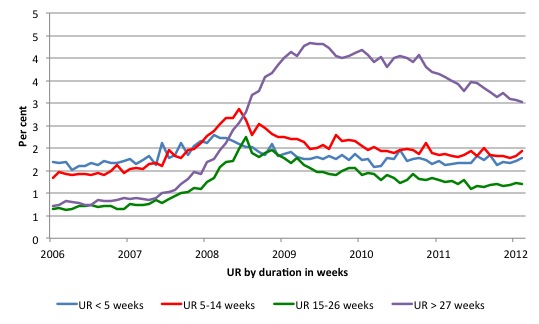
You can see that more clearly in the following graph which shows the same time series from December 2006 (the low-point unemployment rate month of the last cycle). The sequence of movement through the duration categories is very evident as the recession deepened and the employment response was weak. The US government should have intervened earlier and with more significant employment-orientated stimulus packages to prevent that duration wave occurring.
Once you see long-term rising like that the losses mount and the labour market recovery becomes more difficult because not only have the people been dislocated from paid employment for a long time but their skills and capacities start to atrophy, which then introduces an additional problem.
The UK Guardian article says:
What makes it a crisis is that we don’t seem to have any ideas on how to employ the unemployed. There are few, if any, ideas coming out of Washington. Corporate America, which still considers itself reeling from the recession, seems disinclined to pitch in – except for a few outliers like Starbucks’ “Create Jobs for USA” program. No major retraining programs have cropped up (even if the unemployed, with their pained finances, could afford them).
Well I wonder who “we” is. I have plenty of ideas about how to “employ the unemployed”.
The US government could largely wipe this problem of mass unemployment out overnight by announcing an unconditional job offer at a reasonable (not the current) minimum wage to anyone who wants to work.
That is announce a – Job Guarantee.
That is the ultimate activity test for the unemployed worker. The current activity testing is performed by governments in an environment where there are clearly not enough jobs to match those who seek them. So they just amount to nasty schemes to force the unemployed to run around in circles in order to get a pittance of income support.
Then the government could set about funding major infrastructure developments, a point the UK Guardian article agrees with:
Despite the nation’s weakening infrastructure on roads and bridges and sewer systems, there are no grand plans to deploy laborers to fix them: plenty of experts believe that a boost in infrastructure spending could help us grow jobs again, but not much is moving on that front. No industry except construction seems to be adding jobs at a rapid enough clip to breathe life into the economy.
So there are not a shortage of “ideas”. There is a lack of political will. When US politicians say they care about jobs, they are caring about selective jobs.
They hate the idea of a Job Guarantee, particularly its public sector focus, but applaud Walmart creating minimum wage jobs in an oppressive anti-union context.
That is, they don’t care about jobs per se.
Even if it would take some time to mobilise the Job Guarantee workforce, the government could put them on the payroll tomorrow and get them out to work sometime later. The economy would improve rapidly and it might be that they would get private jobs before the bureaucracy found them Job Guarantee jobs.
Conclusion
Its late and I have to stop now. I would have gone on to analyse the teenage labour market in the US, which is scaringly bad. The lack of urgency for any real solution in that segment of the labour market will result in the US bearing costs for years to come.
That is the burden that the current generation is leaving to their kids and grandchildren but the fools in Government and the think tanks and the secure and well-paid academics don’t seem to understand that.
That is enough for today!
(c) Copyright 2013 Bill Mitchell. All Rights Reserved.
Bill, the changes you want to see would vastly improve matters but are very unlikely to happen in the current political climate. There still seems to be no recognition among our elites in the USA, Europe and Australia about what needs to be done. In addition, the narrow, immediate interests of the capitalist oligarchs would not be served by such changes. The propagandisation (if I can use that word) of our populace is so extensive that 90% of the people have no idea that the received neoliberal economic “wisdom” is false.
Personally, I wonder how this can ever be turned around. It will take massive re-education (such as your blog) but it will also require a series of salutary disasters to overtake our society. I mean disasters that engulf the middle class as well as the poor. Only when the lies of the elites are undeniably exposed by plumetting middle class living standards will the Western “street” get active. It’s lamentable that it will have to come to this. The strangle hold of the elites on opinion formation is so great that only a yawning chasm between the propaganda and the worsening reality will wake people up from their consumerist coma.
Hi Bill, You make a good case for doing something, and the Job Guarantee(JG) is one possibility.
I think the whole question of Government Standards needs to be addressed. MMT places Government at the beginning of money supply. Government sets the criteria for who first gets the new money and how much each gets. This standard echos through the economy, for better or worse.
For example, let’s look at the issue of Job Guarantee and pensions. Many Government jobs have pensions so it would soon be questioned about how many Job Guarantee employees would have pensions. Would pensions be for just the JG managers, target employees after six months, or some other standard.
Perhaps the question is really whether past standards have been set too high, at monetarily unsustainable levels except by constantly increasing money supply. It is easy to justify a small amount of stimulus spending to increase near term economic activity. We have had annual stimulus in the four percent range (or more) for the last forty years so we have some history with that situation. The annual stimulus now is in the range of eight percent of GDP or more, and we have only four years of experience with that situation. So far, the long term outlook for employment under eight percent stimulation does not look promising.
I am a newcomer to your blog. Thanks for bringing these economic issues into focus.
Amateur Economist
The United States began 2012 with a jobless rate of 8% and ended the year with a jobless rate of 8%.
It is paramount that funding is protected for safety nets for the unemployed, especially unemployment insurance, the Supplemental Nutrition Assistance Program (SNAP), and the emergency Food and Shelter Program. In addition, any new jobs created must pay fair wages.
From AlterNet, consequences of prolonged unemployment:
” Hard Times USA
AlterNet / By Evelyn Nieves
comments_image 30 COMMENTS
Desperate People Ripping Off Copper in One of Our Poorest Cities
From 2008 to 2011, metals stolen for resale to recyclers rose 81 percent nationwide.
Photo Credit: Darcy Padilla, Agence VU
January 28, 2013 |
Editor’s note: There are more than one million homeless people in America and 138 million people who live paycheck to paycheck. Many more are struggling, wondering how they’ll make rent or get enough food. Those numbers are astounding. This is America. Many proudly think our society is fair, but the evidence overwhelmingly shows that fairness in America is a myth. In the weeks and months ahead, AlterNet will shine more light on America’s economic injustice in an ongoing series, Hard Times USA. Since many have chosen to look aside, or think the traditional ways of doing politics will fix things, there is still much to learn about how this problem will be solved, or not solved. Read our previous poverty coverage here. Much more to come.
— Don Hazen, executive editor of AlterNet
FRESNO, Calif.-The thieves strike in the middle of the night and work fast, in pairs or teams. They can make an entire neighborhood go dark in minutes. They screw open the street light maintenance boxes, find the copper wires and cut. Zip, zip.
While police nab copper thieves in the act, they can’t be everywhere. Come nighttime, some streets are as black as caves. Even if thieves stopped today, utility crews would need up to a year to fix all the damage. Meanwhile, darkened neighborhoods entice crooks bent on robbing houses, stealing cars or worse.
Lately, thieves have taken and created bigger risks, stealing copper from the lights, signs and metering signals on freeways that rim the city. Caltrans, the state agency in charge of the roads, has had to divert workers from fixing potholes, guardrails and fencing to repair damaged lights before some horrible accident happens. They too, cannot keep up with the copper thieves, who are striking several times a week.
As if Fresno, one of the poorest cities in the country, didn’t have enough problems, what with high unemployment and rampant gangs, crime and methamphetamine abuse. Now, the city of 509,000 in the heart of California’s Central Valley farm country is the epicenter of a plague of copper wire theft afflicting recession-ravaged cities across the country.
“We think we’re a year from having all the lights back,” said Lee Brand, a Fresno City Councilman who devised a plan to thwart thieves by having public works crews entomb the copper wire in over 20,000 maintenance boxes in quick-dry cement. But, he added, “There are a lot of desperate people out there.”
Since the price of copper has risen to record highs-to upwards of $4.50 a pound for scrap, from as low as $1 or so a pound five years ago-it has proven irresistible to cash-hungry scavengers everywhere. But places the recession has hit hardest, that are least able to afford another calamity, are bearing the brunt of the crisis. In Phoenix, Ariz., plagued by foreclosures, copper thieves hit AT&T stations more than 20 times last year, disrupting service to thousands and costing millions of dollars in repairs, security and lost revenue. In Haddonfield, N.J., a suburb a few miles from the busted slums of Camden, copper thieves have been stealing copper downspouts from single-family homes. In McDowell County, West Virginia, one of the poorest counties in Appalachia, copper thieves are doing serious damage to telephone lines, according to reports in scraptheftalert.com, which tracks thefts of copper and other recyclables.
From 2008 to 2011, when the recession was at its worst, metals stolen for resale to recyclers rose 81 percent nationwide, according to an insurance industry report released last spring. Copper accounted for 96 percent of the theft.
Streetlights and telephone lines are obvious targets. But thieves will steal copper wherever they could mine it. They break into padlocked foreclosures and bust the walls for copper wiring and pipes. They steal copper from air conditioners and hook-ups to major appliances, from statues in graveyards, from engines in cars. They black out schools, factories, day care centers, Main Streets. The Department of Energy conservatively estimates the copper wire theft costs the nation more than $1 billion per year. ”
There is no free lunch. People will do whatever they find necessary to survive, even in a police state.
INDY