I grew up in a society where collective will was at the forefront and it…
The US government have total control over domestic policy
I have not much time to write a blog today but the latest US labour market data provides fertile ground for some analysis. The latest Employment Situation Release from the US Bureau of Labor Statistics (published June 1, 2012) covering May 2012 has been called a “bleak jobs report” ((Source) by commentators. I expect a few Op Ed columns from the likes of Robert Barro and John Taylor to name a few who will be saying “see, there have been no gains from fiscal policy stimulus” – ad nauseum. The reality is that the data tells us how effective fiscal policy was in staving of a depression and also that the US government has been pressured into a premature withdrawal of fiscal support and the government contribution to real GDP growth is now negative – hence a slowing economy and poor labour market outcome. While the neo-liberals are hanging onto the notion that governments can do little about the crisis but reduce their net spending the reality is completely the opposite – sovereign, currency-issuing governments such as the US government have total control over domestic policy and the only thing missing is the willingness to use that capacity.
Juxtapose the following statements.
The US President told Americans in his most recent Weekly Address – It’s Time for Congress to Get to Work – (June 2, 2012) that “We will come back stronger. We do have better days ahead” and:
… while we can’t fully control everything that happens in other parts of the world, there are plenty of things we can control here at home. There are plenty of steps we can take right now to help create jobs and grow this economy.
In relation to the state of the US economy, the New York Times article (June 2, 2012) – Weakened Economy Points to Obama’s Constraints – quoted one Charles Calomiris who is a “professor of finance and economics at Columbia Business School” (another school presumably to steer clear of if you are interested in studying economics) as saying:
There’s really nothing the U.S. can do.
The NYTs article (cited above) claims that:
… President Obama … just five months before he faces voters, is at the mercy of actors in Europe, China and Congress whose political interests often conflict with his own.
The US commentators appear to be blaming the state of the US economy on “Beijing … [for] … letting its currency devalue again” and Europe for not pursuing “more forceful action to promote growth or at least contain the threat of financial contagion on the indebted continent”.
But it is clear that the main culprit in the current slowdown in the US is its own government. I fully agree with the President that the US government cannot “fully control everything that happens” but in terms of domestic policy settings they do fully control those.
As a sovereign currency issuer, the US government is not at the behest of the private bond markets (unlike the ECB-unassisted member states of the EMU).
So the US government is completely in control of its domestic policy settings – which include discretionary spending and tax rates (structure).
Note we have to differentiate that level of control with the inability of the US government to control the budget outcome, which is, in part, determined by private spending and saving decisions (via the automatic stabilisers).
That distinction is why setting policy targets in terms of the final budget outcome (as a per cent of GDP or whatever) is a waste of time. The correct policy settings should ensure that the spending and tax decisions are aimed at creating full employment.
In that context the US government is failing because it is being held to ransom by those who haven’t woken up to the fact yet that fiscal austerity damages growth.
While the external environment at present is not particularly helpful to many nations, that doesn’t render a sovereign government (currency-issuing) such as the US powerless.
For example, the US government could overnight announce a Job Guarantee program – whereby it would offer a fair minimum wage to any one who desired work in the public sector. Even if the jobs were not readily designed the wage payments could start flowing.
The expansionary impact of such a policy would be significant and before too long the JG pool would contract sharply as workers regained jobs in the private sector and/or the non-JG part of the public sector.
The US government could also embark on stimulus spending to restore its crumbling public infrastructure and the like. They have the capacity to do that – all that is lacking is the will.
The reason the US economy is delivering such poor labour market outcomes is because the government (at all levels) is now undermining growth. That is easily borne out with reference to the most recent National Accounts data from the US.
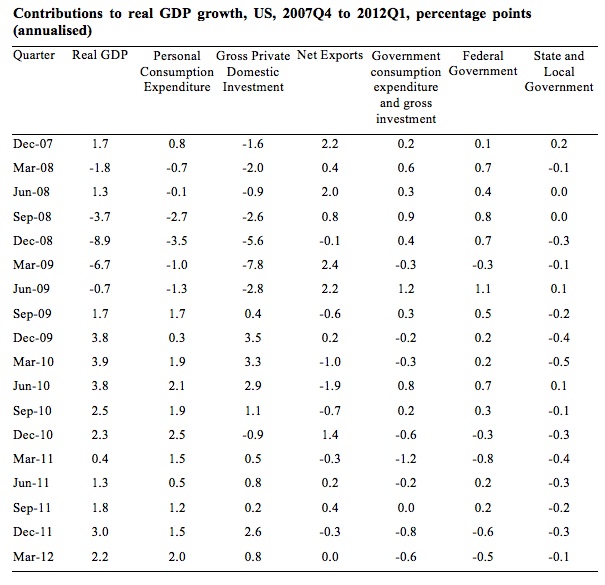
The following table shows the contributions (in percentage points) to real GDP growth from the various expenditure components from the peak of the last cycle (December quarter 2007) to the current quarter – March 2012. The data is available from Table 1.1.2 Contributions to Percent Change in Real Gross Domestic Product.
You can see that during the period of private contraction, the government contribution was almost always positive (there was one quarter, March 2009, when the government sector contributed to the negative GDP result).
The important observation is that the government sector mostly contributed to overall growth even after private spending growth was also making a positive contribution.
The overall contribution from government turned negative in the December 2009 and March 2010 quarters as a result of the austerity being imposed at the state and local government level. The Federal contribution remained firmly positive and allowed the US economy to move on even though private consumption growth was still weak.
The overall fiscal contraction (federal and state/local) is now clearly impacting negatively on real GDP growth since the December 2011 quarter and with private domestic investment also showing volatility any further austerity will damage growth significantly in the coming quarters.
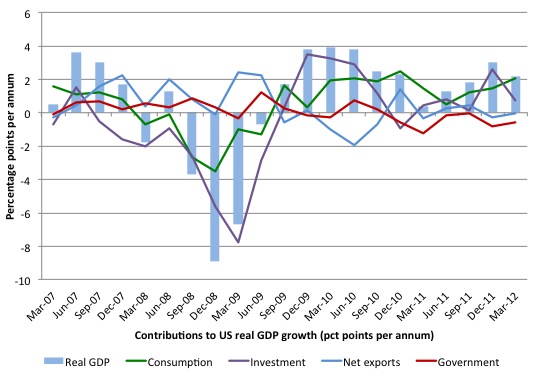
For those that prefer graphical depictions, the following shows the contributions to real GDP growth in the US from the March quarter 2007 to the March 2012 quarter.
It is interesting to note that once the contribution of the government sector started tapering and then went into negative territory the overall real GDP growth right in the US began to fall.
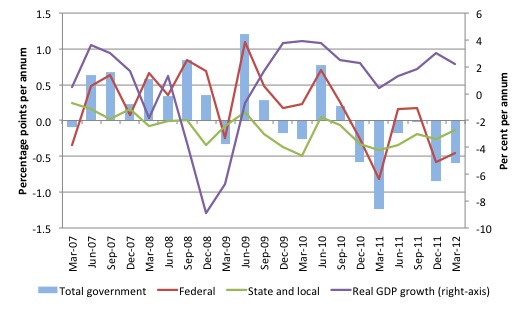
The US situation is clearly complicated by the fact that the state governments were contracting while the federal government was trying to stimulate the economy. It was only the strength of the federal stimulus that ensured that the overall contribution of government to real GDP growth was mostly positive at the crucial time when private sector spending was contracting.
But now fiscal austerity at the federal and state/local levels runs the risk of undermining the nascent recovery that has clearly been underway (in sharp contradistinction to what is going on on the other side of the Atlantic).
The following graph shows the contributions to real GDP growth in the US from the March quarter 2007 to the March 2012 quarter for the government sector and its components – federal and state and local.
It is clear that the fiscal stimulus (trillions of USD) supported the confidence of the private sector. While I am not a supporter of the way the Obama Administration chose to spend the stimulus funds (excessively supporting the financial sector) the fact remained that they attempted to (and succeeded) in limiting the damage of the collapse in private spending.
It is only political ineptitude at present that is saving the US economy because if the Republicans could have their way, the austerity programs would be accelerating more than is obvious from the recent GDP data release.
The US Employment data
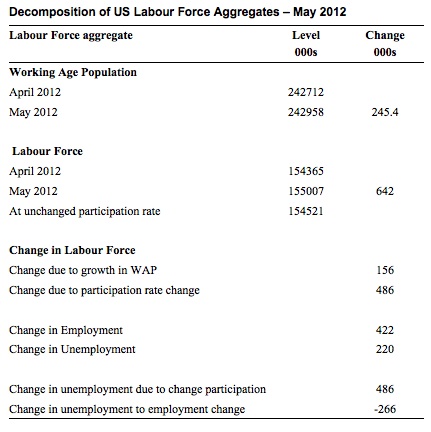
In pronouncing the US employment data as being “bleak”, the Press has also largely ignored the rising participation rate. Some labour force accounting – summarised in the following Table – reveals the following. All labour market data is from the US Bureau of Labor Statistics.
The participation rate rose by 2 points from 63.6 to 63.8 per cent in May 2012. Based on the current working age population, that added 486 thousand workers to the labour force. The civilian labour force was 155,007 thousand workers in May 2012 and would have been only 154,521 thousand had the participation remained at its April value (63.6 per cent).
Employment rose by 422 thousand jobs overall and unemployment rose by 220 thousand.
But if the participation rate had not have increased, the rise in the labour force would have only been 156 thousand instead of the actual rise of 642 thousand.
In other words, while actual the employment change was not strong enough to offset both the natural rise in the labour force due to population growth (the change in the working age population added 156 thousand to the labour force) and the rising participation rate (which added some 486 thousand workers to the labour force).
Thus, while unemployment rose by 220 thousand in May 2012, there were also 486 thousand extra workers looking for work as a result of the participation rate change.
If this trend continued, then eventually these participation rate variations would diminish and unemployment would start to fall as employment growth outstripped labour force growth (and productivity growth).
The depth of the current malaise in the US though is seen when we compare the current participation rate and employment-population ratios to the most recent (pre-crisis) peak – The maximum participation rate in the US was 67.3 in the first three months of 2000. The most recent (pre-crisis) peak has been 66.4 in December 2006-January 2007. So participation is now 3.4 percentage points below that peak indicating a massive withdrawal of the workforce.
The Employment-population ratio also peaked (in terms of the period leading up to the crisis) in December 2006 – 63.4 per cent compared to the dismal 58.6 per cent in May 2012.
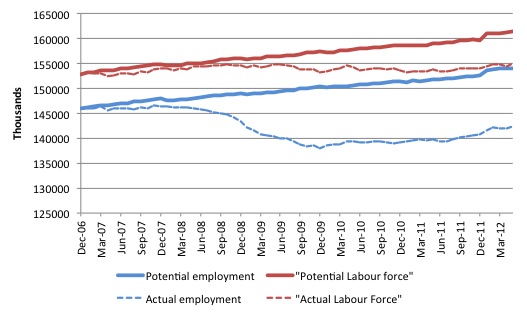
The following graph shows what might have happened if the labour force participation rate had remained at its December 2006 peak (66.4 per cent) and the employment population ratio had have remained at its December 2007 peak (63.4 per cent).
Relative to the peak participation rate there are 6317 thousand fewer workers in the labour force as a result of the lower participation rate. We can assume that most of them are hidden unemployed – that is, would like to work but have given up looking because of the dearth of employment opportunities
If we added them back into the labour force and computed the unemployment rate based on current employment levels then the unemployment rate would be 11.8 per cent rather than the official rate in May 2012 of 8.2 per cent.
Thus, we can conclude that the state of the labour market is in much worse shape than is revealed by the official measure of labour underutilisation – the unemployment rate.
In terms of the employment potential, if employment had have kept pace with the growth in the population (that is, the employment-population ratio had have remained constant at 63.4 per cent, then total employment in May 2012 would be 153,942 thousand.
The actual employment level was 142,287 thousand. So some 11,655 thousand jobs have gone missing as a result of the crisis (the blue line comparison).
Conclusion
I have to catch a flight now. But the growing sentiment that there is not a lot a government can do at present because the state of the world economy is so poor is incorrect. It is in partnership with those who are still trying to push the “fiscal contraction expansion” myth in creating untold damage around the world.
The latest labour market data from Europe is terrible and many nations are approaching Great Depression like outcomes.
The fact is that all sovereign governments have the capacity to restore spending growth in their economies which will drive employment growth and reduce joblessness. The only missing element is the willingness to use that capacity.
The lack of will is entirely due to ideology. The neo-liberals are hanging onto their dominant position as the unemployment queues continue to build.
That is enough for today!
“If we added them back into the labour force and computed the unemployment rate based on current employment levels then the unemployment rate would be 11.8 per cent rather than the official rate in May 2012 of 8.2 per cent.”
Brilliant!
Thanks Bill, great post. Same advice for UK govt?
In polling Romney (a creature of Wall Street) is about even with Obama. We are not even close to the day when people realize how they are being fooled.
SteveK9:
Obama is no less a creature of Wall Street than Romney, it was Obama’s decision to keep on Geithner and Bernanke and to allow money appropriated to the Bush administration for mortgage relief to be used as yet another direct bail out of the banks. At least in this regard the polling appears to indicate that the public understands exactly how little difference there is between the two. With the tenor of US politics I suspect that a Romney “Nixon goes to China” type conversion on deficit spending is more likely than Obama and the Democrats developing any interest in additional support for the real economy: voters are not “contributors”.
The US GDP graph shows a smooth curve down and up with one exception. The June 08 qtr had a spike up instead of following the trend down. This was the qtr that Bush sent out the tax rebate. This rebate was about the same as a (complete) payroll tax holiday. Only problem is oil (gasoline) prices skyrocketed afterwards. Same thing happened following the 2% payroll tax holiday and other stimulus measures. Sure, the US government does have control of the domestic policy, but oil speculators and OPEC have greater control.
Instead of a Job Guarantee program, I think the US simply needs to give the middle class a permanent pay raise by abolishing the payroll tax.
markg says:
How much speculation was done on credit to front-run the stimulus?
Why is speculation with credit legal?
Why is credit legal?
And if credit should not be outlawed then why is it subsidized by government instead of kept in check by Mr. Market?
Tyler,
Both are needed. Bill advocates govt spending as the best and fasted solution. But I think middle class tax cuts (a tax rebate is the same thing) can be just as effective. The 2nd qtr 2008 proves it unless someone has a better explanantion for this data point that is way off the trend line.
The upward GDP bars in 2010 were a result of the US Census hiring.
The Bureau of Labor Statistics reported on Friday that employment in the United States grew by 433,000 jobs in May, but that those jobs included 411,000 temporary workers hired by the Census Bureau. (From CNSNews.com dated June 4, 2010).
Just think what 10+ million jobs would do!
How about the US builds 5 more carrier groups for its navy and maybe a bridge from LA to Honolulu and just prints the money to pay for it? Put lots of people to work, increase demand for all kinds of stuff, more employment in manufacturing and retail, what’s not to like? That’s probably what the Egyptian pyramids were really all about, and the legendary Tower of Babel. It seems there was a real explosion of consumer spending and employment during the Middle Kingdom.