I started my undergraduate studies in economics in the late 1970s after starting out as…
Participation rate puzzles …
Labour market researchers are concentrating their minds at present on how fast the unemployment rate is rising. While that is what the main game is clearly about, there are also interesting trends happening with respect to labour force participation rates. I have been tinkering around with various aspects of this behaviour because I am interested in this notion that there might be wealth effects operating to reverse the usual falls in participation during a downturn. I am also interested in estimating what is happening to hidden unemployment. So here is a brief report on some work to date.
The notion of cyclical upgrading popularised by US economist the late Arthur Okun posited that disadvantaged groups in the economy achieve upward mobility as a result of higher economic activity. One way this operates is via labour force participation. There are two effects noted in the literature: (a) the added worker hypothesis whereby the family (typically a female) increases its participation in the labour market in bad times to supplement family income; and (b) the discouraged worker hypothesis whereby a person stops looking for work as vacancies fall and is recorded by the statistician as not being in the labour force on activity grounds. They would immediately accept a job if it was offered to them so in that respect they are closely related to the unemployed as victims of economic downturn.
From the viewpoint of upgrading, a cyclical rise in labour force participation (indicating that the discouraged worker effect is dominant – discouraged workers returning to the labour force as job prospects increase) provides marginal workers with the chance to share in the benefits of the higher output and employment. Workers who enter the labour force only when they assess the probability of them gaining work has increased are often termed – hidden unemployed. The literature has traditionally indicated that teenagers and to lesser extent women exhibit the largest swings in labour force participation and are therefore more prone to being found among the hidden unemployed in a downturn.
In recent times, as the GFC has ravaged personal wealth stocks – superannuation and other financial asset holdings – it has been hypothesised that older workers who would typically have exited the labour force during recession are now likely to remain in the labour force and seek work. Further, those who may have taken early retirement are hypothesised to have an incentive to re-enter the labour force in search of work to partially restore their depleted wealth stocks.
While the motivations for labour force participation cannot be gleaned from examining graphs and tables, you can at least establish whether the basic elements of these hypotheses are evident in the data.
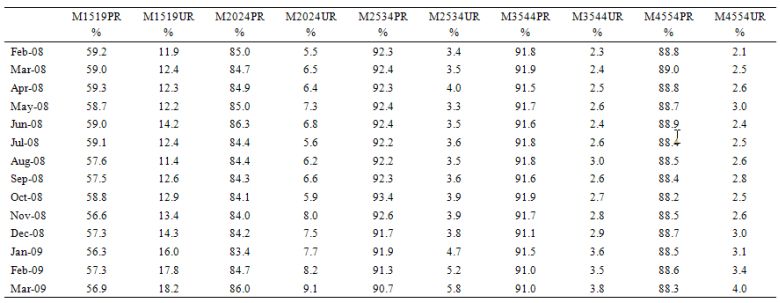
The first table shows the monthly participation rates (PR) and the unemployment rates (UR) for males younger than 55 years of age in the ABS age brackets – 15-19, 20-24, 25-34, 35-44, and 45-54 – since the current downturn began in February 2008. You can see that since February 2008, the teenage males have dropped out significantly as their unemployment rate has skyrocketed. This is why it is so important to quickly create jobs that this cohort can engage with rather than isolating them into training programs. All the male groups shown are experiencing rising unemployment but participation responses are muted apart from the fall for males aged between 25-34 years. More investigation is needed to explain that.
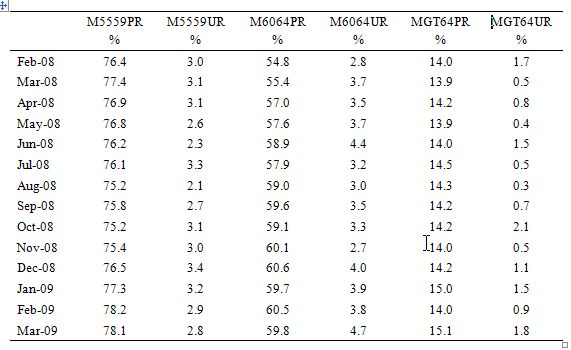
The second table shows the monthly participation rates (PR) and the unemployment rates (UR) for males older than 55 years of age in the ABS age brackets – 55-59, 60-64, and greater than 64 – since the current downturn began in February 2008. For the older males more analysis is presented in the graphs below but are uniformly increasing their participation which is contrary to previous recessions. This is very marked for the males who are 60-64 years, the prime early retirement group. Their participation rates have jumped very sharply over the course of the downturn as has their unemployment rates.
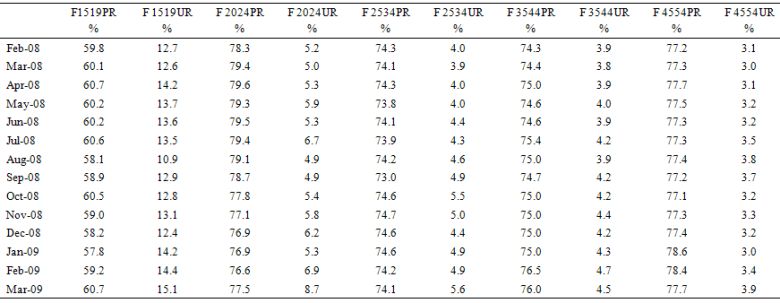
The third table shows the monthly participation rates (PR) and the unemployment rates (UR) for females younger than 55 years of age in the ABS age brackets – 15-19, 20-24, 25-34, 35-44, and 45-54 – since the current downturn began in February 2008. Females pareticipation rates typically fall the most in a downturn but in this downturn that does not appear to be happening yet. Even the teenage women have increased their participation. This needs to be explained.
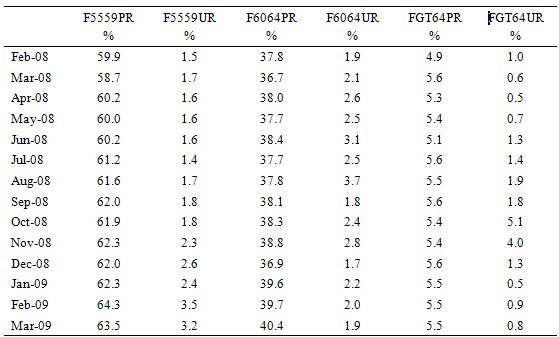
The fourth table shows the monthly participation rates (PR) and the unemployment rates (UR) for females older than 55 years of age in the ABS age brackets – 55-59, 60-64, and greater than 64 – since the current downturn began in February 2008. Here the older women are exhibiting the same trends as the older men an increasing their attachment to the workforce. Again this needs to be explained.
So the patterns this time around are not clear cut in relation to past practice. If there is any rise in hidden unemployment then it will be coming from males rather than females so far in this recession which is significantly different to previous recessions. More about this later.
The following 3-panel graph shows the participation rates dynamics for males 55-59 years of age (left panel), males 60-64 years of age (middle panel) and males older than 64 (right panel) in index number terms. The base year (=100) is the month where the lowest unemployment rate was recorded prior to the deterioration and the graphs show the evolutions in months up to the point that the unemployment rate peaked during that particular episode (1982, 1991 and 2009). Clearly for 2009 the charts just go from February 2008 to March 2009, given that we haven’t seen the unemployment peak yet.
It is clear that in the 1982 recession, each age-group experienced declining participation rates during the downturn. In the 1991 recession, a similar story can be told although the decline in participation is not as stark and the males older than 64 actually increased their participation at various times during the recession.
However, in the current episode we see something quite different. While the 55-59 year old males initially did reduce participation this seems to have reversed as the unemployment rate spiked upwards in the last few months. However, for the 60-64 year old group, the contrast is striking – a significant increase in labour force participation. A more muted increase for the older than 64 males is also currently evident.
What about females? The following 3-panel graph shows the participation rates dynamics for females 55-59 years of age (left panel), females 60-64 years of age (middle panel) and females older than 64 (right panel) in index number terms. So the description above for males applies here too.
In the 1982 recession, the 55-59 year old females clearly exited the labour force in droves as the unemployment rate increased, whereas the 60-64 year old females increased their participation (in two waves). Females who were older than 64 years initially increased their participation but ended up at the peak of the unemployment around where they started.
In the 1991 recession, 55-59 year old females increased their participation as the recession worsened in contrast to their previous cyclical behaviour (1982). 60-64 year old females oscillated and eventually reduced their participation rates as the severity of the crisis unfolded. But the above 64 year old females actually increased their participation rates.
In the current downturn, the striking difference is that all age groups have increased their participation as the crisis has unfolded. There has been a sharp rise in 55-59 year old female participation rates from the outset of the crisis.
Conclusion
So what can we conclude? Well it proves nothing but research is driven by these sorts of anomalies and differences. The task now is to formulate a reasonable model of the behaviour in terms of driving forces and to test whether the decline in wealth has had anything to do with it. It is an entirely plausible hypothesis.
There is definitely something going on that is different and we need to get to the bottom of it.
Hidden unemployment
Hidden unemployment rises with official unemployment as job vacancies dry up and people give up actively seeking work. Typically, females are the most hit by this phenomenon, partly because many of them are not eligible for benefits because of their partners and so have no incentive for remaining active when times are tough. But given the descriptive analysis earlier it is clear that females are unlikely to driving any change in hidden unemployment so far in this recession.
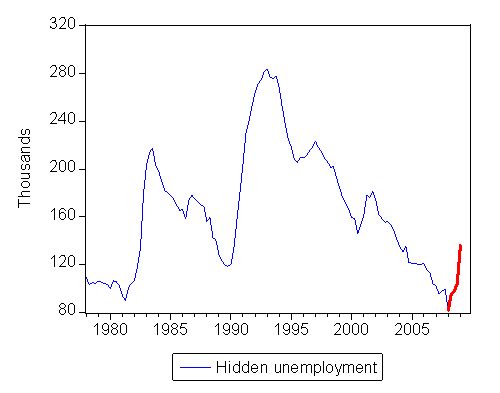
Despite the previous government claiming that they had created full employment, hidden unemployment (discouraged worker effect) remained a significant problem despite the long period of economic expansion since the early 1990s. In May 1981, hidden unemployment was around 90 thousand overall. It took until February 2008 to wipe out the hidden unemployment that had occurred during the two preceding downturns (1982 and 1991) and had persisted during the growth period. Of-course, that was at the top of the boom and since then things have deteriorated again.
If you want to read up on how I estimate this then please read this Working Paper which describes the econometric modelling approach that I use. In summary:
- I estimate a regression to measure the sensitivity of labour force participation rates to the business cycle to gauge the cyclical swings in the labour force;
- I then calculate the participation gap which is the extra labour force participation that would be forthcoming if the economy was at the “full employment” (defined as 2 per cent official unemployment), by multiplying the regression estimate of the cyclical sensitivity of the labour force participation gap by the difference between the full-employment employment population ratio and the actual value of the employment-population ratio;
- The hidden unemployment is then calculated as the participation gap times the civilian population.
The following graph shows what is happening to hidden unemployment in the last year since the labour market has been deteriorating. Hidden unemployment moves sympathetically with the movements in official unemployment. You can see the 1982 and 1991 recessions clearly and we are now heading in the same direction at present notwithstanding the nuances I have been discussing above. The sharp asymmetries in the time series data for hidden unemployment mirror those found in the behaviour of official unemployment and remind us of the huge costs that are incurred as a result of allowing the economy to plunge into recession.
The rise in hidden unemployment is being driven by younger males this time around. I will do some more work on this and report back.
Digression: Children book version of the flu problems
This picture was sent to me today and made me laugh. For non-English speaking readers and I know there are many Winnie the Pooh was written in 1926 by A.A. Milne and the main character is teddy bear called Winnie-the-Pooh who has a coterie of friends including, Piglet, (a small toy pig); Owl (a real owl); Rabbit (a real donkey) and Eeyore (a toy donkey). It is very English although some Australian content comes later in the book with Kanga and Roo (toy kangaroos). Children seem to like it.
Digression: May Day
The Newcastle May Day March is on tomorrow at 10.00 from Pacific Park. We will be there adorned in red and chanting meaningless slogans about eating the rich.
Saturday Quiz
A diabolically difficult quiz is emerging for tomorrow. It will appear some time late in the afternoon unless earlier.


This Post Has 0 Comments