Today (January 22, 2026), the Australian Bureau of Statistics (ABS) released the latest labour force…
The plight of the unemployed – under growth and decay
The Australian economy is growing and adding jobs and the unemployment rate is 5.4 per cent (having risen 0.3 points in the last month). But we avoided the recession courtesy of a timely and sizeable fiscal intervention followed up by strong growth in China (also courtesy of their significantly larger fiscal intervention (as a % of GDP)). But the treatment of the unemployed by our government is appalling. Across the Pacific, the US economy is starting to grow but only just adding jobs and not in sufficient quantities to reduce the unemployment rate and it is persisting at around 9.6 per cent. They didn’t avoid the recession and have laboured for nearly 3 years with the devastating consequences of it. The treatment of the unemployed by the US government is more than appalling. So it doesn’t matter if things are brighter or not, we still vilify the victims of the macroeconomic policy failure. That is what this blog is about. It is a depressing message!
I was incensed this morning by this comment from the Australian Federal Minister of Employment which was quoted in an article by Melbourne Age economics correspondent Peter Martin (November 16, 2010) – Jobless benefit losing ground. The Minister was asked to respond the recent OECD report that criticised the meanness of our unemployment income support payments.
The Minister’s spokesperson said that the Minister “had little sympathy for the OECD’s arguments” and that “best way to help the unemployed was:
…. to assist them to find employment, not to increase income support payments.
The context of that extraordinary statement which I will come back to is the latest OECD Economic Survey, Australia 2010. You can also see an overview of the Survey HERE.
The Survey has been controversial because of its recommendations about the Resource Rent Tax (there should be one) and its flawed criticism of the Government’s National Broadband strategy. I might come back to these issues another day but the main issue for today is their recommendation that the unemployment benefit in Australia should be increased.
The OECD says that:
The transfer system could better tackle poverty, while strengthening incentives to work … additional attention given to disadvantaged groups should not lead to worsening of services provided to less disadvantaged unemployed. Over time, the adequacy of Newstart Allowance should be examined, taking into account both fiscal constraints and community expectations. An option would be to increase the Newstart Allowance for the initial period of unemployment to provide a more adequate safety net, but job search requirements should be maintained and the impact on the incentive to work should be assessed.
So the OECD is playing up to its usual tricks by and large in claiming that there are fiscal constraints on providing adequate income support to the unemployed. There are no fiscal constraints on the Australian government increasing the unemployment benefit (Newstart Allowance). The only issues relate to equity (and this group as I will show are becoming very disadvantaged by mean-spirited government policy) and the risk of inflation (will the rises blow out nominal aggregate demand growth?).
If the answer to the second question is yes and the first is that more equity is required then a combination of unemployment benefit increase and rising taxes on higher income earners would be indicated. In fact, there is no inflation threat that would arise from restoring some relative equity between income support recipients and this would require a significant increase in the unemployment rate.
But even the OECD can see that the unemployment benefit has become a joke in Australia as successive governments (conservative and so-called progressive) have allowed the levels to lag behind income movements elsewhere in the economy (including the aged pension). I last considered this issue in this blog – Why are we so mean to the unemployed?.
For overseas readers here is some background. Unlike the unemployment compensation insurance schemes that operate in most countries, the Australian unemployment benefits system is paid by the federal government at set rates for an indefinite period (subject to work tests). Employers and employees do not contribute to the scheme and everyone gets the same rate (adjusted for marital and parental status).
In the May 2009 Budget, the Federal government increased pensions for all groups except the unemployed and single-parents. For example, single pensioners (other than the excluded categories) received about $A50 a week more and married couples got around $A12 more which represents a major realignment with average weekly earnings.
There is no doubt that the May Budget 2009 pension increases that have now started to flow to the recipients were necessary given how stingy the previous conservative government was to aged-pensioners etc.
But given that the economic crisis has impacted mostly on the unemployed, why did the government not increase the unemployment benefits as well? As it stands, a single adult unemployed worker receives less than half what a single aged pensioner.
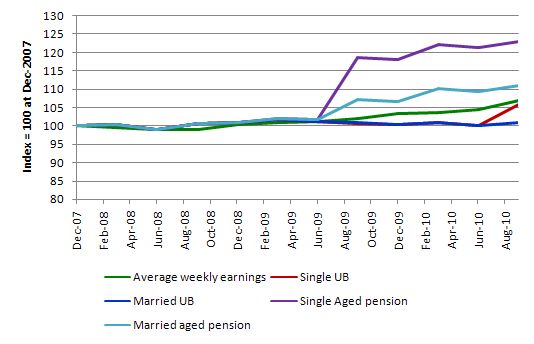
The following graph shows you the evolution of Average Weekly Earnings (green line) the single unemployment benefit (red line), the married unemployment benefit (blue line), the single aged pension (purple) and the married aged pension (aqua) indexed to 100 at December 2007, which was the last quarter before the global downturn struck.
The relativities are stark and unexplainable in economic terms. The Government was starting to lose popularity during the May 2009 budget and targetted the grey vote with a large increase in the pension rates. Meanwhile, unemployment continued to rise and as I note below the recipients of the unemployment benefit fell further below the poverty line.
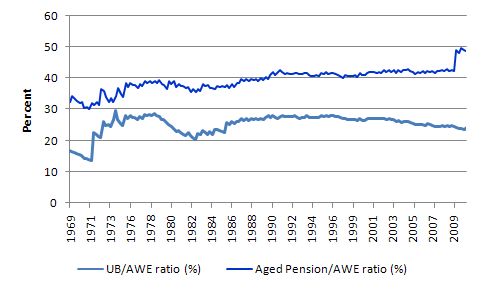
It is clear that since the mid-1990s, the unemployed have been increasingly disadvantaged relative to average weekly earners and the aged pension recipients. This has been a deliberate strategy of the successive federal governments to make life increasingly harder for that group and reflects their conceptualisation of the problem as being of an individual nature rather than a systemic failure.
The single unemployment benefit stands well below any reasonable estimate of the poverty line in Australia. There is not very much you can buy with $32.50 a day after paying accommodation.
The Australia Fair: International Comparisons 2007 report reported that research estimated the poverty line for a single person to be $249 in 2004. The situation is worse now.
While the Government refuses to encounter direct public sector job creation it is forcing the rising number of unemployed to live on below poverty line incomes.
Why is it okay for the aged pensioner to receive significant increases but not the unemployed? The answer is it is politics! The Government has been in power for three years now and has demonstrated that it is as neo-liberal in its approach to the unemployed as the conservatives were. Both have exhibited a very mean-spirited policy attitude to the most disadvantaged workers in the nation.
The following graph shows the ratio of UB to Average Weekly Earnings and the ratio of the single Aged pension to Average Weekly Earnings in Australia from 1969 to 2010. You can get historical pension and unemployment benefit data from FACSIA. The picture tells the story.
Peter Martin writes that:
THE unemployment benefit is shrinking so fast relative to other benefits that by the middle of the century a single unemployed Australian will receive just one-third of the age pension … Unemployment benefits and pension rates used to be similar, but began diverging in 1997 when the Howard government indexed pensions to moves in male total average weekly earnings but left NewStart indexed to the consumer price index.
Martin notes that the “Treasury Intergenerational Report assumes pensions will rise 4 per cent per year on average for the next four decades but NewStart allowances only 2.6 per cent”. The projections are in Appendix A.
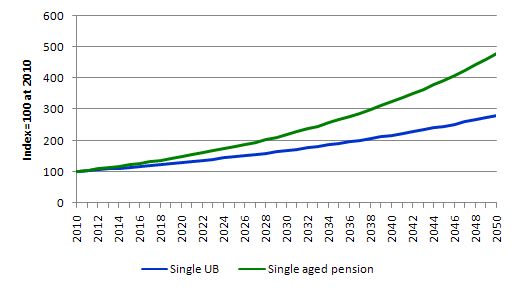
If you do the calculations starting with the single UB as at June 2010 of $A231.40 and the single aged pension of $A481.5 then these disparate growth rates imply that by 2050 the single UB would be $A646.0 per week and the single aged pension would be $A2311.7 per week. The UB/aged pension ratio is currently 48 per cent and by 2050 it would be 27.9 per cent.
The following graph shows this simulated trajectory. What possible reason could there be for that policy position other than a total disregard for the unemployed?
And back to the Minister’s disdain which reflects that total disregard. I suggest he consult the latest data from the Australian Bureau of Statistics and then resign. The Labour Force, Australia, Detailed – Electronic Delivery for September 2010 provides the latest long-term unemployment and duration data for Australia.
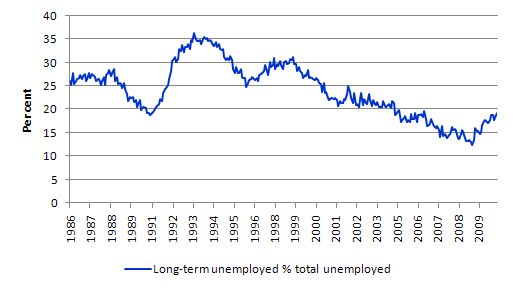
The following graph shows the ratio of long-term unemployment (spells above 52 weeks) to total unemployment. While the ratio fell during the growth period, it has risen sharply again in the slowdown. More than 20 per cent of the unemployed have been in that state for more than 52 weeks (117.8 thousand) with 47 thousand being unemployed for more than 104 weeks.
Further, the average duration of unemployment in Australia remains very high. It is currently (September 2010) 40.5 weeks for males, 33.2 weeks for females and 37.1 weeks overall.
So a question for the Minister: How can you suggest your framework is succeeding when you have more than 117 thousand people out of work for 12 months or more and on average a person who loses their job remains in that state for 37 weeks?
Do you think it is reasonable to submit an (average) unemployed person to gross deprivation for 37 weeks while you take your time “assisting them in finding employment”?
Given Australia is meant to be close to full capacity (not!), doesn’t an average duration of 37 weeks imply your “assistance policy framework” has failed badly?
Or are you subscribing to the idea that these workers are largely unemployable in a growing market?
The reality is that when employment growth is strong enough, the long-term unemployment rate falls quickly. The fact is that employment growth in Australia is not strong enough to absorb these workers who are at the back of the labour supply queue. They are there not because they cannot work but because there are not enough jobs to go around.
So Minister you have had three years to improve things – please tender your resignation!
It is no better in the land of decay – the US
I was interested in the following Economist Magazine article (November 11, 2010) – Unemployment insurance – Cold comfort – which noted that “millions of jobless Americans will soon be left without benefits”.
How can the government leave millions without any income support I wondered (while knowing the answer they would give)?
The Economist said:
America’s recession, a post-war record in terms of length and depth, has left the country with unprecedented long-term unemployment. In October 6.2m people were listed as having been out of work for more than six months, and the average duration of unemployment now stands at 34 weeks, well above the previous post-war record of 20.5 weeks. Government unemployment benefits keep up living standards among the jobless, and so help stabilise a weak economy by bolstering consumer demand. But America’s unemployment-insurance system can no longer cope with a problem of this size.
The conservatives claim that persistent unemployment is the result of a failure of the unemployed to effectively seek work. The culprit is the “subsidy” that they are getting in the form of income support payments from the government. So if you do not extend these benefits then the unemployed, cowed by desperation, will find work.
If you believe that you will believe anything. It flies in the face of all the empirical evidence I have ever seen from any of the advanced nations.
But the “extension debate” is just rehearsing the classic line taken by Layard, Nickell and Jackman in their 1991 book which was extremely influential at the time and basically provided the theoretical case for the OECD Jobs Study (1994) which served as the blueprint for labour market deregulation since the early 1990s and underpinned the pernicious welfare-to-work policies that many governments introduced in the last 15 years.
Layard and Co claimed that outward in the European Beveridge curve, for example, represented a “a fall in the search effectiveness among the unemployed”. They repeatedly have claimed that the persistent unemployment over the last 20 years is the result of workers becoming “too choosy”.
Since that time, the OECD has been constantly pressuring governments to abandon the hard-won labour protections which provide job security and fair pay and working conditions for citizens. They also deemed welfare payments including unemployment benefits to be disincentives to work. Please read my blog – The OECD is at it again! – for more discussion on this point.
An examination of the empirical evidence over the period would suggest that the major claims made by Layard and Co (and the myriad of hangers-on that have followed them) do not bear scrutiny.
While they claimed declining search effectiveness distorted by excessive generous welfare payments caused the rising unemployment rates prior to this recession, it is highly probable that both are caused by insufficient demand for labour. The policy response then is – of-course – entirely different and would emphasis fiscal policy expansion underpinning job creation.
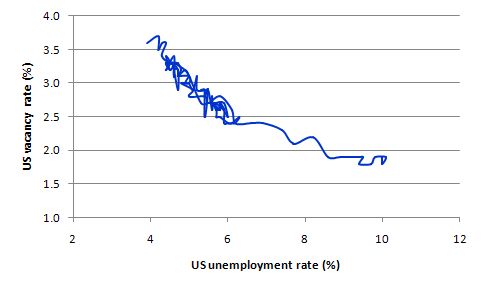
But this argument cannot even be made in the current downturn. The following graph shows the US Beveridge curve since December 2000. The vacancy rate is from the US Bureau of Labour Statistics JOLTS data for job offerings which only begins in December 2000. The unemployment rate is also taken from official BLS data.
Even the mainstream “text book” case would tell you that the data is recording a cyclical event with the sharp movement down a static U-V relationship – this sort of movement indicates a fall in job vacancies and a corresponding rise in unemployment – both being the manifestations of a collapse in aggregate demand and a failure of government policy interventions to redress it.
I covered this debate in more detail in these blogs – Nobel prize – hardly noble – The unemployed cannot find jobs that are not there! – Nobel prize – hardly noble.
The simple truth is that you cannot search for jobs that are not there! No matter how hard you try.
In this paper by US Federal Reserve researchers – – we learn that only a tiny proportion of the unemployment rate (less than one percentage point) could be attributable to “supply-side” impacts. The overwhelming majority of the rise in unemployment is demand-driven.
The nature of macroeconomic demand constraints on the labour market is that individuals are powerless to do anything about them. If there are not enough jobs then that is binding on individuals. Trying to hawk their services for lower than the going wage will not improve their chances of gaining employment. Please read my blog – What causes mass unemployment? – for more discussion on this point.
Given all this I decided to investigate how much things have changed in the US labour market over the last year or so. Is it easier to get a job now than one year ago? Those sort of questions.
These questions can be answered fairly clearly by examining the Gross labour flows that are available from the US Bureau of Labor Statistics. I updated my databases this morning to take us up to October 2010.
To fully understand the way gross flows are assembled and the transition probabilities calculated you might like to read these blogs – What can the gross flows tell us? and More calls for job creation – but then. For earlier US analysis see this blog – Jobs are needed in the US but that would require leadership
As a refresher, gross flows analysis allows us to trace flows of workers between different labour market states (employment; unemployment; and non-participation) between months. So we can see the size of the flows in and out of the labour force more easily and into the respective labour force states (employment and unemployment).
The various inflows and outflows between the labour force categories are expressed in terms of numbers of persons. But a useful alternative presentation is to compute transition probabilities, which are the probabilities that transitions (changes of state) occur. For example, what is the probability that a person who is unemployed now will enter employment next period.
So if a transition probability for the shift between employment to unemployment is 0.05, we say that a worker who is currently employed has a 5 per cent chance of becoming unemployed in the next month. If this probability fell to 0.01 then we would say that the labour market is improving (only a 1 per cent chance of making this transition).
The following table shows the schematic way in which gross flows data is arranged each month – sometimes called a Gross Flows Matrix. For example, the element EE tells you how many people who were in employment in the previous month remain in employment in the current month. Similarly the element EU tells you how many people who were in employment in the previous month are now unemployed in the current month. And so on. This allows you to trace all inflows and outflows from a given state during the month in question.
The transition probabilities are computed by dividing the flow element in the matrix by the initial state. For example, if you want the probability of a worker remaining unemployed between the two months you would divide the flow (U to U) by the initial stock of unemployment. If you wanted to compute the probability that a worker would make the transition from employment to unemployment you would divide the flow (EU) by the initial stock of employment. And so on. So for the 3 Labour Force states we can compute 9 transition probabilities reflecting the inflows and outflows from each of the combinations.
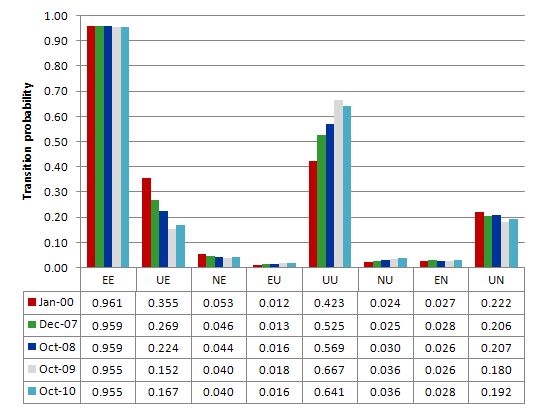
The first graph compares the US transition probabilities as at December 2007, June 2008, June 2009 and June 2010 (see the accompanying Table for values). The data is from the US Bureau of Labor Statistics. I also include the January 2000 observation which is the month when the chances of leaving unemployment for employment (UE) was the highest in this data set (since 1990).
The probability of getting a job if you are unemployed is now (October 2010) 16.7 per cent and has hovered around that mark for some months. In this context, the US labour market has deteriorated over the last two years (October 2008 – UE = 22.4 per cent chance). The chances of remaining unemployed is now rising (64.1 per cent compared to 56.9 per cent in October 2008). An unemployed person is more likely to exit the labour force altogether (19.2 per cent in October 2010) than to enter employment. These transitions (UN) will surely contain a significant hidden unemployment component.
The probability of retaining a job if you have one is virtually unaltered over the period shown although in recent months it has fallen (October 2010 = 95.5 per cent compared to October 2008 = 95.9 per cent).
Further, new entrants to the labour market face a declining likelihood that they will enter employment (4 per cent in October 2010 compared to 4.4 per cent in October 2008).
Conclusion: It is now only slightly easier to transit from unemployment to employment in the US compared to a year ago but much harder than 2 years ago. An unemployed person is much more likely to drop out of the labour force than to enter employment.
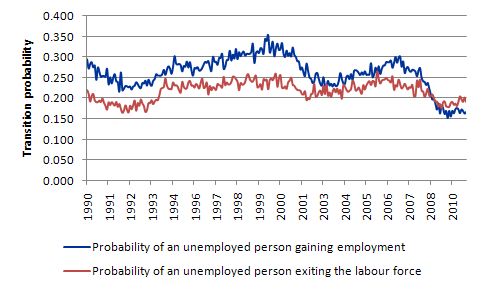
The following graph shows the transition probabilities of an unemployed person gaining employment (blue line) and exiting the labour force (red line) since 1990. You can see that the latter transition overtook the former during the crisis for the first time since the data has been made available.
The Economist Magazine notes that this downturn has “not been normal” (that is, has been more severe than normally is the case) and in that context says:
The economy is still running 7.5m jobs short of its previous peak. A growing number of people are exhausting their unemployment benefits without finding new work. The problem will worsen sharply this winter, as the bulge of 5m workers who lost their jobs in the months after the financial meltdown of autumn 2008 notch up 99 weeks of unemployment. And in April, the emergency benefits all expire anyway. Congress has debated but failed to address the challenge posed by “the 99ers”. Republicans blocked in September the last serious effort to add a new tier of benefits beyond 99 weeks.
The data tells me that factors that led to the decision to extend the benefits in June 2008 are still applicable. The unemployed in the US have not just come down with a fit of laziness!
There is a major shortage of employment and the lost income that will result from this refusal to extend the benefits will be highly deflationary from a macroeconomic perspective (that is, will weaken aggregate demand even further) but also tragic from an individual and family perspective.
Given the congress wants to cut government spending and also cut components of private spending where do they think the growth in the economy is going to come from? The whole debate has gone off the rails. It would be comical if it wasn’t so tragic.
The US National Employment Law Project conducted a National Survey of Unemployment Benefits in November 2010.
They asked respondents the following question:
Congress is now considering whether to continue the current program of federal unemployment benefits for workers who have exhausted their state unemployment benefits but still cannot find a job. Do you favor continuing benefits?
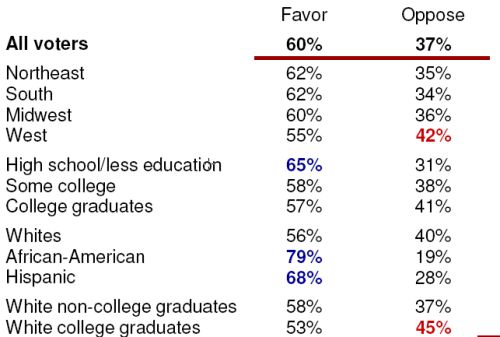
60 per cent favoured continuation (with 35 per cent strongly supportive) while 37 per cent did not favour (with 19 per cent strongly opposed).
The following graphic breaks the support/opposition down by region and demographic cohort.
Respondents also were asked “With which statement do you agree more?”.
73 per cent agreed that:
With unemployment at 9.6% and millions still out of work, it is too early to start cutting back benefits for workers who lost their jobs
While only 24 per cent agreed that:
With the federal deficit over $1 trillion, it is time for the government to start cutting back on unemployment benefits for the unemployed
Interestingly (for me), the political breakdown was:
Yes it was a small survey but I would have expected the results to be much more anti-extension given the way the media likes to present things in the US. I detect a kernel of hope in these results if only there was a political force capable of grooming it.
NELP estimates that by the end of April 2011, 4 million US workers will lose their benefits. The Economist Magazine says:
That will be bad for the economy, as well as the unemployed. Those without jobs or benefits may not show up on the monthly unemployment count: but they still suffer, and still spend a lot less.
Conclusion
Spending equals income. Income growth requires employment growth. You don’t get either by slashing spending.
Digression: Argentina and inflation
I noted some discussion about Argentina the other day and some assertions being made. To clarify matters I wrote to a friend in Buenos Aires who has been a high-ranking government official and now works for an independent agency there. I asked the person this:
There has been a lot of speculation in the Western press about the “out of control” inflation rate in Argentina and lax government spending. The right are picking up on it as another “hyperinflation”. The speculation suggests that the current inflation rate is around 25 per cent which would be more than twice the official rate.
Can you tell me what is actually going on please?
The reply I received (editing out personal matters and other identifying information and correcting the English) was:
In relation to inflation, it is true that there has been some increases in prices, especially food prices, but as we have discussed several times in the past, Argentina is ruled by international prices that are transferred to the domestic market via oligopolistic firms. The rising prices of commodities, affects wage goods such as bread, beef, and its substitutes. This Ricardian conflict (but with exports instead of food imports) has been very clear since the origins of Argentina.
The Government tried some silly tricks to influence the CPI – changing baskets, modifying measurement etc. but this was not accepted by the overall population. Not even the supporters of Kirchner saw through it but it had the impact of confusing the issue. Anyone that shouts a number is right! And this is used as a political weapon by the opposition, since there are not many other issues against the government (corruption could be the other).
My feeling is that there are price increases in many of the good that comprise the “food basket”, as well services for the upper middle classes. All these rises are “legitimised” by the significant increase in real incomes of broad sectors of the population.
Some calculations for Argentina state that there is a structural inflation rate of around 15 per cent every time that the economy grows by more than 4 per cent and that matches historical experience. Obviously there is no linearity in this behaviour.
Anyhow, the political climate is positive to the government which will certainly win next year´s elections.
That is enough for today!


There is something to be said for re-education camps.In Australia the prime candidates for a spell of a year or so are those in the priviledged classes who hold the unemployed in generalized contempt.
They obviously need a reminder – “There,but for the grace of God,go I.
In the US, our reeducation camps are known as “Fox News”.
After several temporary positions in NYC my wife became unemployed in October 2008.
She has been actively searching for job every single day ever since. For these 2 years she had maybe 2-3 interviews. Her job criteria hasn’t been high either.
Well at least she knows whom to blame – President Obama.
Dear Bill,
I don’t know how far I can stretch the analogy, but a cyclone does spring to mind when I consider the monetary system of any country. The satellite view is probably the best perspective for tracking a cyclone, even though an understanding of the mechanics is required: but knowing its direction is essential. Cyclones are huge engines that extract moisture from the oceans and carry it far inland – where there is water – there, is Life! They can also do a lot of damage along the way. The ‘cyclones’ hanging over Europe and the US at the moment are not a pretty sight, and wreck unnecessary havoc!
The thing about a monetary system though, is that it is human made, with similar effects. The three sectoral balances in my understanding, should really be humans, their values, and the skin of the earth. The monetary system has progressed through a primitive tribal, slave, feudal and capital expression, and one defining negative characteristic has been selfishness. The system affects all – but has never been consciously designed for all. Human beings (the self-confessed crown of creation) have never ever sat down and really discussed intelligently amongst each other, the prerequisites for their harmonious survival as a species on the planet. Rather, this crown of creation with eyes shut, just slog it out with each other, screw relations up royally, and foul their own nest! (And we study chimps??)
‘Rule of law’, alliances, fear, and some realisation of the benefits of trade have tempered human self interest; injustice and inequity in the monetary system are often expressed in terms of these – but you never ever read articles about the benefits available to humans if they actually learnt how to cooperate. We teach little kids to ‘share’, don’t we? We marvel at dolphins that cooperatively fish!
That is why I think that it is human values that must also change, as they drive everything else. As values evolve, so do we. I also think that the ‘skin of the earth’ is just a medium for expression, but human beings hold within themselves what is actually precious.
Cheers ….
jrbarch
Bill,
Have you had much to do with the base of Occupational Therapy literature ? Most of what I have read pushed the old neo-liberal line that “the unemployed have nobody to blame but themselves”.
Lack of drive, lack or initiative, unskilled, wrong attitude, mental health issues, substance abuse… and so on were all deemed the major barriers to the unemployed.
Absolutely nowhere will you find a discussion about insufficient demand being the major cause of unemployment.
Alongside Occuaptional Therapy we have Human Resource Management making all the same claims while completely ignoring the real problem of not enough jobs for the unemployed and not enough hours of work available for the underemployed.
The really sad thing is that there is minimal, if any critical studies about Occupational Therapy and how it is based upon neo-liberal pronciples which fail to hold up to empirical testing.
Do you think this is worth investigation Bill or a complete waste of time ?
Regards
Alan Dunn
Thanks for the note from an informed source in Argentina.
I was hoping to make an analogy with Argentina to:
1) To show that the world would not collapse our ears if a Governments defaults on bond issuance.
2) A country can function adequately if the country chooses not to issue Government bonds.
I think it is safe to assume CPI is somewhere in the mid to low teens.
It sounds like Argentina experiences similar problems I have observed here in Asia. Whenever prices of commodities increase. Distribution monopolies or an oligopoly “pass the costs onto consumers” by raising the prices of manufactured foods far in excess of the increase in costs. This was seen during a crisis in rice prices. Often there are trade associations e.g. “National association of bread makers” who actively collude to raise prices and profits. Happens in Australia with mortgages too. How I love free market capitalism. We should call this profit inflation as opposed to wage inflation or supply side inflation.
15% inflation may not be a bad thing in the context of Argentina. I believe they have a rising wages, a developing middle class and a lot of people coming out of poverty. As I suspected a progressive Government is being actively sabotaged by big business in ruthless pursuit of profit.
I would probably not choose Argentina as a case model because of the current state of opinion in the west. The electorate is quite convinced inflation is their worst enemy. Inflation of 2% or 3% can attract rapid vitriolic attack from all segments of media, the Zimbabwe word will be in the commentary somewhere. There’s no differentiation in the media between CPI inflation and inflation of asset classes (e.g. Stock market pumping). There’s even less analysis on the causes of CPI inflation, be it caused by rising wages, rising commodity prices or widening profit margins. Even though, in the right circumstance 15% CPI could be a good thing for a large segment of the populous. The mere mention of inflation, will elicit millions of enraged comments from an apoplectic populous.
It’s not easy to rationalize some arguments. When Mervin King suggested Britons could improve demand by spending their savings, he was nearly lynched. From an MMT perspective he is absolutely correct. However, it didn’t meet with the approval of grannies who have like 10 shillings in their accounts or billionaires who have more money they can spend in 100 lifetimes.
Paradox of the times isn’t it. How many way are there to increase demand and how many of these methods are being rejected?
Ways to increase domestic demand.
1. Increase Government spending (holding taxes flat).
Rejected: Because of the “country is bankrupt” theory and inflation concerns.
2. Private sector to spend savings.
Rejected: Because the private sector has a strong desire to save. This is where all the policy aimed at consumer sentiment is directed (wealth effect and other crazy ideas).
3. Increase net credit.
Rejected: Rates are almost zero but Banks cannot get sufficient custom at the credit terms they demand. There’s also a de-leveraging trend in some sectors.
4. Decrease taxes (holding Government spending flat).
Rejected: Because of “the country is bankrupt” theory and inflation concerns.
If we consider the non-domestic sector. I believe Increasing exports and decreasing imports should improve domestic demand and reduce unemployment. (Correct me if I’m wrong). It’s a slow and hard road to take though.
From the macro-economic perspective I can’t think of any other ways to increase demand. Not rocket science is it? Just pick the method/s you dislike the least.
Andrew Wilkins,
“If we consider the non-domestic sector. I believe Increasing exports and decreasing imports should improve domestic demand and reduce unemployment. (Correct me if I’m wrong). It’s a slow and hard road to take though.”
What you are proposing is called Mercantilism.
Not a good system.
Alan,
I’m not actually proposing Mercantilism. I’m trying to demonstrate there are only a small numbers of categories by which we can increase demand.
I think it’s time the people (as a nation) stopped bickering and chose. Because they have to choose one option or another.
Of the items listed: I’d say Mercantilism is my least favourite. Increasing Government spending is my most favourite.
Looks like the US is aiming for mercantilism and hoping the private sector will spend their savings. Maybe a little credit growth to season the mix.
Interesting that UK unemployment has remained steady again.
Not at all sure what is happening in the UK. It certainly isn’t following the script at the moment.
Alan Dunn. I think you’ve distorted what OT’s about; I’m not sure what your angle is here, trainee OT or what?
I think you’ve overstretched and twisted the point and any connection between MMT and OT.
My wife’s an OT helping people with learning difficulties live better lives improving their ability to seek work and perform at work, it looks at their social support network situation too, by definition the people they are helping have real problems and isn’t looking at the economic theory of society.
“Lack of drive, lack or initiative, unskilled, wrong attitude, mental health issues, substance abuse” these are all real factors that make it harder for people, to deny the reality of that is extremely unhelpful. By definition these people are the last who would find work, but it seems odd to make out they don’t need help or have real problems, how does that help?
I don’t see that OT ‘blames’ people for being unemployed, it looks at the reality of the problems they have personally, OTs are caring and helpful people who do a damn sight more to make a difference than most…for example tracking down a young woman with learning difficulties who was being pimped by her own mother with no help from the police, going out talking to sex workers and people in the drugs industry to find her and try to get her out of that world.
To deny these people have real personal and social issues seems rather cruel and heartless and unhelpful!