I started my undergraduate studies in economics in the late 1970s after starting out as…
Retail sales up but nothing to glow about
Today the Australian Bureau of Statistics released the November Retail Sales data, which is being seen as a likely signal as to whether the RBA will increase interest rates when it meets next in February. The data shows that retail sales are holding up as the fiscal stimulus targetted at consumption gives away to a focus on public infrastructure investment. However, there are other signs that the Australian economy is not yet out of the danger zone.
Other data trends
Yesterday the latest industry survey data suggested that the services sector had not enjoyed a strong seasonal lift in December with “a drop in new orders and modest sales growth”. While the data was not disastrous it promoted a call from industry groups for the RBA to restrain from any further increases in interest rates.
The Key findings from the Performance of Services Index data for December were:
- The seasonally adjusted Performance of Services Index showed the sector did not grow in December.
- The flat growth was the result, in part, of a drop in new orders, with the new orders sub-index falling 8.6 points.
- Compounding this, supplier deliveries fell for the second consecutive month as companies continue to run-down existing inventories.
- The early effects of recent interest rate rises contributed to the fall in new orders.
- Major construction projects helped boost activity in the sector.
Two points to note here: First, the implication that the 3 RBA interest rate rises has damaged new orders is the assessment of the industry group not my own. It is hard to say given the complex distributional impacts that follow an interest rate rise (put simply, creditors gain, borrowers lose) but if there was going to be an impact it would start to show in the December data. So there could be some truth in the assertion.
Earlier claims by industry groups that the rate rises were hurting were unrealistic because they were considering data that had been generated before the rate rises had been announced.
Second, the major fiscal intervention in February 2009 is now focusing on building infrastructure which is definitely benefitting the construction sector. This is another indicator that the fiscal stimulus has helped the economy avoid a worse recession than we have had to bear already.
The other finding from the report was that capacity utilisation has risen slightly to 78.7 per cent which is still well below the high point that was achieved before the recession began (around 85 per cent). So there should be no fears of inflation emanating from the services sector at present.
The major data release from the ABS yesterday was for Building Approvals and this set the commentators into a spin – with some claiming it was sure evidence that there was a dangerous asset price bubble out there that had to be pricked immediately.
For example, we read on the AAP wire that there was a ‘Red hot’ property sector points to rate rise
The data showed “better-than-expected building approvals” with the building approvals rising 5.9 per cent in November. The bets were then immediately laid that the RBA would have to increase rates again in February.
It does not point to a significant danger emerging of a housing price bubble. A lot of people have been holding off for a variety of reasons – falling property prices and also endemic uncertainty. With better times approaching (at least that is the expectation) people have once again starting pushing on with their building plans.
Retail Sales data
And today we had the Retail Sales data, which led the ABS to report that:
In current price seasonally adjusted terms, Australian turnover increased by 1.4% in November 2009 following an increase of 0.4% in October 2009. Turnover remained unchanged in seasonally adjusted terms in September 2009.
So a fairly good monthly result given yesterday’s news that the service sector was flat. It is also slightly higher than I expected and will start pushing the trend up again. Up until December, the trend had flattened out after the burst provided by the fiscal stimulus packages earlier in the year.
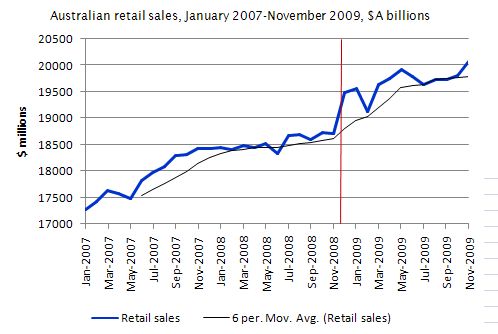
The following graph shows the Retail Sales since January 2007 (in $A millions). The trend is a 6-month moving-average. The vertical red-line is the date of the first fiscal stimulus payments to consumers in December 2008 (barring the car deal a bit earlier) which was followed by the $A42 billion stimulus announcement in February 2008.
If I was looking for a single piece of evidence that the fiscal intervention increased retail sales I couldn’t find a better graph to demonstrate that.
The other point to remember is that when the stimulus packages were announced and the first payments ($A900) made to individuals just before last Xmas, the conservatives fell off their perch ranting at every chance they had that the funds would do nothing because they would be saved.
In February this year, the then Opposition leader Malcolm Turnbull went to the wall opposing the $A42 billion package and claimed there would be no postitive boost to private spending as a result of the handouts. He claimed then that the December 2008 $A10.4 billion handouts had not worked. Other senior liberals also talked about the December stimulus in these terms.
When asked about the ABS retail trade figures, the then Shadow Treasurer, Julie Bishop offered this nonsense to the ABC PM programme at the time:
Clearly it wasn’t spent to the expectations of the Government. Clearly, it will not stimulate the economy and clearly it will not create new jobs.
To which ABS PM Presenter Mark Colvin said:
But clearly it did stimulate the economy to a degree. There was no pre-Christmas slump and as I say quite a lot of people kept their jobs as a result of that didn’t they?
To which the then Shadow Treasurer said:
And what happened to the other about 8.9, nearly $9-billion of that cash package – what happened to that? Well, presumably it was saved. And we can understand why Australian people would do that but the point is cash handouts, however attractive they might be to Australian people, do not achieve the desired outcome of a fiscal stimulus package. That is boosting the economy and creating new jobs and that is …
You will note that neither are now in their positions having been overthrown by bloody coups late in 2009.
Another failure – the former federal treasurer Peter Costello who finally has quit politics (a dismal failure) without getting the top job he coveted for so long also said this about the December 2008 stimulus in the Fairfax press (on February 4, 2009):
Late last year the Government delivered more than $10 billion (1 per cent of GDP, 4 per cent of Commonwealth outlays) to pensioners and families and asked them to spend it before Christmas. Many didn’t. Very sensibly, they thought they should pay off some debt or put away something for the future. The Government urged them to spend it all at once so it could massage the retail figures in the December national accounts – Now we are in the March quarter and there is nothing lasting to show for that money.
He was the vandal that pushed us into surplus for 10 years out of 11 while they were in government and created the “growth strategy” which relied on an ever increasing level of indebtedness building up in the private sector. Over the same period, the quantity and quality of public services and infrastructure was seriously degraded.
The point is that the stimulus clearly boosted spending during the period that it was concentrated as the graph indicates (the significant above-trend retail sales). In doing so, it not only replaced some of the declining private demand but also gave households extra financial capacity to both spend and increase their saving ratio. The data shows that both impacts have occurred in the last year.
So the fiscal expansion provided support for aggregate demand and helped prevent the labour market from totally melting down (it is still bad) but also provided the space for the household sector to increase saving as well as spending because it supported income growth (via the demand impact).
It was never going to be an spend or save situation. That is the beauty of fiscal policy – you can have both.
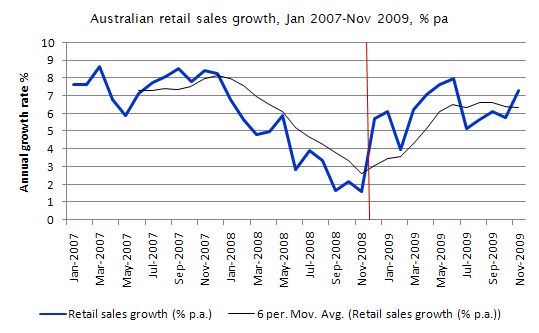
You get another excellent view of the impact of the fiscal intervention from the next graph which shows the annualised growth in Australian retail sales over the same period as specified above. The vertical red line is as before.
Some comparisons with Japan, the UK and the USA
I have been keeping regular track of retail sales elsewhere and the following graphs give you some idea of the relative situation in Australia, Japan, the UK and the USA.
The Japanese data is from Statistics Bureau Japan. The US data comes from U.S. Census Bureau and the UK data comes from the Office of National Statistics.
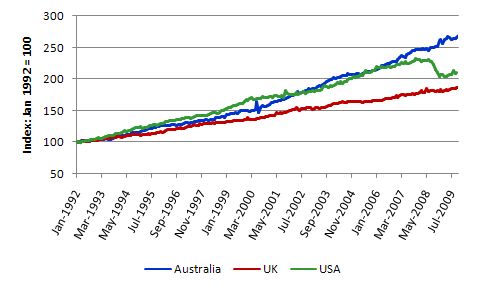
The next graph shows the data converted into index numbers from January 1992 = 100 (exluding Japan because its available data starts in November 2006). The graph is interesting for two reasons. First, it shows that the US and Australia enjoyed fairly comparable growth in retail sales about early 2006 when the signs were emerging that the US economy was slowing. By fairly stark comparison, the UK retail sales growth was relatively sluggish over entire period.
Second, the graph shows the US economy falling off the cliff after June 2008 and the plunge in consumer spending was stunning (as you can see). The highpoint index value in June 2008 was 230.2 and it fell in 10 months to the low-point (in this cycle at present) of 204.0 in April 2009 – a drop of some 11.5 per cent.
By comparison, the UK economy which is also mired in recession (and still hasn’t recorded a positive GDP result for 6 quarters) experienced modest but continued growth in retail sales. The Australian results have been covered above.
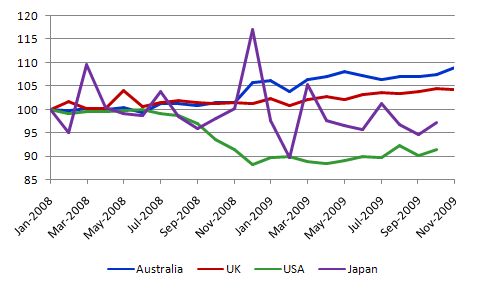
The next graph shows the Retail sales indexed to 100 at January 2008 at about the time that the severity of the crisis was emerging. This graph also includes Japan.
The graph shows that the two largest nations experienced negative growth in retail sales in the recession. Australia clearly stands out as the best performer and that is in no small part due to the relatively earlier and larger fiscal stimulus that the federal government introduced.
By contrast, the British and US governments have been obsessed with monetary policy and in the US case the “alphabet soup” of unnecessary bailouts (see my blog Bernanke should quit or be sacked for more explanation of the soup!). Their fiscal intervention has not been as targetted, was not as early and has not been large enough given the collapse in overall private spending as Australia’s fiscal response.
These differences in no small way explain the different evolution of retail sales in the last 2 years or so.
Directions for monetary policy
All the talk today among the so-called bank economists is that it is highly likely that the RBA will hike interest rates again in February given the strength of the sales data and yesterday’s building approvals result. I think that would be a poor policy decision. According to the RBA’s own logic it increases rates when their is a inflation threat in the proximate future. I cannot see any inflation threat at present or in the coming year.
First, we should not get carried away with the idea that all is well in the Australian economy. The national accounts data for the September quarter was dreadful – creeping along the bottom. The November labour force data was also nothing to glow about.
Second, the RBA has already signalled that they may be within the bottom range of the interest rate level which they would consider monetary policy to be having a neutral impact on the real economy but sufficient to keep inflation expectations at bay.
They made this rather surprising statement in December in recognition of the growing divergence between its policy interest rate and the mortgage rates that the commercial banks are now charging. The greedy banks have hiked their mortgage rates higher than the three RBA increases in late 2009 would have suggested. This has broken the long standing relationship between the policy rate and the commercial rates
Now while the whole notion of a neutral rate is bound up in neo-liberal mantra, the fact that the RBA is now saying this means that it will not necessarily continue increase rates towards 5 or 6 per cent in the foreseeable future. The 5-6 per cent range has been considered the mythical neutral range.
Third, there is no inflation coming via the foreign exchange markets. The Australian dollar has risen sharply against all major currencies in recent months. There is speculation that it will go to parity against the US dollar in the period ahead (it is today at 92.36 US cents).
Today the AUD rose to a 25-year high against the British pound (highest since May 1985).
The ABS also released the International Trade in Goods and Services data for November 2009 today. It showed a shrinking balance on goods and services on October (seasonally adjusted).
Exports fell by 2 per cent while imports fell by 3 per cent. Exports of non-rural goods were down 3 per cent while rural goods rose 5 per cent. On the import side, capital goods (which signal investment strength) fell by 8 per cent, while consumption goods rose somewhat.
Overall these figures do not indicate a booming economy being driven by commodity prices.
Fourth, the other major data release today was the Manufacturing Production data for November 2009 which was nothing to write home about.
So overall with the labour market in poor shape I would hope that the RBA holds fire in February on rates.
If you are interested, I also did an interview for the national ABC radio current affairs program AM this morning. You can hear the segment here and see the transcript here. It is a very tightly edited piece (I talked with them for about 10 minutes).
That is enough for today!


Bill,
you say:
By contrast, the British and US governments have been obsessed with monetary policy and in the US case the “alphabet soup” of unnecessary bailouts (see my blog Bernanke should quit or be sacked for more explanation of the soup!). Their fiscal intervention has not been as targetted, was not as early and has not been large enough given the collapse in overall private spending as Australia’s fiscal response.
However, from what I can see from the graph is that UK is the second best to Australia. Why do you make such claim as above then? Is there more data to this point than just the graph?
But their unemployment is much more serious and their growth is still negative after a record six consecutive quaters. A single graph is usefull but not tell-all.
I did read some years ago that Botswana was considered (by a neo-liberal economist) to be the star success story of Africa at the time because of it’s GDP growth. At the sime time, most of it’s population was living in abject poverty and the country was at the top of the HIV emergency list in Africa.
Apparently, Botswana has a small (and thanks to AIDS, shrinking) population but also has a large and fabulously rich collection of diamond mines. This made it’s growth at the time look like a success story but the fact was that only foreign investors and a handfull of local elite were benefitting.
Australia’s 21.6 mill people bought 985,000 new cars in 2009, while China with around 70 times our population, bought only about 100,000 more new cars in 2009. Only 0.08% of the Chinese population bought a new car in 2009, as compared to Australia, where 4.6% of the population bought a new car. So about 57.5 times more cars were sold in Australia, per head, than in China. Incredibly, our new-car markets are still of comparable size!
This is a good indication of how far China is still behind developed economies. But this will rapidly change this decade and every commodity supply chain will be over-stressed by it, and intense demand-driven price spikes will grow.
Sufficient mineral reserves will be in the ground, of course, but it will not be possible to match transport supply to exponentially increasing demand within China, India, and also Indonesia.
That looks fantastic for commodity suppliers, but it’ll touch off global commodities demand-driven inflation shocks in all economies. Some think that has already taken place, but it was just the beginning of something a whole order of magnitude more intense. It will entail repeated cyclic global price-spikes in commodities, then economic shocks to follow within all economies.
If you look at 2007-2008 you can very clearly see that a pronounced commodity price spike was the major feature of pre-crisis global trade. I think this obvious fact has been far too overlooked and ignored. This was effectively obscured by the subprime and deregulation debacle in the US. But the commodity price spike was obviously a major feature of global economics and affected companies and individuals ability to pay their bills and loans.
I don’t believe the crisis was just about dodgy US mortgages (and other debts) that caused people to not be able to pay their bills as the interest rose. That was part of it. But rising prices and falling wages (so employers could still compete), also ensured people could no longer pay their bills and debts. I think the two combined are what tipped us into actual global financial crisis.
I expect that each time we recover from the last spike and shock, we will strongly boom (Australian commodities already are). Then we will crash into another wall of commodity price spikes (which is already beginning), as demand again goes off scale in the developing world. EU and US stagnation only delays the demand spike peak, but as all begin to recover again just watch how fast commodity prices spike, due to supply under capacity.
The ensuing price shock will ultimately turn into a bust, and unemployment will rise, wages will stagnate or fall, and real economy business and personal loans will tip into default.
I can’t see how we can with current bulk supply technology and capacity deliver enough commodities in time to meet these demand spikes, to stabilise global prices, economies and finance. Developing economies are likewise going to feel repeated severe economic shock.
A Chinese economy with 820 million people employed, growing at 8% per year on imported energy and minerals is a demand spike we can’t supply fast enough via infrastructure growth.
I don’t see how G-20 meetings will change the dynamics of a non-linear growth of demand outstripping the ability to physically deliver enough stuff. So expect more spikes and shocks.
In response to Element – capitalism will find a way. Either supply of the commodities the world demands will increase, or the people who want them will find a way to live with less them. New technology and changing consumer preferences will change the dynamics of demand for various commodities over time as well I suspect. And if we do experience these “price spikes” you are predicting, then the policies Professor Mitchell advocates should work to counteract their cyclical effects.
Nice to see the Malthusians are still with us.
Malthus? Although I’m no economist, my understanding of Malthusian Theory is it has no place for technology, which I specifically mention. In fact the industrial revolution brought about by new technology are what allowed societies to break free of Malthusian cycles.
Chris, the comment wasn’t directed towards you. Sorry for any drama as it was not intended.
Chris,
What ended Malthusianism was not the industrial revolution. It ended when Classical economists abandoned the wages fund doctrine as it was no longer required to support their argument.
Today Malthusianism has come back in a new form where Moral restraint has been substituted for fiscal consolidation and the wages fund has been replaced with the Government budget constraint.
So it’s the same dog with a different leg action.
Alan Dunn says:
Saturday, January 9, 2010 at 13:41
“Chris, the comment wasn’t directed towards you. Sorry for any drama as it was not intended.”
—
Well Alan, you must be directing it at my comment post then.
I’m a geologist, not some Malthusian.
There was an extremely sharp commodity price spike in 2007-08 and the peak coincided with global financial crisis.
Malthusians hold that resources were abut to run out.
I do not, in fact, I strongly disagree with that view.
what I said in the theird paragraph was, “Sufficient mineral reserves will be in the ground, of course, …”
I restricted my comment to discussion of SUPPLY meeting demand–not about resources running out, which was not mentioned at all.
Supply is an issue when scores of empty ships are lining up at your ports and can’t get filled fast enough to meet rising demand and the global price shock a failure to supply can trigger.
And no, I’m not an inflationist either, or any other label you may apply.
Read with open-eyes first, then reply, if you have a point.
Dear Element,
“I can’t see how we can with current bulk supply technology and capacity deliver enough commodities in time to meet these demand spikes, to stabilise global prices, economies and finance. Developing economies are likewise going to feel repeated severe economic shock.”
As technology and methods progress most of these problems will be solved (Eventually of course).
That is the reference. The Malthusians all pretty much assumed technology was fixed.
Your post appears to make the same assumption as well.
The reason I said Malthusians was that it was tongue in acheek. If I had said Luddites then I thought that may have been offensive.
My appologies though if it was offensive.
I still can’t see any valid point Alan.
My point was this:
“A Chinese economy with 820 million people employed, growing at 8% per year [make that 10% now] on imported energy and minerals is a demand spike we can’t supply fast enough via infrastructure growth.”
The growth rate outstrips the rate at which supply capacity can be increased.
It has NOTHING to do with new technology provision or with resource availability limits, or with Malthus or with Luddites.
This a price effect (a spike then crash) with regard to current and future SUPPLY.
Yes it’s true that we will substitue ansd we will increase efficency and we will do without, but that will occur AFTER another spike and crash has already occurred.
The solution is NOT more technology, the solution is a reduction in demand–and that’s not going to happen.
Get me now?
Hence my final line: “I don’t see how G-20 meetings will change the dynamics of a non-linear growth of demand outstripping the ability to physically deliver enough stuff. So expect more spikes and shocks.”