Depreciating yen – look beyond the obvious for the explanation
The editorial in The Japan Times (July 3, 2026) – Little hope for a declining yen amid structural pressures – is an example of how mainstream commentators seize on superficial facts, apply some ideology, and come up with the wrong conclusion. As I have noted many times, the challenges facing Japan are many, not the least being the high savings rate, which is dominated by corporations. After the asset collapse in 1991, Japanese corporations have become large-scale net savers, with strong profits and very weak investment. The corporations are sitting on massive stockpiles of cash and liquid assets, and use on-going financial surpluses (profits greater than costs) to reduce their debt exposure. The 1991 crash (and the massive debt buildup that preceded it) has left a psychological scar on the Japanese firms. The Takaichi strategy is to ‘shock’ the economy into increasing investment rates via a large fiscal injection. This has implications for the currency value, which I will explain.
The article’s motivation is to attempt to explain the depreciation in the yen.
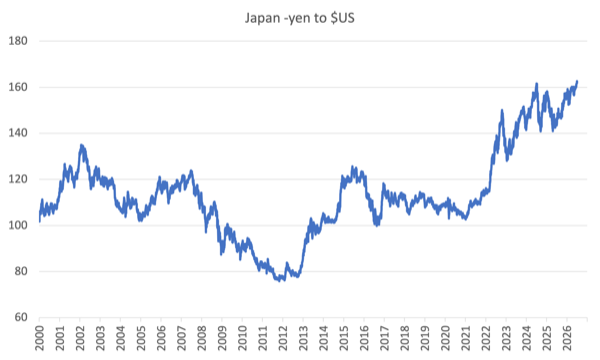
The following graph (daily Tokyo spot rates) shows the movement in the yen against the US dollar since January 2000 (up to July 2, 2026).
Since the last low point (April 22, 2025), the yen has depreciated by 15.4 per cent – a significant shift.
Last week, it was at 162.55, which is just above the so-called psychological value of 160.
160 is thought to be the threshold, beyond which the government intervenes to stabilise the movement.
The so-called psychological threshold (“¥160 to the dollar”) did not trigger any official intervention, which suggests there is no such threshold.
The media are engendering concern using this sort of statement:
The yen had not been as weak since December 1986. In 2012, the currency was exceptionally strong, trading below ¥80 to the dollar. It has weakened ever since, pushed down in value by an underperforming economy, doubts about the geopolitical environment and questions about the Japanese government’s fiscal priorities and balances.
So alarm raised then they sneak in the alleged ’causes’ while leaving out the most obvious causes, which, in fact, point to a solution that is the opposite to the one they propose.
The critics of Modern Monetary Theory (MMT) have also been out there claiming that the depreciation proves that Japan’s continuing fiscal deficits and the high public debt ratio are being rejected by the financial markets and that MMT is clearly wrong.
According to this narrative the Bank of Japan has no choice but to put a cap on bond yields and keep interest rates low or else the debt servicing will become impossible.
This leads to the conclusion that MMT is wrong because there is a financial market constraint on how far fiscal authorities can go.
The article discussed the factors that they claim explain the depreciation:
1. “A key factor in the plummeting yen is the difference in interest rates between Japan and the United States. A sluggish or stagnant economy has encouraged the Bank of Japan to keep interest rates low to promote growth.”
That is not quite right – yes, there has been an interest rate differential since 2021 as most central banks hiked rates on the back of the supply-constrained inflationary pressures.
The Bank of Japan did not hike because they correctly assessed that the inflationary pressures were temporary and would abate quickly once the COVID restrictions were relaxed and factories and ships returned to more normal activity.
It was not because the economy was stagnant.
2. Similarly in the current situation (the Iran War inflation), the Bank of Japan has been reluctant to hike rates as fast as the US Federal Reserve, for example, which has sustained the interest rate differential.
The theory is that the differential motivates investors to borrow yen (at the lower rates) and buy foreign assets delivering higher returns.
The supply of yen into the foreign exchange market then outstrips the growth in demand and the yen depreciates.
There is no doubt that this so-called ‘carry trade’ has some part to play.
But how does one explain the periods of appreciation when the Bank of Japan held rates at zero (and negative) and there was a persistent interest rate differentials with the US?
The reality is that other factors were at work.
For example, in the aftermath of the Great East Japan Earthquake, the yen appreciated further because everyone expected there would be large foreign asset repatriations by insurance companies.
Importantly, the conduct of monetary and fiscal policy then in Japan was not much different to now.
That long period of appreciation was followed by a period of depreciation.
We might also ask what was going on between November 2011 and August 2015, when the yen also depreciated significantly against the US dollar, giving back the shifts that occurred during the GFC?
Did the yen suddenly become an unsafe currency?
And if it did, why did the currency then start appreciating again up to the period when the central bank interest rate differentials began to widen because of the different responses to the inflationary pressures? During that period, net exports went into deficit in mid-2011, as exports growth faltered, and did not return to surplus again until the September-quarter 2016.
It was trade movements that drove these exchange rate changes.
All through these episodes, there have been continuous Japanese fiscal deficits, a rising public debt ratio, a zero-interest rate monetary policy, and large quantitative easing purchases of government debt.
The depreciation that was associated with the ‘Three Arrows of Abenomics’ which aimed to renew economic growth and break out of the deflationary lock is an interesting case study.
The Abe government from 2012 implicitly wanted the yen to depreciate significantly as part of his plan to reflate the Japanese economy.
While many commentators focus on the carry trade impacts, a more plausible explanation is that the shift of the trade balance to deficit at various times in recent years promoted weakness in the currency (excess supply of yen to the market).
The yen depreciation coincided with the tsunami that shut down the nuclear power plants and increased Japan’s energy imports for power generation, driving the trade balance to deficit.
The yen recovered with the return of trade surpluses, followed by depreciation as COVID cut into exports and trade went into deficit.
The Japan Times article now wants to implicate fiscal policy in the depreciation:
Interest rates aren’t the only cause of a weak yen. Equally important is the fiscal policy of the Japanese government. Every policy it is weighing is expansionary, which will add money to the economy, depressing further the value of the currency.
Please re-read the previous paragraphs (-:
The gyrations in the yen exchange rate occurred when fiscal policy was more or less unchanged – expansionary.
The article claims that the Japanese government is pressuring the Bank of Japan via the so-called ‘Article 4’ within the Bank’s legislation to maintain low interest rates (and hence the differential with other central banks) in order to support its planned expansionary fiscal policy strategy.
I considered the ‘Article 4’ issue in this blog post – Article 4 of the Bank of Japan Act 1997 ensures fiscal and monetary policy must work together (May 11, 2026).
The Japan Times editorial considers the fiscal strategy will be inflationary (same old story) and the Article 4 pressure will hinder the Bank of Japan’s attempts to use deflationary monetary policy (rate hikes) to deal with it.
The loss of confidence among investors will then ensure the yen depreciates further.
The editorial writes:
Ultimately, the value of the yen reflects faith in the Japanese economy’s long-term prospects. Stability and strength come from fiscal responsibility and sustainable growth. Markets have little faith that Japan has either. Until it does, the fall will continue.
So more predictions of doom – the type that have been rehearsed for years by economists and financial market commentators and which have consistently come to naught.
Let’s think about what has been going on recently.
What the ‘carry trade’ (interest rate differential) story leaves out is the different rates of investment activity in the US and Japan at present.
The gross investment to GDP ratio in the US went up by 0.1 per cent in the first-quarter of 2026.
Gross private investment grew by (a staggering) 7.9 per cent in that quarter and was dominated by private business spending on equipment – which rose by a (very staggering – if that is an expression) 15.8 per cent.
This is the tech bros going wild on AI expenditure.
Foreign direct investment into the US, also chasing the AI dream pumped $US82.7 billion into the domestic US economy in the March-quarter 2026.
The US Bureau of Economic Analysis also notes that $US232.2 billion came in via FDI in 2025 which was a 49.5 per cent increase on 2024 levels.
Since October 2025, the Takaichi government in Japan has been promising a rather significant fiscal expansion aimed at stimulating investment (both private and public), but to date, the legislation is still progressing.
At present, the so-called – Honebuto no hōshin (経済財政運営と構造改革に関する基本方針) – or ‘Basic Policies for Economic and Fiscal Management and Reform’, which outlines the fiscal policy shifts and is published annually, was released on April 13, 2026 by the – Council on Economic and Fiscal Policy.
After that meeting, the Prime Minister made the following statement- Meeting of the Council on Economic and Fiscal Policy (April 13, 2026).
The Prime Minister reaffirmed her growth strategy via a strong boost to investment and once again indicated that the goal of recording primary fiscal surpluses (obsession of her predecessor) would not dominate her government.
She was more interested in establishing a “new investment framework”:
… that can be implemented with predictability separate from regular expenditures.
In other words, separating out public capital expenditure from recurrent and considering the former to be outside any implicit fiscal financial targets.
Her strategy will be executed from this month and will provide considerable stimulus to the Japanese economy.
The government investment will be of the order of ¥370 trillion over 14 years:
1. ¥101.6 trillion for Artificial Intelligence (AI) and semiconductors (chips).
2. Strong investment in regional industry to speed up supply chains.
3. Large outlays for space development, cloud data centers, defense, and shipbuilding.
Once that large-scale investment plan starts to enter the expenditure stream, then one would expect the depreciation to reach its floor.
The necessary shock is coming
The following graph shows the net saving ratios (Per cent of GDP) for the government, corporate, and household/NPISH sectors in Japan from 1994 to 2024 (using OECD data).
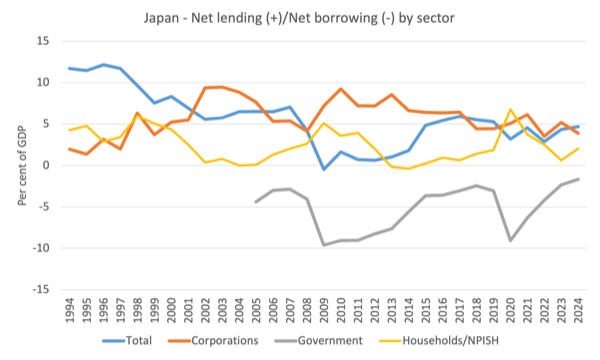
Japan’s corporate savings behavior underwent a historic paradigm shift after the 1991 asset bubble burst.
We often think the Japanese householder is the large saver but the data shows that it is the corporations that are responsible for the low growth in domestic demand.
The shift saw Japanese corporations move from being net borrowers (building up debt through expenditure deficits) to surplus positions, which allowed them to become net savers.
These periods are notable:
1. 1980s (not shown in graph): Gross national saving in Japan fluctuated around 30 per cent of GDP but corporations borrowed heavily to fund asset purchases – which led to the bubble.
2. 1990 – 1994: Corporate investment and borrowing fell sharply after the crash. Corporations accumulated surpluses and started deleveraging.
3. 1995 – 1999: Corporations became a net saver for the first time in recorded Japanese history. Debts were paid down and profits hoarded as cash and liquid balances.
4. 2000-2009: The so-called ‘Lost Decade’ – debt reduced significantly but pessimism dominated and corporate investment was stagnant.
The deflationary psychology became the norm in this period and firms stockpiled liquidity rather than allow the corporate surpluses to flow back into productive investment.
They also were reluctant to pay higher wages.
They were reluctant to expand permanent employment – hence the dramatic growth in the non-regular economy (gig or casualised labour) with precarious work, low pay and retarded productivity growth.
The Takaichi strategy is to get the corporations to liquidate their cash stocks through investment, which will stimulate growth in output and productivity.
That will attract FDI into Japan or reduce the FDI going out to the US in order for investors to gain from the boom and reduce the downward pressure on the yen.
Implications for monetary policy
While the ‘carry trade’ narratives are demanding the Bank of Japan increase interest rates to reduce the differential with the US, and to engage in foreign exchange market intervention (to reverse the depreciation), neither policy shift would be sensible and would run against the fiscal strategy in place.
An appreciating yen would reduce the attractiveness of investment in Japan which would derail the whole strategy.
Japan has already seen what happens when the Bank of Japan is pressured into deliberately trying to reset (appreciate) the yen.
I discussed some history in this blog post – Talk of a Plaza Accord 2.0 should heed the lessons of Plaza Accord 1.0 (December 1, 2025).
The outcome of the decision of the Japanese government (being blackmailed by the US government) to revalue the yen was – Endaka – a recession induced by an overvalued yen.
The response from the policy makers to the loss of export competitiveness was to cut interest rates and introduce a large fiscal expansion to offset the loss of exports.
This was a relatively large stimulus and fuelled the asset price bubbles in Japan’s financial and real estate markets through the late 1980s.
The Bank of Japan cut rates by around 3 per cent and held the lower rates through to 1989.
By 1987, the recession was gone and the economy was booming again.
The boom coincided with a period of over-the-top neoliberal relaxation of banking rules which encouraged wild speculation.
However, the massive expansion and freeing up of lending restrictions saw significant credit growth feeding into real estate prices (tripling between 1985 and 1989).
The – Japanese asset price bubble – burst in spectacular fashion in late 1991 (early 1992) following five years in which the real estate and share market boomed beyond belief.
The collapse in 1991-92 marked the beginning of what has been termed the – Lost Decades – which was marked by a trend slowdown in economic growth, deflation, and cuts in real wages.
Mainstream economists claim that the bubble and the burst were due to excessive domestic fiscal stimulation rather than anything to do with the Plaza Accord.
But the fact is that the Plaza Accord deliberately undermined the Japanese economy to benefit the US lobbying interests.
The evidence supports the view that it was not the macroeconomic stimulus that caused the asset price bubble but rather it was the financial deregulation in the 1970s and 1980s that was the culprit.
If the Bank of Japan tried to tighten monetary policy to push the yen back up now, a similar dynamic could easily unfold.
Conclusion
We will see whether the yen depreciation is finite once the Takaichi expansion enters the expenditure stream.
That is enough for today!
(c) Copyright 2026 William Mitchell. All Rights Reserved.

Bill,
Guess you saw the standard response to this ‘news’ as per The Age’s Senior business columnist
‘A line in the sand for the world’s largest creditor has been breached.’
https://www.theage.com.au/business/markets/a-line-in-the-sand-for-the-world-s-largest-creditor-has-been-breached-20260706-p60cur.html
On the stereo: Dianna Kiss, Melbourne supergroup featuring Ross Hannaford.
Professor Bill seems to hold Prime Minister Takaichi in high regard as a politician, but to me, she appears to be cut from the same cloth as President Trump.
I am deeply concerned.
Dear Kazuhiro Goshima (at 2026/07/06 at 9:02 pm)
ご意見をいただき、誠にありがとうございます。貴重なご意見に感謝いたします。
“seems” is a dangerous word to use – and requires an evidence base to substantiate. In fact, I don’t have high regard for the Japanese PM as a politician. Her ideological position is far removed from the one I hold.
However, on the economic front, she understands that the previous austerity that Mr Ishiba was pursuing cannot be the way forward and I agree with that.
I don’t hold her views about immigration, China, social policy, Imperial history, etc.
I also don’t like heavy metal music (-:
All the best
bill
Weak currency is desired by all export oriented economies, including Japan’s. It is the importers who need to worry about a cheap yen, not the exporter. (Hence Europeans’ and Americans’ efforts to convince Japan to allow the yen to appreciate.)
The weak yen and low interest rates encourage equity investment, reducing the cost to businesses of equity financing, and encourage capital investment by businesses. Of course, the weak yen also benefits exporters by making their products appear cheap on international markets.
A wish for a stronger yen is, in effect, a wish for less capital investment and a lower Nikkei stock index. (The Nikkei tends to move inversely to the yen.)
The BOJ can have a higher yen anytime they want it. Truth is, they greatly prefer the weak yen.
How this carry trade is explained in most instances is out right nonsensical.
You buy Yen from with your X currency which is most likely appreciating against the Yen, then use this “weak” Yen to buy US Dollars or Euros or AUD as they are both have psycopath ahem hawkish technorats in Central Banks, you use US dollars/Euros/AUD you’ve gotten to buy asset classes priced in this currency which return anything above 0% otherwise this would be just holding the currency. However how does this reverse back? Are you not placing significant risk or in “harms way” losses(from movements) & costs of transactions from all these currencies? Are their any incentives carry this out e.g lower tax liabilities? A short read from WikiPedia tells us about “legs” which may involve commodities or goods coming your way instead of Yen to be exchanged into your currency which may rhyme or correlate with recent Current Account trends for Japan but your never hear or read such an explanation. In the 2nd we learn that there are NO abritrages thus this condition must hold else you are in major “harms ways”.
If this is the cause Bill for rising import numbers do export-led corporations care for what seems like will be tenuous or endless drag for Takaichi’s Fiscal policy infrastructure, this seperating re-current & investment/development expenditures, to bear fruit? Takaichi may have 352 out of 465 seats or 75% but events of UK’s Labour govt, 411 out of 650 or 63%, point to chinks that can materialize almost over a few seconds just staring at the thing.
Bill as for USA Foreign Direct Investment at 232 Billion for 2025 do you have embargoed info? I don’t see this figure from BEA. Latest release was 2025 July 22nd -> https://www.bea.gov/data/intl-trade-investment/direct-investment-country-and-industry
Regards,
A. Teri