The Australian Bureau of Statistics (ABS) released the latest labour force data today (July 23,…
Interest rate hikes will not get ships moving through the Strait of Hormuz more quickly
Regular readers will know that I hate the term NAIRU – or Non-Accelerating-Inflation-Rate-of-Unemployment – which is a concoction invented by mainstream economists to maintain unemployment at elevated levels (to keep the working class in its place) and give cover to central banks to run monetary policies that redistribute income from poor to rich. If you search through my archives you will find many posts about this abomination. I am guessing with all the supply disruptions at present as a result of the illegal invasion of Iran, central bankers will start claiming interest rates will have to rise to curb the inflation. They will dress these claims up in some economic sophistry and the official speak will talk about NAIRUs and excessive demand pressures. Yet, in reality, there is no such justification. The rate rises will not get ships moving through the Strait of Hormuz more quickly, just as they did not get factories back to work during the early COVID period. Here is some analysis to support my point.
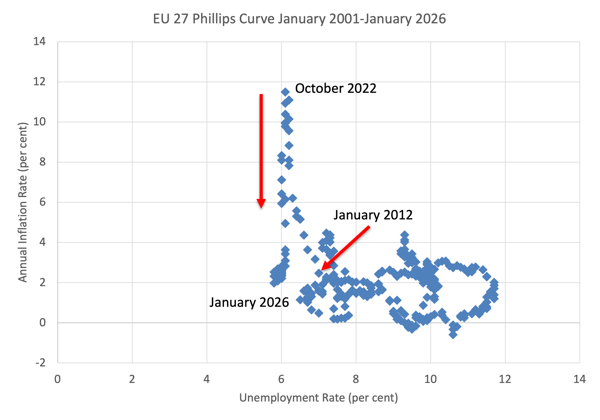
First, please examine the following graph which is a Phillips curve from the EU27 from January 2001 to January 2026, using monthly data.
It shows the official unemployment rate on the horizontal axis (per cent of labour force) and the annual CPI inflation rate (per cent) on the vertical axis.
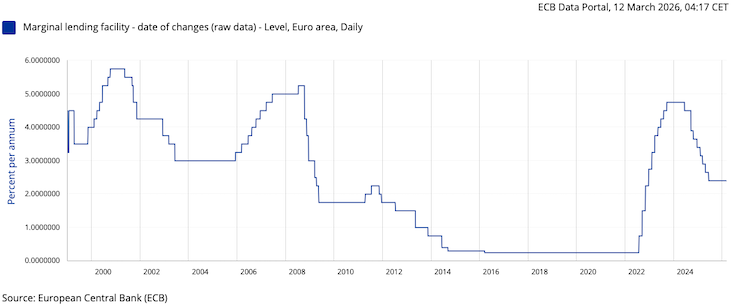
The ECB began hiking its policy rate on July 21, 2022 (a 50 basis points rise).
The next graph shows the ECB’s Marginal Lending Facility rate, which is the interest rate that commercial banks pay for overnight emergency loans from the ECB to cover shortfalls in their reserve positions.
It is the rate that sets the upper bound on short-term market rates and is considered to be the most restrictive rate that the ECB adopts at any point in time.
In terms of the Phillips curve graph, a very interesting pattern emerges in the period leading up to the inflationary peak in October 2022 and the current period (shown as January 2026 – the latest observations).
The official unemployment rate is very stable in the period between December 2021 through to the current period, and actually drops a few points in the last months of 2025.
Within that period two major things have happened:
1. Inflation went from 5.3 per cent (December 2021) to a peak of 11.5 per cent (October 2022) then to a low of 1.98 per cent (January 2026).
2. The ECB increased its policy rate from 0.25 per cent (December 2021) to a peak of 11.5 per cent (between October 2023 and May 2024) October 2022) then to 2.4 per cent (January 2026).
There were 10 interest rate rises over the hiking period and then 8 cuts in quick succession.
Meanwhile the official unemployment rate was relatively unchanged.
Quiz question:
How would you reconcile this data with a theory that said if the official unemployment rate is above the NAIRU, then the inflation rate should decline and if the official unemployment was below the NAIRU, then the inflation rate should accelerate?
Answer:
There is no reconciliation possible.
Quiz question:
What does the failure to reconcile the real world movements in the key aggregates mean for your assessment of the validity of the NAIRU concept as an explanation for the trajectory of inflation and as a guide for monetary policy settings?
Answer:
The NAIRU concept does not appear to offer a credible basis for anything!
Here is another graph that tracks the ECB policy rate and the monthly change in the unemployment rate from December 2021, when the inflation period began and January 2026.
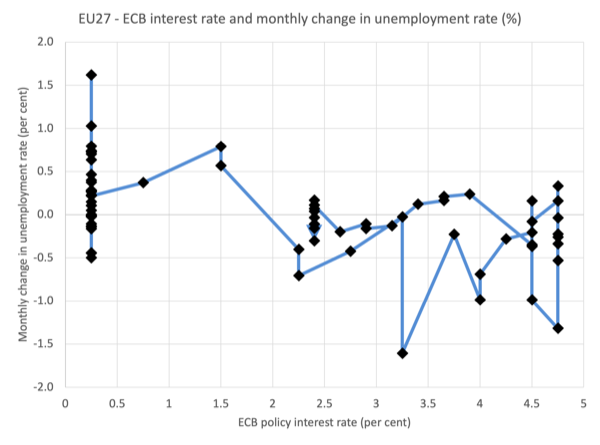
Think about this logically.
1. In February 2022, the official unemployment rate was 6.3 per cent and the inflation rate was 6.21 per cent.
2. The NAIRU concept is based on a theory that says if the official unemployment rate is below the NAIRU then excessive demand forces in the labour market will drive up the inflation rate.
3. Between February 2022 and October 2022, the inflation rate rose 5.3 points, yet the unemployment rate fell by just 0.1 point – in other words, within the statistical error range.
4. That would suggest, if the NAIRU concept was relevant, that the inflation rate is highly (ridiculously) sensitive to shifts in the unemployment rate, which is not borne out if you examine the history of the relationship, where inflation shifts go up and down even when the unemployment rate is going in opposite directions to the implied NAIRU causality.
5. Further, the concept says that for the inflation rate to decelerate (start falling), the unemployment rate must rise above the NAIRU as a sign of excess supply conditions in the labour market.
6. Between October 2022, the inflation rate fell 9.5 points, yet the unemployment rate was also largely stable, even declining a little (by 0.3 points).
7. Inference: if the NAIRU concept was believable, then the unemployment rate over that latter period must have been above NAIRU, given inflation was declining fast.
8. Question: How could the unemployment rate be below the NAIRU in the first period and above the NAIRU in the second period, when the rate had basically been constant the whole time?
9. The only way that could have happened, if the theory had traction was that the NAIRU suddenly shifted – fell significantly.
10. Question: Within the theory, what would cause that?
11. Answer: a major structural shift – perhaps a significant reduction in income support payments to the unemployed (to make them more desperate and force them to take any job available), or perhaps some major change in training, etc.
12. The likelihood of a major structural shift occurring in such a short period is zero really – if we examine all the usual suspects that mainstream economists cite as ‘shift’ factors in NAIRU estimates, none appear to have changed much over the period, which means the shifting NAIRU escape plan is void.
Thinking about this further, it becomes apparent that the ECB (like most central banks, bar Japan) pushed up rates without any credible justification.
Why did it keep pushing up rates from July 2022 through to September 2023, when the inflation rate peaked in October 2022 and fell rapidly after that?
Then they realised they were in danger of killing growth completely (or so they thought) and so they cut madly again – 8 times.
And if you look at their policy behaviour over their lifespan it looks irrational to me.
They hiked rates early on which helped trigger the major recession in Germany and France in 2003-04.
Then they reduced rates quickly, to deal with that, which triggered the massive shift in speculative real estate funding to the Southern Eurozone states (those states did not have the recession).
Then they hiked in 2006 even though there was no hint of an inflation breakout, only to get caught by the GFC and the need for drastic action.
And so on.
None of that made sense at the time and in retrospect looks like a decision-making body that is somewhat unhinged.
The more evidence-based explanation for this recent data, which central banks around the world (bar Japan) refused to concede when they were hiking rates was that the inflation episode had nothing much to do with excess demand (over spending) factors and was a transitory phenomenon driven by the COVID-19 impacts on supply, Putin’s folly in Ukraine and the OPEC oil price hikes (to take advantage of the COVID impacts).
The rate hikes were justified by claims that the unemployment rates were too low (relative to some vague estimates of the NAIRUs).
But what we observed cannot support that justification.
Further, the trajectory of the inflation really had nothing to do with the interest rate decisions of the central banks.
It went up for supply-side reasons and was always going to come down again as those supply constraints eased.
What the interest rate hikes achieved was a massive redistribution of income from low-income mortgage holders to high-income holders of financial assets that gained income flows when the rates rose.
All of this has bearing on the current discussions in the light of the illegal and disgusting attacks on Iran by the US and Israel.
I add Australia to that list too, given our obsequious Prime Minister has now committed military forces to the Gulf, allegedly as a ‘defensive’ measure (that is the ‘spin’ anyway).
The legal experts have now declared that the government has taken Australian back into a war that we have really no truck with and is just another example of how the US and the Zionist lobby pushes our government around.
But once again, there are calls to hike rates (especially from bank economists who work for institutions that will profit handsomely from the hikes).
Why hike?
Well they claim the oil prices are rising and other commodities will increase in price which will feed through to the inflation rate.
Pavlov’s dog then calls up the RBA and other central bankers and recites the NAIRU (il)logic.
Rates go up.
But soon the oil is flowing and inflation falls again.
The rates hike had nothing to do with the ships moving through the strait in the Gulf again.
More folly.
A supply shock constructed for ideological purposes as a demand-excess.
But somewhere in the ECB there are people who realise that the NAIRU notion is bunk
Earlier this week (March 9, 2026), the Economics area in the ECB released an article – Low unemployment, plenty of labour: what does it imply for wage pressures? – which effectively said that the NAIRU concept is bunk.
Without saying it of course.
I note that one of the authors is working in the ‘Supply Side, Labour and Surveillance’ area of the ECB.
They noted that:
Euro area unemployment is near record lows and set to fall further. Yet wage growth is projected to moderate. Paradox? Not if you look beyond unemployment – immigration, participation, job switching and firms’ hiring intentions are all part of the story.
The authors write that:
Slack in the labour market is a key input into monetary policy assessments of wage growth and inflation … It is about the balance between effective labour supply and firms’ demand for workers. The unemployment rate has traditionally served as the central indicator of labour market slack in policy discussions.
This is the implicit NAIRU logic.
The problem that the authors declare is that the unemployment rate is falling in the Eurozone yet so is wages growth (which means via mark ups demand pressures on the inflation rate are falling – if there were any).
They puzzle:
This combination seems puzzling because the classic Phillips curve relationship predicts that a lower unemployment rate would make firms bid up wages to attract workers.
The answer to the ‘paradox’ that they propose is that the official unemployment rate is not a reliable indicator of labour market slack (and by implication inflationary pressures).
They find that the growth in employment since the pandemic has not come from significant reductions in the unemployment rate (at a scale necessary to supply workers for the extra jobs created) but rather from increased participation from outside the labour market (particularly women and older males) and increased net inward migration.
The data shows that:
Foreign workers added around 53% to the employment creation, compared with 29% between 2015 and 2019. Similarly, more nationals were activated, contributing 43% to job creation, compared with a 9% increase in 2015-19.
In other words, as firms increase their demand for workers, they draw on increases in the labour force rather than hiring out of the unemployment pool, which means they do not have to offer higher wages to attract workers from other employment, as they might do if there was a shortage of workers overall.
Their conclusion is that:
Assessing labour market slack requires a broader perspective than the unemployment rate alone … Labour supply can change due to migration, participation, underutilisation and hours worked, while labour demand may weaken without triggering layoffs … reflects the fact that the labour market is less tight than the unemployment rate alone would suggest.
Conclusion
In other words, justifying rate hikes based on alleged ‘tightness’ of the labour market – with a reference to the unemployment apparently being below the estimated NAIRU – is invalid.
That is enough for today!
(c) Copyright 2026 William Mitchell. All Rights Reserved.
Bill Mitchell and I agree on many things. But I disagree with Bill when it comes to the NAIRU. I agree with Bill that the use of the NAIRU to justify a sacrificial pool of unemployed labour is an abomination. The situation is made worse by central banks who raise interest rates in the belief it will stifle demand, when it only makes the rich richer and the poor poorer.
In my opinion, the NAIRU does exist at some rate of unemployment above the frictional rate and should be used to determine the point where would-be unemployed people entering Full Employment offices are directed from the conventional public sector job queue – where people are employed in an expanded public sector on award wages as private sector employment declines – to the Job Guarantee queue.
I see the NAIRU as the employment rate at which further increases in total spending (aggregate demand) leads to an accelerated rate of inflation, whatever the cause. Where labour is the limiting factor of production, the NAIRU will exist at the point where labour demand and supply mismatches emerge, which are inevitable as full employment is neared. Better education and training policies and better co-ordination between the public and private sectors, as Bill highlights, would reduce the mismatches and keep the NAIRU as close to the frictional unemployment rate as possible, thus increasing the number of people who can be employed on award wages without raising the inflation rate and correspondingly reduce the number of people that need to be employed in the JG on a minimum living wage to achieve full employment and control inflation.
Where labour is not the limiting factor of production – more specifically, of ‘sustainable’ production – the NAIRU will exist at a higher unemployment rate than one where labour demand and supply mismatches emerge. One doesn’t need to observe the inflation rate to know that natural resources are currently the limiting factor of sustainable production. In fact, because natural resource prices do not properly reflect the true cost of their extraction and use, the inflation rate is the last thing I’d look at to ascertain if natural resources are the limiting factor of production. All I need to do is compare the Ecological Footprint with Biocapacity, where at the global level, the former is currently 80% larger than the latter, to know that natural resources and waste sinks are far and away the limiting factor of sustainable production.
Demand for natural resources and reliance on waste sinks to absorb wastes far exceeds what the planet can sustain. If the rate of throughput (Ecological Footprint) was limited (capped) to the ecosphere’s regenerative and waste assimilative capacities (Biocapacity), natural resource prices would go through the roof and hyperinflation would be triggered at an unemployment rate corresponding to about half the current level of real output. Witness the impact of the current Middle-East crisis on oil prices. It’s just a taste of things to come in a world where humankind either gradually reduces its natural resource demands in managed way or has it inflicted upon it by disaster (ecological collapse). In many ways, it’s the price we pay for allowing the population of humans to reach 8.25 billion. Everything held constant, the global Ecological Footprint would be less than global Biocapacity if the population was the same as it was in 1964, the year I was born (3.25 billion). And some people say that population numbers is not an issue!
All that aside, the NAIRU in a world where the rate of throughput was immediately capped and brought within global Biocapacity would be astronomically high. Of course, capping the rate of throughput at the sustainable rate could not be done overnight. The cap would have to be gradually reduced. But it needs to start now, and it should have started in the 1970s when the Limits to Growth Report warned us of the impending crisis if growth-as-usual continued. In fact, in the 1970s, the global Ecological Footprint was a fraction less than global Biocapacity. All that would have been required at the time was the setting of a cap at the existing rate of throughput.
Given where we are at present, trying to achieve ecological sustainability is scary enough. Trying to achieve and maintain full employment in a world where the required reduction in the rate of throughput would render natural resources an increasingly limited factor of production only makes a just transition to a sustainable world more difficult to achieve. It’s also less likely given the lunatic psychopaths running the world at present. And don’t think for a moment that the Left-leaning political parties are the solution. Their policy failures over the past half century is one of the reasons for the rise of the lunatic Right. The outlook for humankind doesn’t get much worse than this, I’m afraid.
Dear Phil Lawn (at 2026/03/2026 at 11:53 am)
Thanks for you comment.
You wrote:
You do not disagree with me on the topic of the NAIRU – just the terminology.
One of my earlier academic articles – W.F. Mitchell (1987) ‘The NAIRU, Structural Imbalance and the Macroeconomic Equilibrium Unemployment Rate, Australian Economic Papers, June – Download – was based on some of my PhD work on exploring whether the steady-state unemployment rate was cyclically-invariant or not.
If you read that article you will see why we do not disagree.
As you know, the mainstream economists all considered the NAIRU (or the Natural Rate of Unemployment) to by determined by structural factors and invariant to the economic cycle, the latter assertion was important to them because it meant that fiscal policy could not reduce it.
This was important because they wanted to challenge the notion that there was a Phillips curve trade-off between inflation and unemployment and claim that inflation would only stabilise when the unemployment rate was equal to the NAIRU (the so-called steady-state unemployment rate). They claimed that if governments tried to reduce the unemployment below the NAIRU for political reasons via a fiscal expansion then all they would achieve would be accelerating inflation.
They claimed that the only way the NAIRU could be reduced by the government if they introduced structural reforms – cutting unemployment benefits, making it harder for workers to remain on benefits, etc
My work challenged that notion and demonstrated (via theory and econometric analysis) that in fact, the structural imbalances that increase during a period of rising unemployment are sensitive to fiscal policy, which means that an expansionary fiscal position can reduce the steady-state unemployment rate.
I introduced the term – Macroeconomic Equilibrium Unemployment Rate (MRU) – to replace the NAIRU terminology.
The MRU is the unemployment rate where the conflict between labour and capital over the distribution of income stabilises and the wage-price dynamics produce a stable inflation rate.
So it is like a NAIRU in that sense, but is embedded in the power struggle between these conflictual parties and has no connotations of ‘market clearing’ or full employment as does the NAIRU.
Importantly, fiscal policy expansion can drive the MRU down and so a trade-off is restored.
best wishes
bill
Thanks Bill for your comment and pointing out the MRU. I read what you wrote some time ago and I’ll go back over it. On rereading my comment, I noticed a mistake in what I typed, not that it would change the point you make in your comment. The first sentence in my third paragraph should say “I see the NAIRU as the unemployment rate at which further increases in total spending (aggregate demand) leads to an accelerated rate of inflation, whatever the cause.” In my comment, I wrongly said “…. NAIRU as the employment rate ….”
Bill do you agree with Neil here:
https://new-wayland.com/blog/interest-price-spiral/
“The Myth
The standard line is this from the Bank of England
when we raise Bank Rate, banks will usually increase how much they charge on loans and the interest they offer on savings. This tends to discourage businesses from taking out loans to finance investment, and to encourage people to save rather than spend.
Overall if loans go down, financial savings must go down by exactly the same amount.
If you want the stock of bank loans to come down, while the stock of bank deposits goes up, then, unfortunately, reality won’t let you do that.
As MMT shows the cost of credit is incorporated into the cost of all goods and services. The higher the interest rate, the higher the price.
The Myth recommends pouring fuel on the fire. MMT recommends a permanently zero Bank Rate, and making central bankers, along with their expensive entourage, redundant.”
If you don’t agree why not?
Bill
in case you missed this one
https://www.abc.net.au/news/2026-03-15/australia-interest-rates-goodbye-to-low-unemployment-experiment/106445522
You are spot on about the increase in rates; the poor beggars in the outskirts of Melbourne with massive mortgages are screwed by incompetent buffoons calling themselves the RBA.
I should have said all Australian cities and country people, who have no choice but to rely on legacy motor cars and trucks – the RBA are a disgrace and should be sacked.