Over the last several years, I have been indicating that I think we are in…
Australian labour market – unemployment rises sharply – hard to reconcile with RBA’s excess demand claim
The Australian Bureau of Statistics (ABS) released the latest labour force data today (March 19, 2026) – Labour Force, Australia – for February 2026 – which showed that the labour market had gone backwards. While employment growth remained positive, full-time work fell. The participation rate rose, which in some situations indicates a positive outlook as workers re-enter the labour market to take advantage of the increased employment opportunities. In this case, I think it signals more desperation as cost-of-living pressures rise, given that a lot of older workers came back into the labour market looking for work. Unemployment rose sharply (0.2 points) to 4.3 per cent. Together with underemployment, there are now 10.1 per cent of available labour not being used it is ludicrous to talk about Australia being close to full employment. There is substantial scope for more job creation given the slack that is present. The RBA’s claim that there is significant excess demand in the overall economy, which they used on Tuesday to justify a further rate hike, is hard to reconcile against this data.
The summary seasonally-adjusted statistics for February 2026 are:
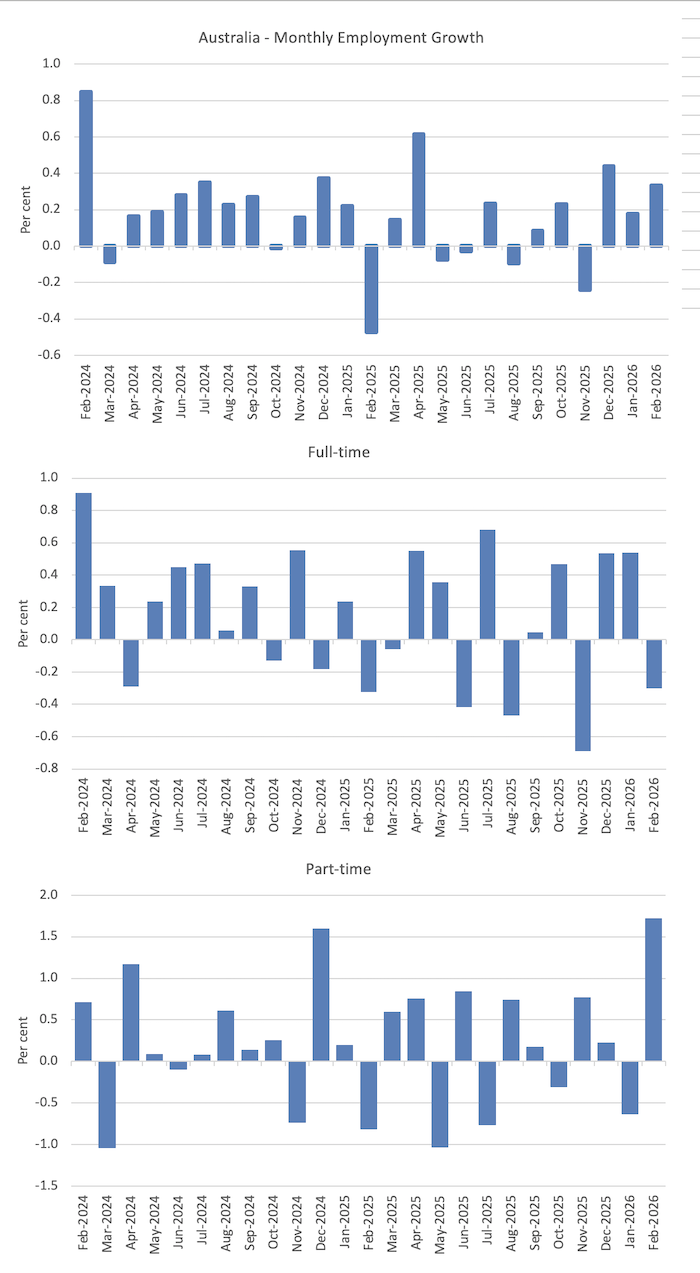
- Employment rose 17,800 (0.3 per cent).
- Full-time employment fell 30,500 (-0.3 per cent).
- Part-time employment increased 79,400 (1.7 per cent).
- Unemployment rose 35,000 to 659,100.
- The unemployment rate rose 0.2 points to 4.3 per cent.
- The participation rate increased 0.2 points to 66.9 per cent.
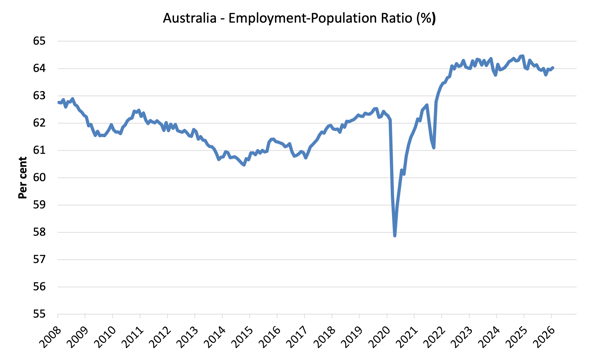
- The Employment-population ratio was steady on 64 per cent.
- Monthly hours worked fell 3.5 million (-0.17 per cent).
- Underemployment was steady on 5.9 per cent (falling 1.9 thousand to 902 thousand).
- The Broad Labour Underutilisation rate (the sum of unemployment and underemployment) rose 0.16 points to 10.1 per cent.
- Overall, there are 1,561.1 thousand people either unemployed or underemployed.
The ABS press release – Unemployment rate rises to 4.3% in February – noted that:
The seasonally adjusted unemployment rate increased to 4.3 per cent in February …
The number of unemployed people grew by 35,000, contributing to the 0.2 percentage point increase of the unemployment rate in February …
Employed people grew by 49,000. Part-time employment rose by 79,000 people, while full-time employment fell by 30,000 people …
Hours worked fell 0.2 per cent this month, with more people working part-time hours instead of full-time hours.
The growth in both employment and unemployment has resulted in a 0.2 percentage point increase to the participation rate, which was 66.9 per cent in February.
Summary
1. I guess the RBA will be happy that the economy is finally looking like it is about to tank.
2. It is hard to see how this data supports a view that the economy is operating above capacity.
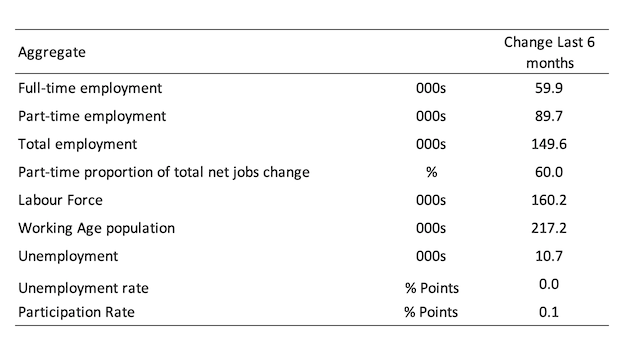
3. Over the last 6 months, 60 per cent of the net employment change has been in part-time jobs, a sure sign of a weakening labour market where firms hedge and cut hours before laying off workers.
4. The rising participation – which was particularly present among older workers – does not in my view suggest a strengthening of employment opportunities, but rather indicates increased cost-of-living difficulties among households.
2. Total labour underutilisation (sum of unemployment and underemployment) rose to 10.1 per cent, which indicates the extent of the wastage.
Employment growth maintains pace with underlying population growth
Employment rose 48.9 thousand while the labour force rose 83.9 thousand, which meant that unemployment rose by 35 thousand.
- Employment rose 48,900 (0.3 per cent).
- Full-time employment fell 30,500 (-0.3 per cent).
- Part-time employment increased 79,400 (1.7 per cent).
The following graph shows the growth in total, full-time, and part-time employment for the last 24 months.
The following table shows the shifts over the last 6 months which helps to see the underlying trend.
The Employment-to-Population ratio provides a measure of the state of the labour market that is independent of the supply shifts in the labour market (driven by the shifts in the participation rate).
The underlying working age population grows steadily while the labour force shifts with both underlying population growth and the participation swings.
The following graph shows the Employment-Population ratio was stable on 64 per cent.
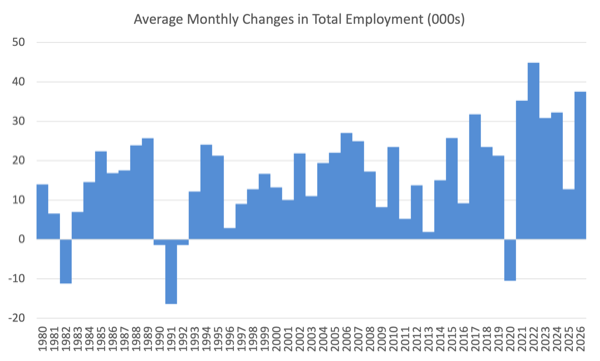
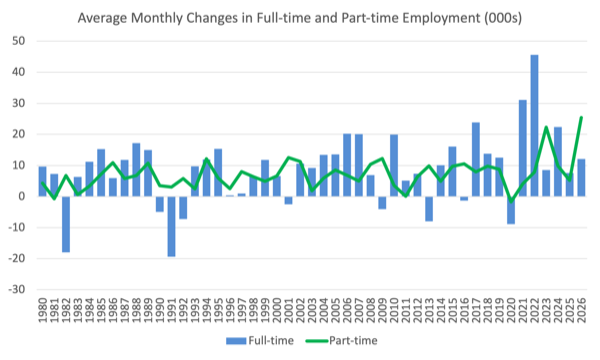
The next graphs show the average monthly change in total employment (first graph) and full- and part-time employment (second graph).
Obviously, the two-month result for 2026 doesn’t tell us much yet.
For total employment the monthly average changes were:
- 2022 – 44.8 thousand
- 2023 – 30.8 thousand
- 2024 – 32.2 thousand
- 2025 – 12.7 thousand
- 2026 to date – 37.5 thousand
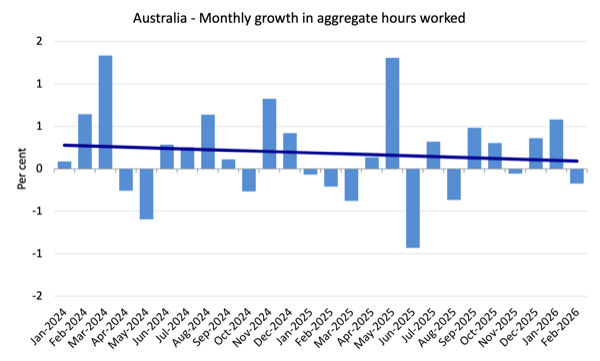
Monthly hours worked fell 3.5 million (-0.17 per cent) in February 2026
Stronger on the back of growth in full-time employment.
The following graph shows the growth in monthly hours worked for the last 24 months, with the straight line being a simple linear regression to indicate trend.
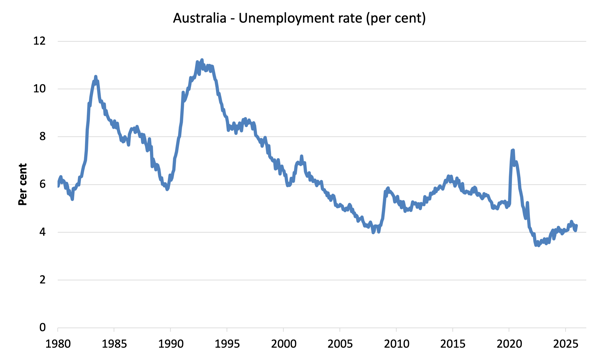
Unemployment rose 35,000 to 659,100 in February 2026
The unemployment rate rose 0.2 points to 4.3 per cent.
Essentially, labour demand failed to keep pace with the growth in supply.
The following graph shows the evolution of the official unemployment rate since 1980.
What was the impact of the rising participation rate on unemployment in February 2026
The participation rate rose 0.2 points, which added to the labour supply and meant that unemployment rose.
The question is what would the unemployment rate have been, given the employment growth in February, if the participation rate had not also risen?
These concepts help us answer this type of question:
- The labour force is a subset of the working-age population (those above 15 years old). The proportion of the working-age population that constitutes the labour force is called the labour force participation rate. Thus changes in the labour force can impact on the official unemployment rate, and, as a result, movements in the latter need to be interpreted carefully. A rising unemployment rate may not indicate a recessing economy.
- The labour force can expand as a result of general population growth and/or increases in the labour force participation rates (and vice versa).
The following Table shows the breakdown in the changes to the main aggregates (Labour Force, Employment and Unemployment) and the impact of the fall in the participation rate.
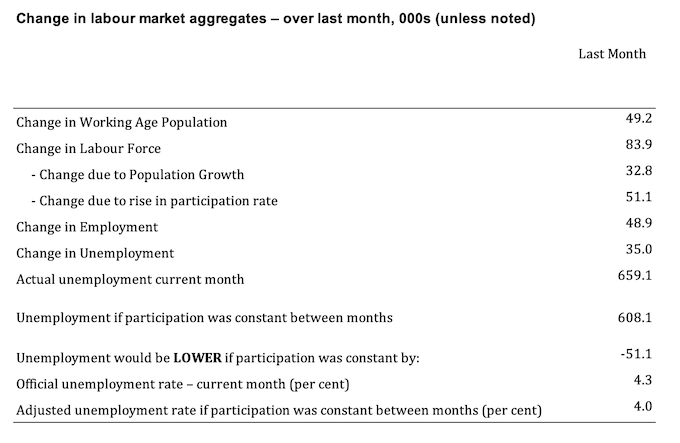
The change in the labour force in February 2026 was the outcome of two separate factors:
- The underlying population growth added 32.8 thousand persons to the labour force. The population growth impact on the labour force aggregate is relatively steady from month to month; and
- The rise in the participation rate meant that there were 51.1 thousand MORE workers in the labour force (relative to what would have occurred had the participation rate remained unchanged).
- The net result was that the labour force rose by 83.9 thousand.
Assessment:
1. If the participation rate had not have risen in February 2026, total unemployment, given the current employment level, would have been 608.1 thousand rather than the official count of 659.1 thousand as recorded by the ABS – a difference of 51.1 thousand workers (the ‘participation effect’).
2. Without the rise in the participation rate, the official unemployment rate would have been 4 per cent rather than its current official value of 4.3 per cent.
Broad labour underutilisation – rose 0.16 points in February 2026
Given the drop in full-time employment and hours worked and the substantial increase in part-time work, it is hard to understand how underemployment actually fell marginally.
I suspect that result will be revised next month.
- Underemployment was steady on 5.9 per cent (falling 1.9 thousand to 902 thousand).
- The Broad Labour Underutilisation rate (the sum of unemployment and underemployment) rose 0.16 points to 10.1 per cent.
- Overall, there are 1,561.1 thousand people either unemployed or underemployed.
The following graph shows the evolution of underemployment and the Broad labour underutilisation rate since 1980.
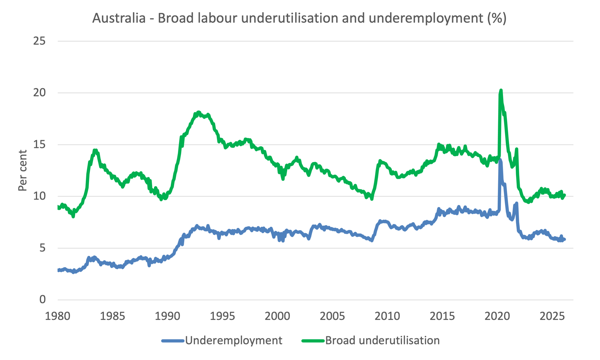
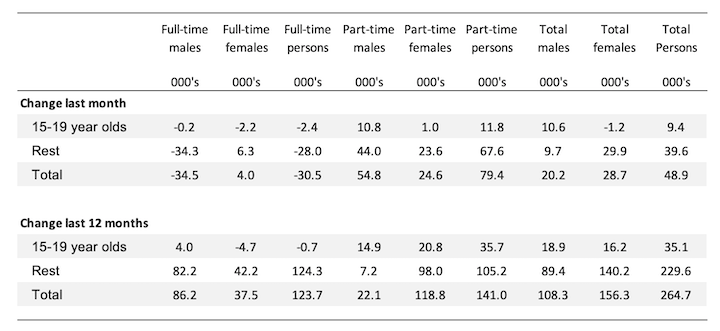
Teenage labour market – more part-time work
This month, teenagers saw part-time employment grow significantly as the overall part-time employment fell.
- Full-time employment fell 2.4 thousand (-1.3 per cent).
- Part-time employment rose 11.8 thousand (1.7 per cent).
- Total teenage (15-19) employment rose 9.4 thousand (1.1 per cent).
The following table summarises the shifts in the teenage labour market for the month and over the last 12 months.
To put these changes into a scale perspective (that is, relative to size of the teenage labour force) the following data reports the shifts in the Employment-Population ratio for teenagers.
The Teenage Employment-Population ratios and their monthly changes in February 2026 were:
- Males: 49.2 per cent – up 1 point.
- Females: 53.0 per cent – down 0.3 points.
- Total: 51.0 per cent – up 0.4 points.
Conclusion
My standard warning to take care in interpreting monthly labour force changes – they can fluctuate for a number of reasons and it is imprudent to jump to conclusions on the back of a single month’s data.
- The labour market went backwards this month.
- While employment growth remained positive, full-time work fell.
- The participation rate rose, which in some situations indicates a positive outlook as workers re-enter the labour market to take advantage of the increased employment opportunities. In this case, I think it signals more desperation as cost-of-living pressures rise, given that a lot of older workers came back into the labour market looking for work.
- Unemployment rose sharply (0.2 points) to 4.3 per cent.
- Together with underemployment, there are now 10.1 per cent of available labour not being used it is ludicrous to talk about Australia being close to full employment. There is substantial scope for more job creation given the slack that is present.
- The RBA’s claim that there is significant excess demand in the overall economy, which they used on Tuesday to justify a further rate hike, is hard to reconcile against this data.
That is enough for today!
(c) Copyright 2026 William Mitchell. All Rights Reserved.
Blissex comments predicts huge natality surge
“ Which means that in a few generations western Europe and other low natality areas will have a huge natality boom: as currently having sons as pension assets is no longer necessary then women with a with a low reproductive instinct will make themselves extinct and those with a high reproductive instinct will outbreed them.”
Kes March 20th 07:35
No idea who Blissex is but this pro-natalist comment is a direct lift from the far right white supremacist “Great Replacement Theory”.
I totally refute this particular form of racism.
“Reproductive instinct” is a very nasty concept, redolent of both Social Darwinism and eugenicism.
And it is totally ignorant demographically.
Firstly, there is zero prospect of developed economies, (North America, Europe, Japan, S. Korea, and Australasia) seeing Fertility Rates return to levels over 2.1.
All immigrant community FRs tend to merge with local populations within one or two generations. Check the UK’s ONS data to validate this demographic tendency.
Secondly, FRs in less developed nations will decline progressively as levels of female education rise and with improved wider public health, just as it has done in every other country passing through the demographic transition.