I have been 'at it' for decades now but it never ceases to amaze me…
Inflation in Japan – invariant to monetary policy and be careful what you wish for (tourism)
I have been thinking about the recent inflation trajectory in Japan in the light of constant calls from mainstream economists (including a bevy of private bank economists who work for institutions that benefit from interest rate hikes) for the Bank of Japan to hike rates. What is driving CPI movements? What has been the impact of the yen depreciation? How responsive is the yen to interest rate changes anyway? Are the increasing yen-denominated import prices being passed on to Japanese consumers? Why doesn’t the Takaichi Administration realise that in the face of supply-side inflation the remedy is not to expand fiscal policy? How responsive are exports to the yen depreciation? All these questions are popping up continually in the financial media at the moment. I haven’t time today to answer all these questions in detail. But here is a start.
On Wednesday night in London (that is, Thursday Australian time) I helped launch a new venture the – MMTUK Policy Research Group.
It was an interesting night, and it is good to see that our work is still attracting activism and this is a group that is determined to influence economic and social policy in the UK.
So by the time I returned home here in London, it is early in the morning (London time) and so I will keep this somewhat short.
Movements in the yen
The Japanese currency (yen) has depreciated in value significantly since the pandemic began.
The following graph shows the monthly movement in the yen against the USD from 1980 to January 2026.
A downwards movement indicates an appreciation of the yen against the USD and vice versa.
The major appreciation prior to the Plaza Accord in the early 1980s is striking as the USD struggled to hold value.
I wrote about that in this recent blog post – Talk of a Plaza Accord 2.0 should heed the lessons of Plaza Accord 1.0 (December 1, 2025).
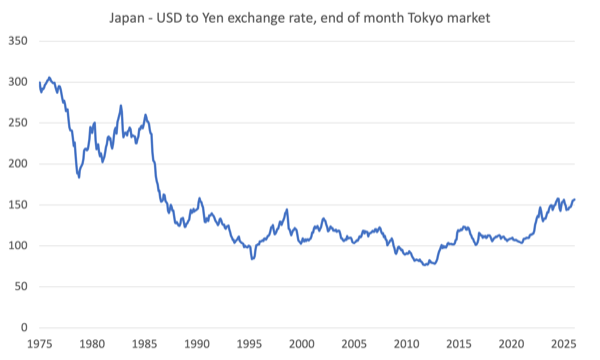
However, it is the recent period that is of interest in this discussion.
The most recent yen depreciation began in February 2021 (in January 2021 the yen was at 103.79).
Inflation didn’t start to accelerate until early 2022.
Putin invaded Ukraine for the second time in February 2022, after previously beginning hostilities in 2014 (Crimea annexation etc).
OPEC oil price hikes began in earnest in November 2020, rising from USD36.152 per barrel to USD114.83 per barrel at the peak in May 2022.
It was the energy price hike that precipitated the rise in inflation, followed by supply constraints that followed the relaxation of Covid restrictions and the Putin folly.
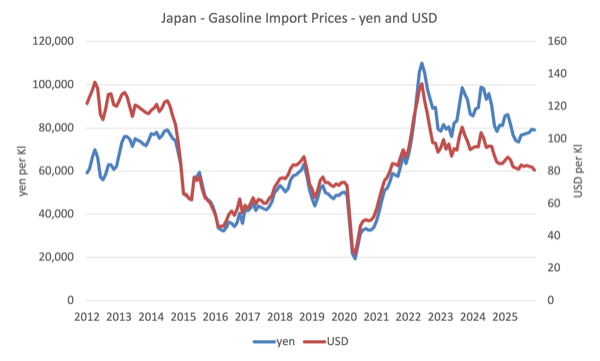
The following graph shows the trajectory of Japanese imported gasoline prices in both yen and USD terms.
The movements are mostly motivated by global factors but we observe in the period following the OPEC hikes from 2020 to 2023, the impact of the yen depreciation (blue yen line deviates from the USD red line).
So the yen equivalent of the USD gasoline price has diverged even though both are trending downwards.
When the Bank of Japan decided to hold interest rates constant in the face of the inflationary pressures at the outset of the inflationary episode in 2021, while the other central banks were vigorously hiking rates, it knew that there would be an impact on the exchange rate.
When the Federal Reserve Bank started hiking interest rates in March 2022, the yen stood at 118.5774 against the US.
Since March 2022, the yen has depreciated around 32.1 per cent against the USD, a significant parity shift.
In the last year, the mainstream ‘experts’ claim that the depreciation proves that Japan’s continuing fiscal deficits and the high public debt ratio are being rejected by the financial markets.
However, other factors have been at work.
After the – 2011 Tōhoku earthquake and tsunami – known as 東日本大震災 (Great East Japan Earthquake) – the currency appreciated because it was expected exposed insurance companies would have to repatriate foreign currency assets.
That didn’t turn out to be the case, but the currency appreciated nonetheless, even though monetary and fiscal policy is largely unchanged from that period to now.
If you examine the graph, you will see several periods of appreciation, especially since the 1990s, even though macroeconomic policy has been consistently expansive over this entire period (bar brief periods).
None of these events had much to do with domestic policy.
For example, we might ask what was going on between November 2011 and August 2015, when the yen depreciated significantly against the US dollar, giving back the shifts that occurred during the GFC?
Did the yen suddenly become an unsafe currency?
And if it did, why did the currency then start appreciating again up to the period when the central bank interest rate differentials began to widen because of the different responses to the inflationary pressures?
Net exports went into deficit in mid-2011, as exports growth faltered, and did not return to surplus again until the September-quarter 2016.
It was trade movements that drove the exchange rate changes.
All through these episodes, there have been continuous Japanese fiscal deficits, a rising public debt ratio, a zero-interest rate monetary policy, and large quantitative easing purchases of government debt.
The depreciation that was associated with the ‘Three Arrows of Abenomics’ which aimed to renew economic growth and break out of the deflationary lock is an interesting case study.
It is well understood that the Abe government from 2012 implicitly wanted the yen to depreciate significantly as part of his plan to reflate the Japanese economy.
Before his election, Japanese manufacturing was struggling against the high yen value, which reinforced the deflationary environment and made it difficult to promote wages growth.
The major shifts in the yen value have mostly reflected global shifts in activity and policies and speculative efforts to profit from them.
The base case is that the yen is a safe-haven currency despite some recent media reports to the contrary.
There is an on-going debate as to the extent that the so-called ‘carry trade’ have driven the movements in the yen recently.
The mainstream explanation is that the interest rate differentials have motivated investors to shift yen, borrowed at low rates, into other currencies in search of better yields.
While there is no doubt this explains some of the movement, a more plausible explanation is that the shift of the trade balance to deficit in recent years promoted weakness in the currency (excess supply of yen to the market).
The yen depreciation that began in early 2012 coincided with the tsunami that shut down the nuclear power plants and increased Japan’s energy imports for power generation, driving the trade balance to deficit.
The yen recovered with the return of trade surpluses, followed by depreciation as COVID cut into exports and trade went into deficit.
Once the trade balance returns to surplus, the yen will strengthen, driven by trade flows.
The latest CPI data
The latest CPI data for Japan is interesting.
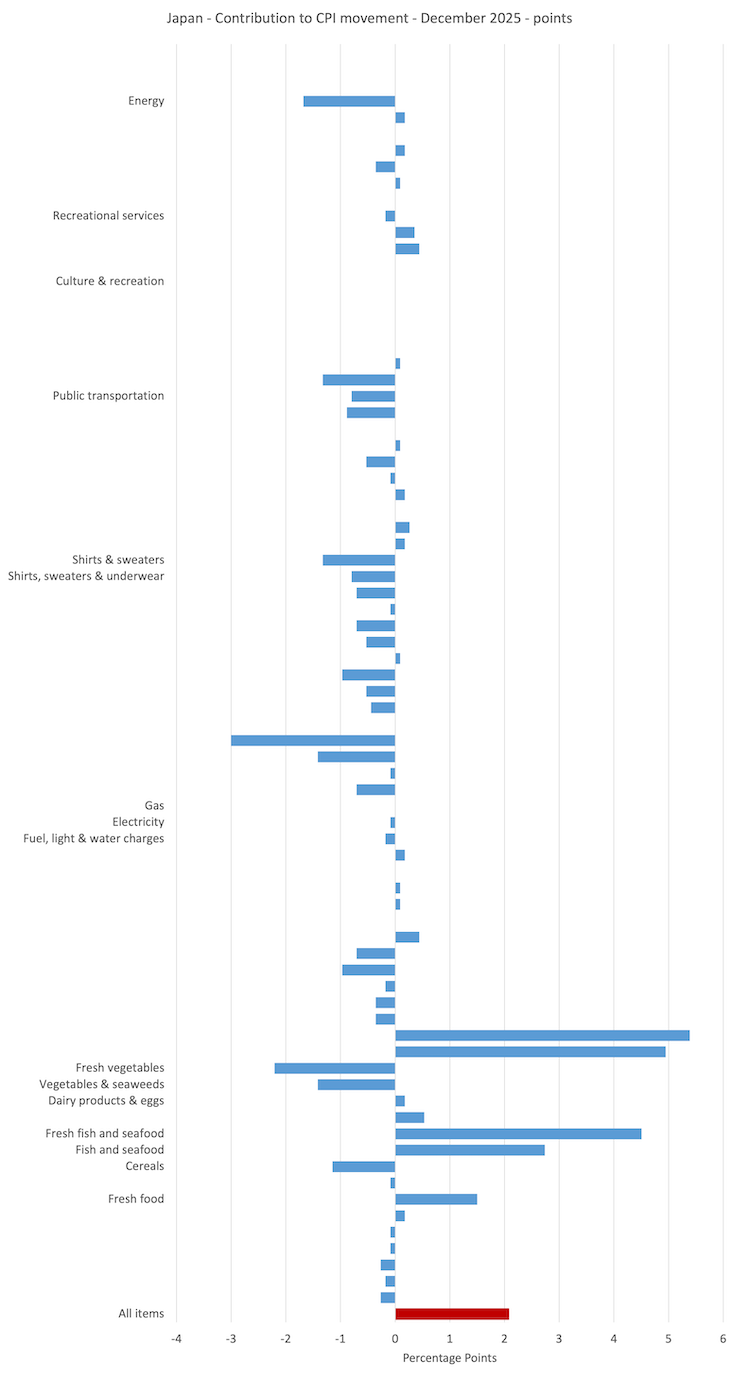
Here is a graph produced from the latest price data issued by the e-Stat service of the Japanese government ().
It shows the contribution to the overall inflation rate of each of the Subgroup indexes for Japan for December 2025 (the most recent data)
The All-items index is in red and I have only labelled the larger contributions (positive or negative).
The current inflation is being driven by food prices in Japan.
The earlier impact of higher energy prices is receding.
What is driving the food price inflation?
There were three interrelated domestic factors:
1. Drought leading to poor harvest – climate change induced heat wave through the 2023 Summer reduced supply.
2. Farm costs rising – mostly fertiliser and labour costs.
3. Increase in demand as a result of the boom in tourism – particularly Chinese tourists.
This is a very interesting driving factor.
The depreciation in the yen has helped fuel a massive tourist boom in Japan over the last several years.
That has boosted ‘exports’ (tourism, even though it is carried out domestically, is considered an export).
Which has put upward pressure on the yen – foreigners demanding yen to do things in a very cash-motivated society.
But it has also driven the demand for imports given that Japan imports a lot of food and energy.
This point generalises to economic development narratives (especially from the IMF) that implore nations to grow their tourist industries to ‘fix’ their trade imbalances.
The problem is that tourism is very import intensive because tourists stay in hotels that require airconditioning (energy use) and eat a lot of imported foods.
In the end, the impact is probably negative notwithstanding the boorish behaviour that comes with it that pushes the benefits to local communities in Japan over the cliff.
4. There has also been large-scale panic buying at supermarkets on the back of a prediction in 2024 that the Nankai Trough was about to deliver the long-awaited earthquake.
But global factors were also at play, including the export restrictions imposed by the Indian government in 2023.
And the climatic factors that impacted Japan, have been global and have included flooding, excessive heat and lack of rain, which have reduced rice yields.
The important point is that these are all factors, which are largely insensitive to interest rate changes.
In addition to these factors, it is now apparent that the transport sector is facing labour shortages, which are increasing delivery costs for firms.
Again, that will not be solved with interest rate increases.
Conclusion
And we also need to get some perspective on all this.
The overall inflation rate is only 2.1 per cent anyway and falling, after a massive depreciation and dependency on key imports such as food and energy.
Energy prices have fallen by 3.1 per cent over the last year and that has nothing to do with monetary policy.
Even the food price inflation is declining as the nation adjusts to the host of factors discussed above that have driven the rise in food prices.
I will answer the other questions posed in the Introduction in more detail another day.
That is enough for today!
(c) Copyright 2026 William Mitchell. All Rights Reserved.
Well I will be adding to the problem in May, as I am due to visit Japan for the first time.
Thank you for coming to the London event, always enjoyable hearing your views.
I meant to introduce you to the music of Mei Semones, a Japanese American who does jazzy pop songs you might appreciate:
https://www.youtube.com/watch?v=l_f_fE8m2VU