The recent extreme weather in the northern hemisphere, the twin monster tropical storms in Japan,…
Australian labour market – largely stable but dark clouds present
The Australian Bureau of Statistics (ABS) released the latest labour force data today (APRIL 16, 2026) – Labour Force, Australia – for March 2026 – which showed that the labour market steadied after last month’s contraction. While employment growth remained positive and was dominated by full-time work gains (as part-time employment fell), the fact that the participation rate fell helped keep the unemployment rate stable. There are now 10.1 per cent of available labour not being used (either unemployed or underemployment), which makes a farce of the RBA’s claims that the labour market is tight. There is substantial scope for more job creation given the slack that is present. However, if the global situation doesn’t improve quickly then that slack will increase sharply.
The summary seasonally-adjusted statistics for March 2026 are:
- Employment rose 17,900 (0.1 per cent).
- Full-time employment rose 52,500 (0.5 per cent).
- Part-time employment fell 34,600 (-0.7 per cent).
- Unemployment fell 3,700 to 656,300.
- The unemployment rate was stable on 4.3 per cent.
- The participation rate fell 0.1 points to 66.8 per cent.
- The Employment-population ratio was steady on 64 per cent (0.04 fall at second decimal place).
- Monthly hours worked rose 9.2 million (0.46 per cent).
- Underemployment was steady on 5.9 per cent (rising 11 thousand to 915 thousand).
- The Broad Labour Underutilisation rate (the sum of unemployment and underemployment) rose 0.04 points to 10.2 per cent.
- Overall, there are 1,571.3 thousand people either unemployed or underemployed.
The ABS press release – Unemployment rate remains at 4.3% in March – noted that:
The seasonally adjusted unemployment rate remained at 4.3 per cent in March …
… whilst the participation rate fell by 0.1 percentage points to 66.8 per cent….
Growth in employment was driven by full-time workers, which rose by 53,000 people in March. This was partly offset by a fall in part-time employment of 35,000 people …
This month people worked 9.2 million more hours, with full-time hours increasing by 7.1 million and part-time hours increasing by 2.1 million hours …
Summary
1. Fairly steady with the growth in full-time work being a bright point while the drop in participation was an offset.
2. Total labour underutilisation (sum of unemployment and underemployment) rose to 10.2 per cent, which indicates the extent of the wastage.
Employment growth maintains pace with shrinking supply as participation falls
- Employment rose 17,900 (0.1 per cent).
- Full-time employment rose 52,500 (0.5 per cent).
- Part-time employment fell 34,600 (-0.7 per cent).
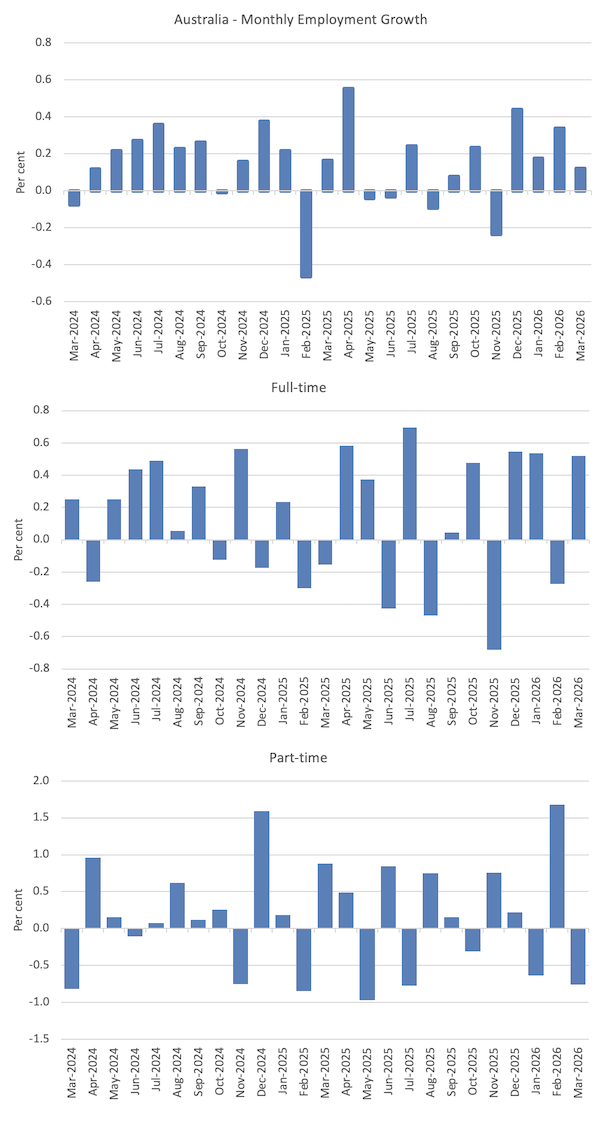
The following graph shows the growth in total, full-time, and part-time employment for the last 24 months.
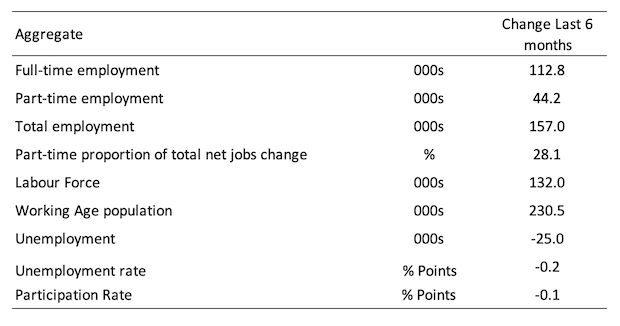
The following table shows the shifts over the last 6 months which helps to see the underlying trend.
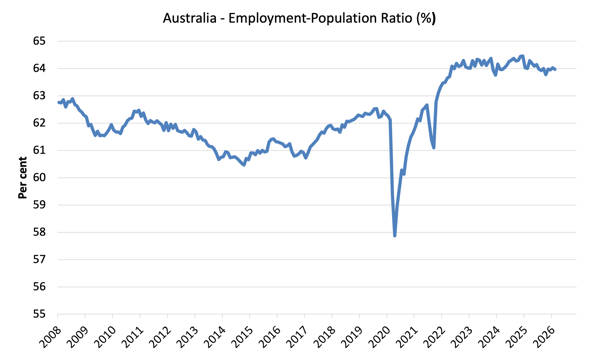
The Employment-to-Population ratio provides a measure of the state of the labour market that is independent of the supply shifts in the labour market (driven by the shifts in the participation rate).
The underlying working age population grows steadily while the labour force shifts with both underlying population growth and the participation swings.
The following graph shows the Employment-Population ratio was stable on 64 per cent.
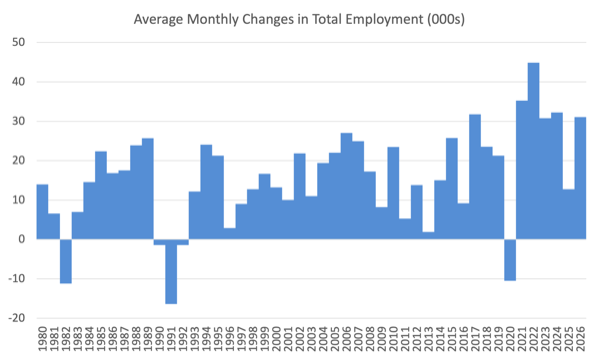
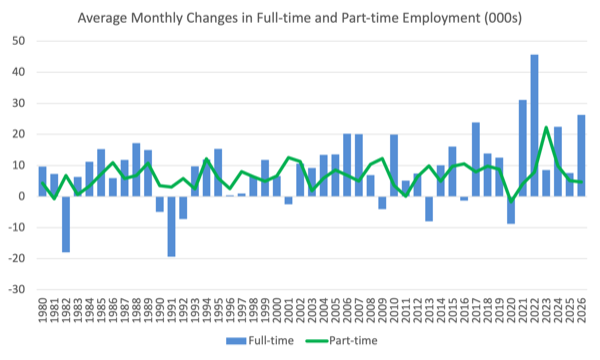
The next graphs show the average monthly change in total employment (first graph) and full- and part-time employment (second graph).
For total employment the monthly average changes were:
- 2022 – 44.8 thousand
- 2023 – 30.8 thousand
- 2024 – 32.2 thousand
- 2025 – 12.7 thousand
- 2026 to date – 31 thousand
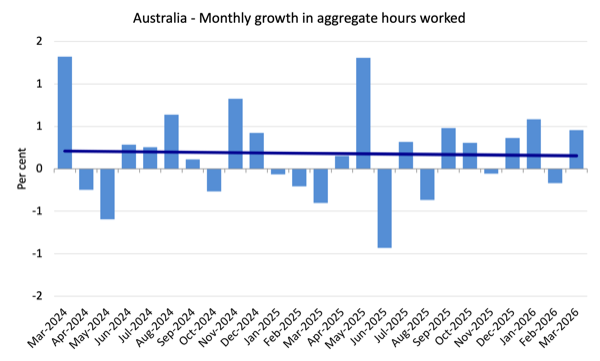
Monthly hours worked rose 9.2 million (0.46 per cent) in March 2026
Stronger on the back of growth in full-time employment.
The following graph shows the growth in monthly hours worked for the last 24 months, with the straight line being a simple linear regression to indicate trend.
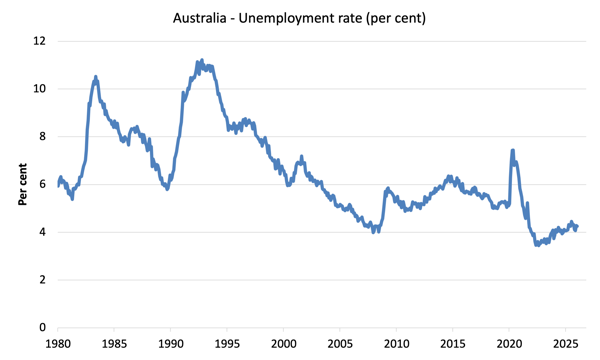
Unemployment fell 3,700 to 656,300 in March 2026
The unemployment rate was stable on 4.3 per cent.
Essentially, labour demand just kept pace with the supply side which shrank a little as participation fell by 0.1 point.
The following graph shows the evolution of the official unemployment rate since 1980.
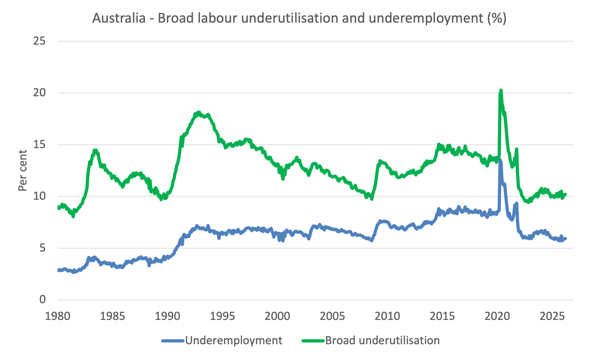
Broad labour underutilisation – rose 0.1 points in March 2026
Given the drop in full-time employment and hours worked and the substantial increase in part-time work, it is hard to understand how underemployment actually fell marginally.
I suspect that result will be revised next month.
- Underemployment was steady on 5.9 per cent (rising 11 thousand to 915 thousand).
- The Broad Labour Underutilisation rate (the sum of unemployment and underemployment) rose 0.04 points to 10.2 per cent.
- Overall, there are 1,571.3 thousand people either unemployed or underemployed.
The following graph shows the evolution of underemployment and the Broad labour underutilisation rate since 1980.
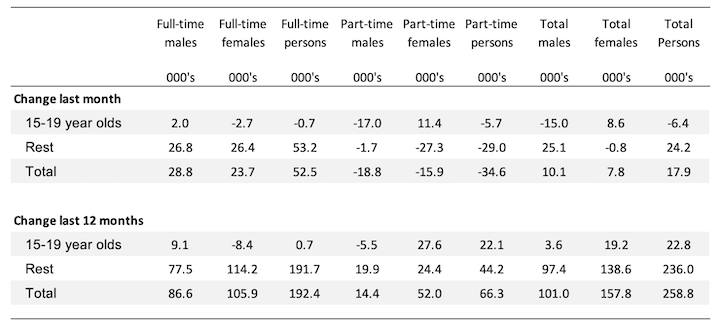
Teenage labour market – shrinking employment opportunities
This month, teenagers full-time work fell despite the overall labour market showing stronger full-time employment growth.
Part-time employment also contracted.
- Full-time employment fell 0.7 thousand (-0.4 per cent).
- Part-time employment fell 5.7 thousand (-0.8 per cent).
- Total teenage (15-19) employment fell 6.4 thousand (-0.7 per cent).
The following table summarises the shifts in the teenage labour market for the month and over the last 12 months.
To put these changes into a scale perspective (that is, relative to size of the teenage labour force) the following data reports the shifts in the Employment-Population ratio for teenagers.
The Teenage Employment-Population ratios and their monthly changes in March 2026 were:
- Males: 47.4 per cent – down 1.8 points.
- Females: 54.0 per cent – up 0.8 points.
- Total: 50.6 per cent – down 0.5 points.
Conclusion
My standard warning to take care in interpreting monthly labour force changes – they can fluctuate for a number of reasons and it is imprudent to jump to conclusions on the back of a single month’s data.
- The labour market was largely stable this month.
- While employment growth remained positive and was dominated by full-time work gains (as part-time employment fell), the fact that the participation rate fell helped keep the unemployment rate stable.
- There are now 10.1 per cent of available labour not being used (either unemployed or underemployment), which makes a farce of the RBA’s claims that the labour market is tight.
- There is substantial scope for more job creation given the slack that is present. However, if the global situation doesn’t improve quickly then that slack will increase sharply.
That is enough for today!
(c) Copyright 2026 William Mitchell. All Rights Reserved.
Dear Bill,
Every time I look at that employment:population graph I am amazed. With COVID, the economy was decimated and unemployment went (briefly) through the roof. Yet somehow that experience shifted the employment-population ratio to a stable and historically high level.
In a sane world, young economists would be making their careers out of explaining what caused the shift – two shifts really, in level and in variability. In reality, the observation seems to be pretty much ignored.
Interesting, but I wonder how applicable or relevant these statistics will be in a month’s time. Given the nature of the supply shocks emanating from the idiocy in the Middle East – with diesel reserves in Australia of 25 days and petrol/kerosene not far behind – and no sign of any resolution in the conflict, many wise voices now caution of total economic collapse in the coming months. Not just down under. I suspect we’re fast approaching a very different time of economic principles and practice.
I miss your musical addenda, Bill. I do hope you still manage to find time to play and enjoy.
All the best