The Australian Bureau of Statistics (ABS) released the latest labour force data today (June 25,…
Australian labour market – employment continues to grow but it is all in part-time jobs – unemployment up a tick
Today (January 16, 2025), the Australian Bureau of Statistics released the latest – Labour Force, Australia – for December 2024. Employment growth was relatively strong but concentrated on part-time employment, which suggests the quality of employment fell. Employment growth was also unable to keep pace with the underlying population growth and the rising participation rate and as a result the unemployment rate rose by a point. We should not disregard the fact that there is still close to 10 per cent of the working age population (over 1.5 million people) who are available and willing but cannot find enough work – either unemployed or underemployed and that proportion is increasing. Australia is not near full employment despite the claims by the mainstream commentators and it is hard to characterise this as a ‘tight’ labour market.
The summary ABS Labour Force (seasonally adjusted) estimates for December 2024 are:
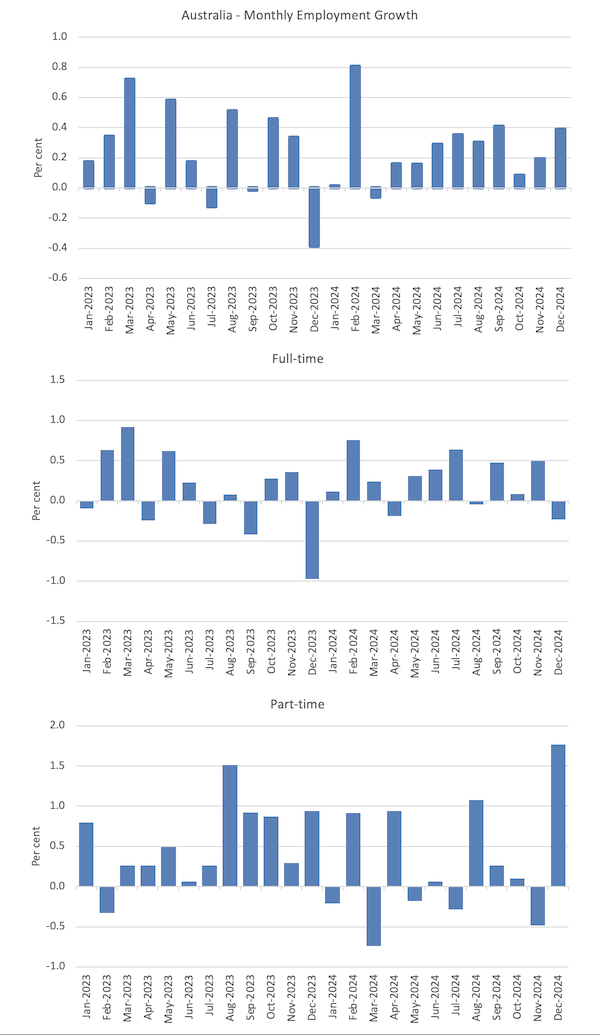
- Employment rose 56,300 (0.4 per cent) – full-time employment fell by 23.7 thousand (-0.2 per cent) and part-time employment rose by 80 thousand (1.8 per cent). Part-time share of total was 30.6 per cent.
- Unemployment rose 10,300 to 604,100 persons.
- The official unemployment rate rose 0.1 point to 4 per cent.
- The participation rate rose 0.2 points to 67.1 per cent.
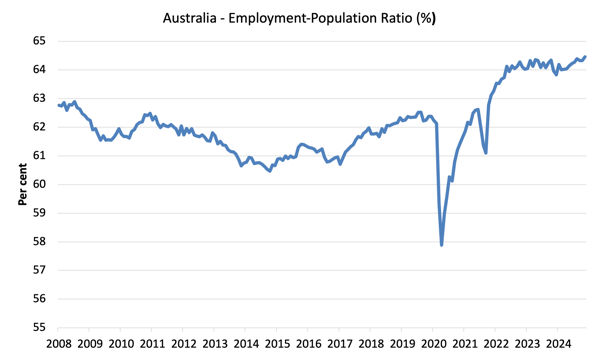
- The employment-population ratio rose 0.1 point to 64.5 per cent (rounded).
- Aggregate monthly hours rose by 10.4 million hours (0.53 per cent).
- Underemployment rate fell 0.1 point to 6 per cent – underemployment fell by 9.5 thousand. Overall there are 907.8 thousand underemployed workers. The total labour underutilisation rate (unemployment plus underemployment) was stable at 9.95 per cent. There were a total of 1511.9 thousand workers either unemployed or underemployed.
The ABS Media Release (January 16, 2025) – Unemployment rate rises to 4.0% in December – noted that:
The seasonally adjusted unemployment rate rose by 0.1 percentage point to 4.0 per cent in December …
With employment rising by 56,000 people and the number of unemployed increasing by 10,000 people, the unemployment rate rose to 4.0 per cent …
The employment-to-population ratio rose 0.1 percentage point to a new record of 64.5 per cent. This was 0.5 percentage points higher than a year ago and 2.3 percentage points higher than before the COVID-19 pandemic …
The rise in both the number of people employed and unemployed also saw a further rise in the participation rate, that is the percentage of the population who are employed or unemployed …
The underemployment rate fell 0.1 percentage point to 6.0 per cent in December 202 …
General conclusion:
1. Employment growth was much stronger this month but the growth was confined to part-time work, while full-time employment fell significantly.
2. However, employment growth still couldn’t keep pace with the underlying population growth and the rising participation rate.
2. The dual incidence of rising employment and participation is usually a good sign but I qualify that by the fact that all the growth was in part-time jobs (probably servicing the Xmas rush in the service sector).
Employment rose 56,300 (0.4 per cent) in December 2024
1. Full-time employment fell by 23.7 thousand (-0.2 per cent) and part-time employment rose by 80 thousand (1.8 per cent).
2. The employment-population ratio rose 0.1 point to 64.5 per cent (rounded). Remember this ratio does not discriminate between full- and part-time work.
The following graph show the month by month growth in total, full-time, and part-time employment for the 24 months to December 2024 using seasonally adjusted data.
The following table provides an accounting summary of the labour market performance over the last six months to provide a longer perspective that cuts through the monthly variability and provides a better assessment of the trends.

Given the variation in the labour force estimates, it is sometimes useful to examine the Employment-to-Population ratio (%) because the underlying population estimates (denominator) are less cyclical and subject to variation than the labour force estimates. This is an alternative measure of the robustness of activity to the unemployment rate, which is sensitive to those labour force swings.
The following graph shows the Employment-to-Population ratio, since April 2008 (that is, since the GFC).
The employment-to-population ratio is still demonstrating stability with minor fluctuations around the current level.
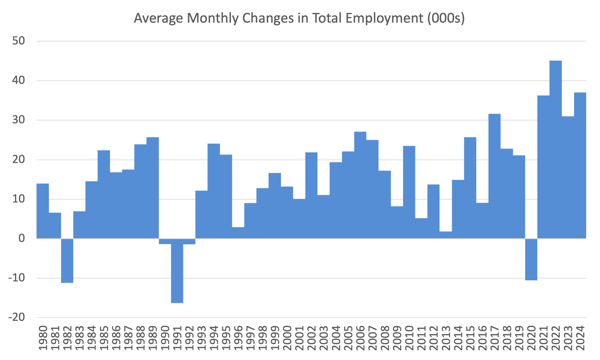
For perspective, the following graph shows the average monthly employment change for the calendar years from 1980 to 2024.
1. The average employment change over 2020 was -10.5 thousand which rose to 36.3 thousand in 2021 as the lockdowns eased.
2. For 2022, the average monthly change was 45.1 thousand, and for 2023, the average change was 31 thousand.
3. For 2024, the average monthly change was 37 thousand.
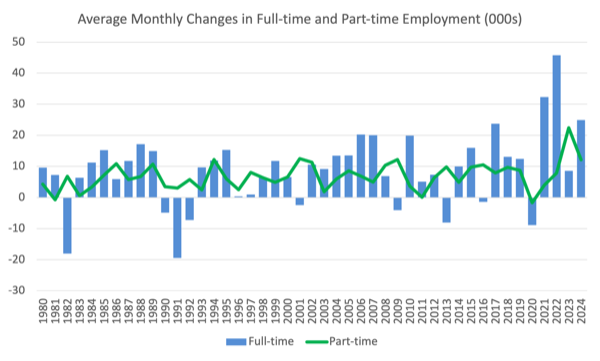
The following graph shows the average monthly changes in Full-time and Part-time employment in thousands since 1980.
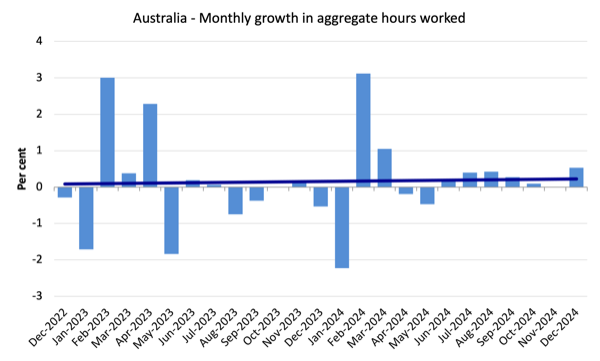
Aggregate monthly hours rose 10.3 million or 0.53 per cent
The following graph shows the monthly growth (in per cent) over the last 48 months (with the pandemic restriction period omitted).
The dark linear line is a simple regression trend of the monthly change.
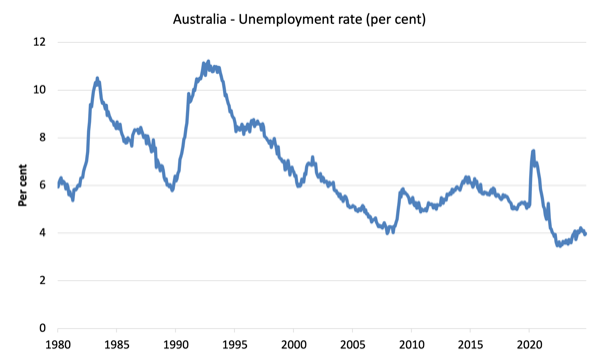
Unemployment rose 10,300 to 604,100 persons in December 2024
The relatively strong employment growth could not keep up with the underlying population growth and the rising participation rate and as a result unemployment rose.
The following graph shows the national unemployment rate from April 1980 to December 2024. The longer time-series helps frame some perspective to what is happening at present.
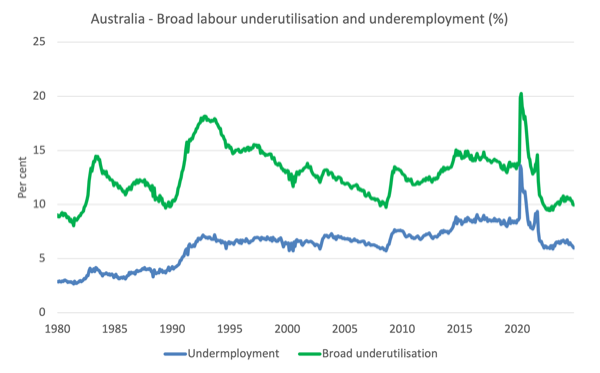
Broad labour underutilisation was stable at 9.95 per cent in December 2024
1. Underemployment rate fell 0.1 point to 6 per cent – underemployment fell by 9.5 thousand.
2. Overall there are 907.8 thousand underemployed workers.
3. The total labour underutilisation rate (unemployment plus underemployment) was stable at 9.95 per cent.
4. There were a total of 1511.9 thousand workers either unemployed or underemployed.
Assessment:
Basically, the small increase in unemployment was offset by the small decline in underemployment.
The following graph plots the seasonally-adjusted underemployment rate in Australia from April 1980 to the December 2024 (blue line) and the broad underutilisation rate over the same period (green line).
The difference between the two lines is the unemployment rate.
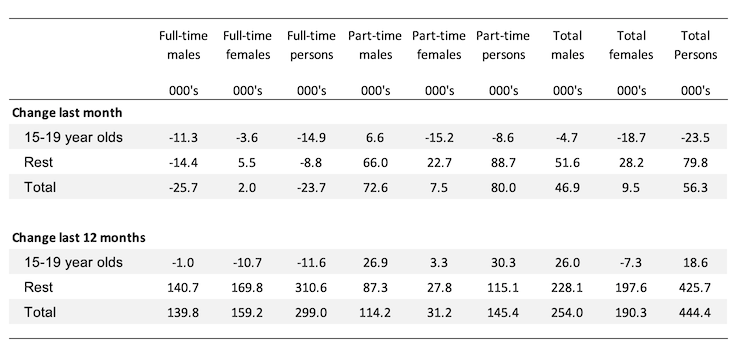
Teenage labour market deteriorates further in December 2024
Overall teenage employment fell by 23.5 thousand with full-time employment falling by 14.0 thousand.
The following Table shows the distribution of net employment creation in the last month and the last 12 months by full-time/part-time status and age/gender category (15-19 year olds and the rest).
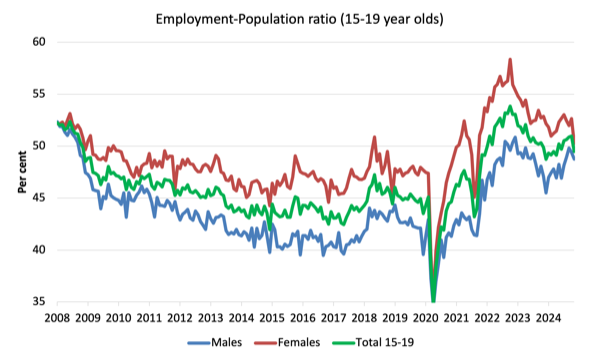
To put the teenage employment situation in a scale context (relative to their size in the population) the following graph shows the Employment-Population ratios for males, females and total 15-19 year olds since July 2008.
You can interpret this graph as depicting the change in employment relative to the underlying population of each cohort.
In terms of the recent dynamics:
1. The male ratio fell 0.6 points over the month.
2. The female ratio fell 2.4 points over the month.
3. The overall teenage employment-population ratio fell 1.5 points over the month.
Conclusion
My standard monthly warning: we always have to be careful interpreting month to month movements given the way the Labour Force Survey is constructed and implemented.
My overall assessment is:
1. Employment growth was relatively strong but concentrated on part-time employment, which suggests the quality of employment fell.
2. Employment growth was unable to keep pace witht he underlying population growth and the rising participation rate and as a result the unemployment rate rose by a point.
3. We should not disregard the fact that there is still close to 10 per cent of the working age population (over 1.5 million people) who are available and willing but cannot find enough work – either unemployed or underemployed and that proportion is increasing.
5. Australia is not near full employment despite the claims by the mainstream commentators and it is hard to characterise this as a ‘tight’ labour market.
That is enough for today!
(c) Copyright 2025 William Mitchell. All Rights Reserved.
It’s looking like the ongoing diminution of full-time jobs in exchange for a better than just a livable income into part-time and so called gig-economy jobs that deliver very part-time livelihoods and destroy lives. The race to the bottom continues within our increasingly financialised, neoliberal, rentier economy.
Now, considering Bill’s previous blogpost on “Fake News”, please be aware that Guardian Australia is looking for an economics correspondent. Applications closing next Monday https://workforus.theguardian.com/jobs/582/ (no conflicts here). An opportunity for an MMTer to become the Guardian’s next “Larry Elliot”, only better.
A question I often ask myself, without answer, is what will happen when all these millions of young people now working gig jobs grow old and can no longer move from one set of part-time jobs to another set, when they reach that point of failing health without having built a lifelong relationship with a partner with whom to share the difficult declining years, without having had children who have now come of age and can help care for them? What will happen to these millions upon millions of, let’s say, average or ordinary young people (although no person is average or or ordinary) who will never win the neoliberal lottery of self-promotion by starting a new tech company or becoming a big-time YouTube influencer? Will some sort of UBI be put into place to keep them from dying on the street, since they were never able to buy a home? Will they just collapse one by one and be carted away along with the tents and boxes they slept in after “retirement”? Or will we finally see the social equivalent of a nuclear blast that blows utterly to hell the obscene system that made them and used them, only to discard them? Or, perhaps worst of all, will they just dwindle away contentedly, without a peep, while blankly staring at the one possession that had become more important to them than a steady job or a home or a spouse or children? Yeah, you got it–that smart, but oh so dumb, oh so deadly, phone.
@Newton Finn In the UK, those beyond state pension age who have little or no non-means tested income i.e. for whatever reason have not built up any private pension scheme entitlement/annuity, may not have qualified for the full state pension and also have minimal savings, can apply for a means-tested government payment (Pension credit) and, to go towards their housing costs (pay their landlord), Housing Benefit/Universal Credit. This isn’t UBI: it’s not universal and it is means tested. But you’re right that an awful lot more people will be getting to retirement age having been totally failed during their working lives and failed again by a state relying increasingly on the inequitable and inefficient private pensions industry instead of providing a decent state pension for all. We are of course already seeing a rising tide of working age poor. Many of these probably won’t trouble the state for retirement welfare for very long, given that poorer people in decrepit housing don’t live as long as the wealthy, and are of course helped on their way by the food and drinks industry which preys on them.