In the 1990s, a new industry was created in Australia. It produced nothing. But it…
Australian labour market – signs of weakening with underemployment rising
Today (September 19, 2024), the Australian Bureau of Statistics released the latest – Labour Force, Australia – for August 2024, which shows that the labour outlook might be about to change despite the on-going employment growth. Employment growth was biased towards part-time jobs as full-time employment fell. The unemployment rate was slightly lower (decimals) as employment growth outstripped the underlying population growth – although the rise in underemployment might be due to employers rationing working hours as a first step in dealing with lower sales. We will know more next month. But we should not disregard the fact that there is now 10.6 per cent of the working age population (over 1.6 million people) who are available and willing but cannot find enough work – either unemployed or underemployed and that proportion is increasing. Australia is not near full employment despite the claims by the mainstream commentators and it is hard to characterise this as a ‘tight’ labour market.
The summary ABS Labour Force (seasonally adjusted) estimates for August 2024 are:
- Employment rose 47,500 (0.3 per cent) – full-time employment declined by 3.1 thousand and part-time employment rose by 50.6 thousand. Part-time share of total was 30.6 per cent.
- Unemployment fell 10.5 thousand to 627,000 persons.
- The official unemployment rate was slightly lower (-0.1 point) but rounded at 4.2 per cent.
- The participation rate was unchanged at 67.1 per cent.
- The employment-population ratio rose 0.1 point to 64.3 per cent.
- Aggregate monthly hours rose 8 million (0.4 per cent).
- Underemployment rate rose 0.2 points to 6.5 per cent – underemployment rose by 22.7 thousand. Overall there are 975.6 thousand underemployed workers. The total labour underutilisation rate (unemployment plus underemployment) was steady at 10.6 per cent. There were a total of 1602.6 thousand workers either unemployed or underemployed.
In the ABS Media Release – Unemployment rate steady at 4.2% – the ABS noted that:
The unemployment rate was steady at 4.2 per cent in August …
The number of unemployed people fell by around 10,000, while the number of employed people grew by around 47,000, in August. This resulted in the unemployment rate remaining steady at 4.2 per cent and the participation rate remaining at its record high of 67.1 per cent …
The growth in employment increased the employment-to-population ratio by 0.1 percentage point to 64.3 per cent, which is just below the November 2023 historical high of 64.4 per cent …
The proportion of people working reduced hours because they were sick continues to be above pre-pandemic levels. However, the proportion of people working less hours than usual due to economic reasons, such as no work or less work available, is below pre-pandemic levels, which points to continued relative tightness in the labour market …
The underemployment rate rose by 0.1 percentage point to 6.5 per cent …
The underutilisation rate, which combines the unemployment and underemployment rates, was steady at 10.6 per cent. This remains well below the 13.9 per cent recorded in March 2020 before the COVID-19 pandemic.
General conclusion:
1. While the unemployment rate was slightly lower, the two signs of weakening were the decline in full-time employment and the rise in underemployment. Firms adjust hours first before they start indulging in layoffs.
2. When there is slow demand (spending), firms also start converting full-time jobs into part-time work, which means that the rise in unemployment lags the cycle as underemployment leads.
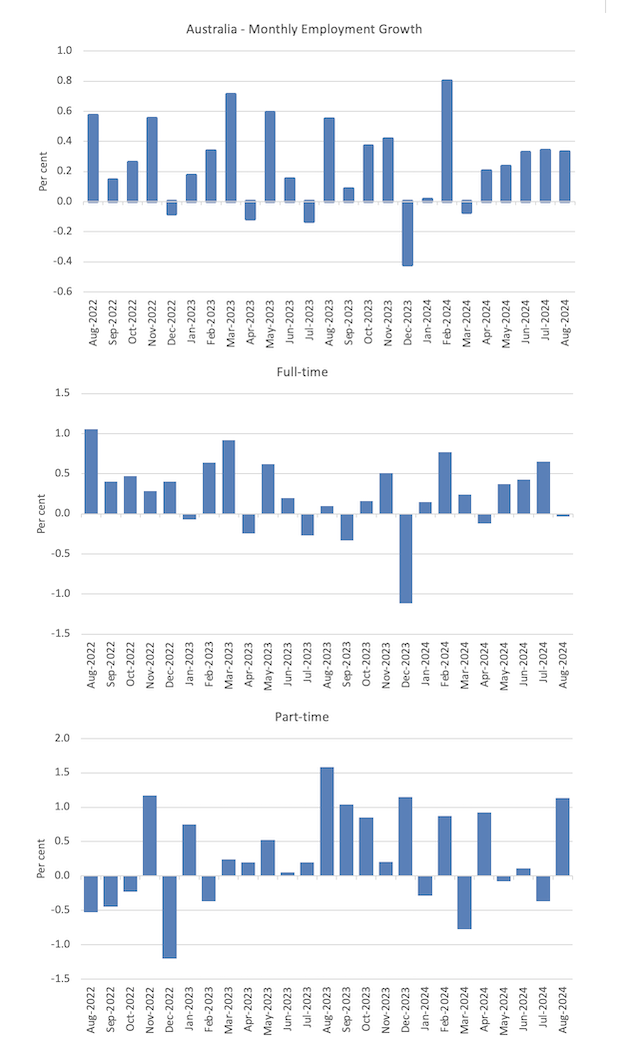
Employment rose 47,500 (0.3 per cent) in August 2024
1. Full-time employment declined by 3.1 thousand and part-time employment rose by 50.6 thousand.
2. The employment-population ratio rose 0.1 point to 64.3 per cent.
The following graph show the month by month growth in total, full-time, and part-time employment for the 24 months to August 2024 using seasonally adjusted data.
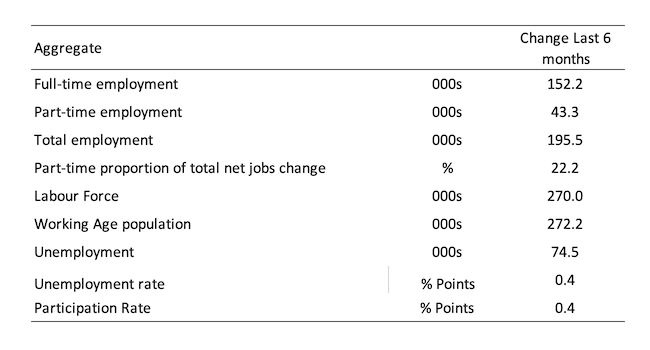
The following table provides an accounting summary of the labour market performance over the last six months to provide a longer perspective that cuts through the monthly variability and provides a better assessment of the trends.
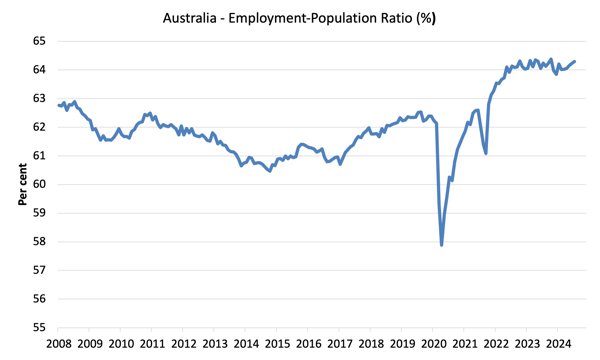
Given the variation in the labour force estimates, it is sometimes useful to examine the Employment-to-Population ratio (%) because the underlying population estimates (denominator) are less cyclical and subject to variation than the labour force estimates. This is an alternative measure of the robustness of activity to the unemployment rate, which is sensitive to those labour force swings.
The following graph shows the Employment-to-Population ratio, since April 2008 (that is, since the GFC).
The employment-to-population ratio is still demonstrating stability with minor fluctuations around the current level.
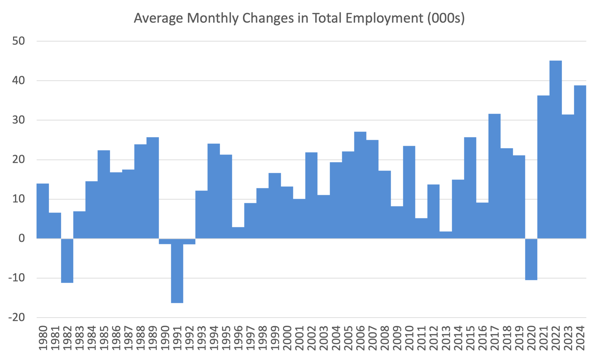
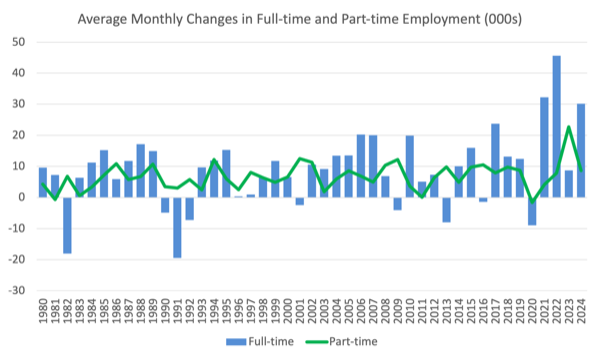
For perspective, the following graph shows the average monthly employment change for the calendar years from 1980 to 2024.
1. The average employment change over 2020 was -10.5 thousand which rose to 36.3 thousand in 2021 as the lockdowns eased.
2. For 2022, the average monthly change was 44.9 thousand, and for 2023, the average change was 31.9 thousand.
3. So far in 2024, the average monthly change is 38.9 thousand.
The following graph shows the average monthly changes in Full-time and Part-time employment in thousands since 1980.
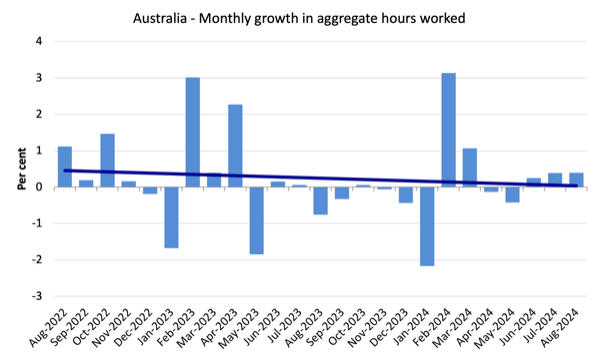
Aggregate monthly hours rose by 7.8 million hours (0.4 per cent)
The following graph shows the monthly growth (in per cent) over the last 48 months (with the pandemic restriction period omitted).
The dark linear line is a simple regression trend of the monthly change.
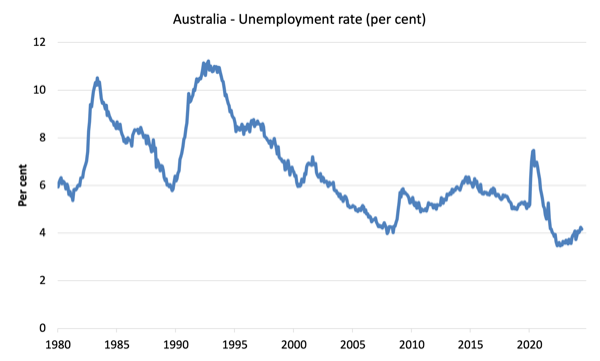
Unemployment fell 10.5 thousand to 627,000 persons in August 2024
The very modest decline unemployment and the unemployment rate was due to the steady participation rate and employment growth outpacing the underlying population growth.
But remember – all of the employment growth was in part-time work and underemployment increased.
The following graph shows the national unemployment rate from April 1980 to August 2024. The longer time-series helps frame some perspective to what is happening at present.
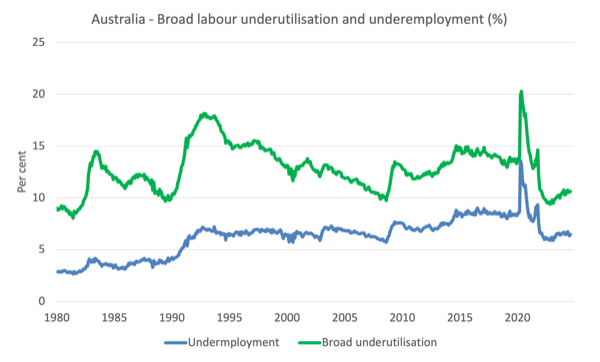
Broad labour underutilisation was steady at 10.6 per cent although underemployment rose 0.2 points in August 2024
1. Underemployment rate rose 0.2 points to 6.5 per cent – underemployment rose by 22.7 thousand.
2. Overall there are 975.6 thousand underemployed workers.
3. The total labour underutilisation rate (unemployment plus underemployment) was steady at 10.6 per cent.
4. There were a total of 1602.6 thousand workers either unemployed or underemployed.
Assessment:
1. Firms often adjust hours of work in the face of a slowdown because laying off workers can be more expensive and they are not sure that the downturn is temporary. Whether that is happening here remains to be seen and will become clearer next month.
2. The fact that there is 10.6 per cent of workers who are both available and willing to work that are without work in one way or another (unemployed or underemployed) makes a mockery of claims by economic commentators and policy officials that Australia is near full employment or that this is an extremely tight labour market.
The following graph plots the seasonally-adjusted underemployment rate in Australia from April 1980 to the August 2024 (blue line) and the broad underutilisation rate over the same period (green line).
The difference between the two lines is the unemployment rate.
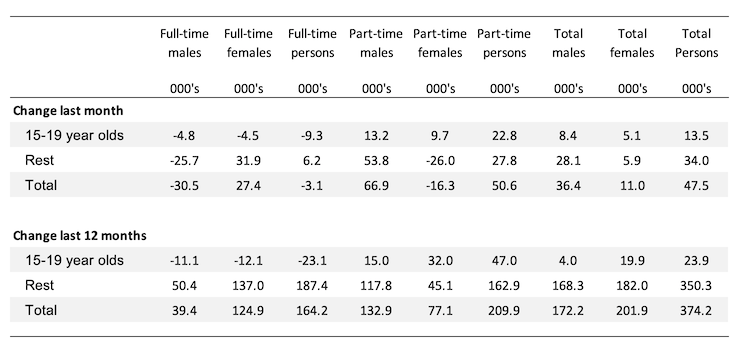
Teenage labour market loses full-time employment in August 2024
Overall teenage employment rose by 13.5 thousand but full-time employment fell by 9.3 thousand while part-time employment rose by 22.8 thousand.
The following Table shows the distribution of net employment creation in the last month and the last 12 months by full-time/part-time status and age/gender category (15-19 year olds and the rest).
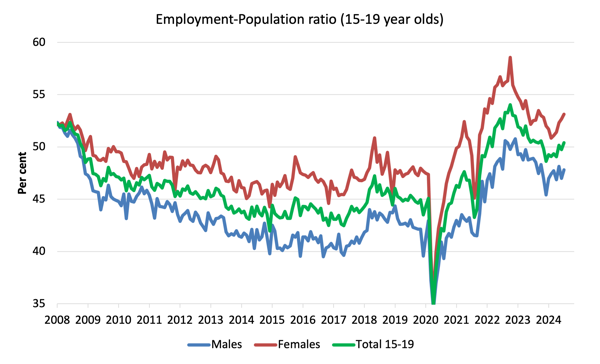
To put the teenage employment situation in a scale context (relative to their size in the population) the following graph shows the Employment-Population ratios for males, females and total 15-19 year olds since July 2008.
You can interpret this graph as depicting the change in employment relative to the underlying population of each cohort.
In terms of the recent dynamics:
1. The male ratio rose 0.8 points over the month.
2. The female ratio rose 0.5 points over the month.
3. The overall teenage employment-population ratio fell 0.6 points over the month.
My standard monthly warning: we always have to be careful interpreting month to month movements given the way the Labour Force Survey is constructed and implemented.
My overall assessment is:
1. The labour outlook might be about to change despite the on-going employment growth.
2. Employment growth was biased towards part-time jobs and underemployment rose.
3. The unemployment rate was slightly lower (decimals) as employment growth outstripped the underlying population growth – although the rise in underemployment might be due to employers rationing working hours as a first step in dealing with lower sales.
4. But we should not disregard the fact that there is now 10.6 per cent of the working age population (over 1.6 million people) who are available and willing but cannot find enough work – either unemployed or underemployed and that proportion is increasing.
5. Australia is not near full employment despite the claims by the mainstream commentators and it is hard to characterise this as a ‘tight’ labour market.
That is enough for today!
(c) Copyright 2024 William Mitchell. All Rights Reserved.
MMT has; sadly, never transitioned from Academia down to street level, bog standard, cash accounting and auditing, that IS the “real” economy. What MMT needs is a raft of Modern Money Mechanics, not Academics.
The metamorphosis that is the creation and redemption of the Euro currency, would even be beyong the interlect of Marvin in the Hitchhiker’s Guide to the Universe.
Each week the ECB offers for auction the quantity of Euro it wants to inject into the stock of Euro in the Eurosystem. It sets the minimum interest rate offer it will accept from bidders. At times, it sets the interest rate it wants and Euro National Central Banks (NCB) of member states, can buy as many Euro as they want, at that interest rate. This is the principle way the ECB controls the Eurosystem wide interest rate, not the Member State borrowing interest rates..
EU Member States have to issue Bonds to finance their spending; unlike the UK which doesn’t; but, pretends it does. Their Treasuries have to offer interest rates to get those Euro from the NCBs and their intermediaries. At times of stress they get few takers and the ECB has to step in and replace those unsold Bonds with real, hot of the press, Euro cash; to prevent the Euro currency collapsing.
Consider. If the Treasury creates £100 bn and spends it building a Railway, that money will end up in bank accounts of businesses and individuals who built it. Left in the system, it is a potential inflation bomb ready to explode. It has to be extracted after that £100 bn has done its job. Taxation and charges for Train tickets would eventually remove it in this Railway case. Alas, some of it will get saved which is not what the Treasury wants. There is always the risk that savings can explode into consumer spending and produce inflation.
The BoE is currently doing its best to reduce that risk of the Cash and Reserves in the UK non-government sector with QT. It has reduced the Monetary Base from £975 bn down to £758 bn so far. It will be targeting £400 bn or less me thinks.