On May 19, 2026, Oxfam Australia's media release - Australian billionaires’ wealth grows by $50,000…
Using the appropriate cost-of-living index (not CPI) reveal latest wage increases still trail inflation in Australia
Today (February 21, 2023), the Australian Bureau of Statistics released the latest – Wage Price Index, Australia – for the December-quarter 2023, which shows that the aggregate wage index rose by 4.2 per cent over the 12 months (up 0.2 points). In relation to the December-quarter CPI change (4.1 per cent), this result suggests that real wages grew modestly for the first time in 11 quarters. However, if we use the more appropriate Employee Selected Living Cost Index as our measure of the change in purchasing power then the December-quarter result of 6.9 per cent means that real wages fell by 2.7 per cent. Even the ABS notes the SLCI is a more accurate measure of cost-of-living increases for specific groups of interest in the economy. However, most commentators will focus on the nominal wages growth relative to CPI movements, which in my view provides a misleading estimate of the situation workers are in. Further, while productivity growth is weak, the movement in real wages is still such that real unit labour costs are still declining, which is equivalent to an ongoing attrition of the wages share in national income. So corporations are failing to invest the massive profits they have been earning and are also taking advantage of the current situation to push up profit mark-ups. A system that then forces tens of thousands of workers out of employment to deal with that problem is void of any decency or rationale. That is modern day Australia.
Latest Australian data
The Wage Price Index:
… measures changes in the price of labour, unaffected by compositional shifts in the labour force, hours worked or employee characteristics
Thus, it is a cleaner measure of wage movements than say average weekly earnings which can be influenced by compositional shifts.
The summary results (seasonally adjusted) for the December-quarter 2023 were:
| Measure | Quarterly (per cent) | Annual (per cent) |
| Private hourly wages | 0.9 (-0.5 points) | 4.2 (+0.1 point) |
| Public hourly wages | 1.3 (+0.4 points) | 4.2 (+0.7 points) |
| Total hourly wages | 0.9 (-0.4 points) | 4.2 (+0.2 points) |
| Employee Selected Cost-of-Living measure | 1.1 (-0.9 points) | 6.9 (-2.1 points) |
| Basic CPI measure | 0.6 (-0.6 points) | 4.1 (-1.2 points) |
| Weighted median inflation | 0.9 (+0.1 point) | 4.4 (-0.8 points) |
| Trimmed mean inflation | 0.8 (-0.5 points) | 4.2 (-1.0 points) |
On price inflation measures, please read my blog post – Inflation benign in Australia with plenty of scope for fiscal expansion (April 22, 2015) – for more discussion on the various measures of inflation that the RBA uses – CPI, weighted median and the trimmed mean. The latter two aim to strip volatility out of the raw CPI series and give a better measure of underlying inflation.
The ABS press release – Quarterly wages growth highest in WPI history – said:
The Wage Price Index (WPI) rose 0.9 per cent in December quarter 2023, and 4.2 per cent for the year …
Private sector wage growth in December quarter 2023 is comparable to December 2022 (also 0.9 per cent), while the public sector had the highest quarterly rise in 15 years (1.3 per cent) …
For both the public and private sector, wages growth was driven by organisation-wide annual wage and salary reviews. Wage growth for December quarter 2023 saw a higher contribution from jobs covered by enterprise agreements than is typically recorded for a December quarter …
Higher growth in the public sector was primarily due to newly implemented enterprise agreements for essential workers in the Health care and social assistance and Education and training industries following changes to state-based wages policies.
So, the quarter’s results were heavily influenced by the cyclical pattern of enterprise bargaining in Australia where a higher proportion of workers were up for wage increases than in previous quarters.
The other significant point arising from today’s data release is that the successive cuts in real wages over the last several quarters has now ended as inflation falls below the growth rate of nominal wages.
However, in saying that, we have to consider what is the most appropriate cost-of-living measure to deploy.
Inflation and cost of living measures
There is a debate as to which cost-of-living measure is the most appropriate.
The most used measure published by the Australian Bureau of Statistics (ABS) is the quarterly ‘All Groups Consumer Price Index (CPI)’.
Reflecting the need to develop a measure of ‘the price change of goods and services and its effect on living expenses of selected household types’, the ABS began publishing a new series in June 2000 – the Analytical Living Cost Indexes – which became a quarterly publication from the December-quarter 2009.
In its technical paper (published October 27, 2021) – Frequently asked questions (FAQs) about the measurement of housing in the Consumer Price Index (CPI) and Selected Living Cost Indexes (SLCIs) – the ABS note that:
The CPI and SLCIs are closely related. All these indexes measure changes in prices paid by the household sector (consumers) for a basket of goods and services provided by other sectors of the economy (e.g. Government, businesses). The weights in the ‘basket’ represent amounts of expenditure by households on goods and services bought from other sectors. Goods traded between households (like buying and selling existing houses) are excluded as both sides of the transaction occur within the household sector.
I discuss these indexes in detail in this blog post – Australia – real wages continue to decline and wage movements show RBA logic to be a ruse (August 16, 2023).
In effect, the SLCIs represent a more reliable indicator of ‘the extent to which the impact of price change varies across different groups of households in the Australian population’.
There are four separatee SLCIs compiled by the ABS:
- Employee households.
- Age pensioner households.
- Other government transfer recipient households.
- Self-funded retiree households
The most recent data – Selected Living Cost Indexes, Australia – was published by the ABS on February 7, 2024 for the December-quarter 2023.
Between the December-quarter 2022 and the December-quarter 2023, the growth in the respective SLCIs has been:
- Employee households – 6.9 per cent (down from 9.0 per cent in the September-quarter).
- Age pensioner households – 4.4 per cent (down from 5.7 per cent).
- Other government transfer recipient households – 4.8 per cent (down from 6.0 per cent).
- Self-funded retiree households – 4 per cent (down from 5.7 per cent).
The ‘All groups CPI’, by contrast, rose 4.1 per cent over the same period (as in above Table).
The following graph shows the differences between the CPI-based measure and the Employee SLCI measure which better reflects the changes in cost-of-living.
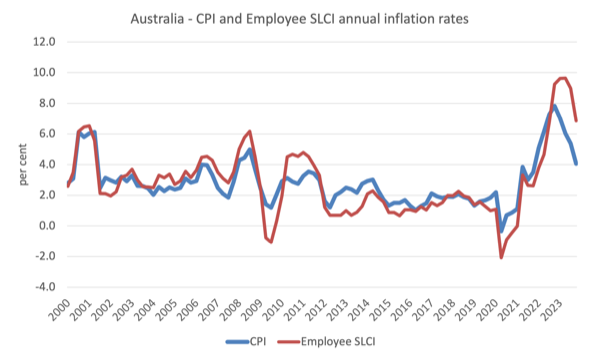
Thus, when specific household expenditure patterns are more carefully modelled, the SLCI data reveals that the cost-of-living squeeze on ‘employee households’ is more intense than is depicted by using the generic CPI data.
The ABS considers the ‘Employee households SLCI’ to be its preferred measure designed to capture cost-of-living changes more accurately for ‘households whose principal source of income is from wages and salaries’.
This puts the Treasurer’s comments in a wholly different light.
The relevant cost-of-living measure for workers has risen by 6.9 per cent over the last year while wages growth was just 4.1 per cent – a decrease in the real purchasing power of wages of 2.7 per cent.
When considered against the rise in the CPI (4.1 per cent), then the nominal wage growth of 4.2 per cent delivers a real wage rise of 0.1 points.
That will be the figure the politicians seize on.
But the reality is the former estimate using the SLCI measure of purchasing power loss.
Real wage trends in Australia
The summary data in the table above confirm that the plight of wage earners continues in Australia.
The extent of the real wage decline over the last 12 months depends on the cost-of-living measure used (see previous graph for a comparison between the CPI measure and the Employee SLCI measure).
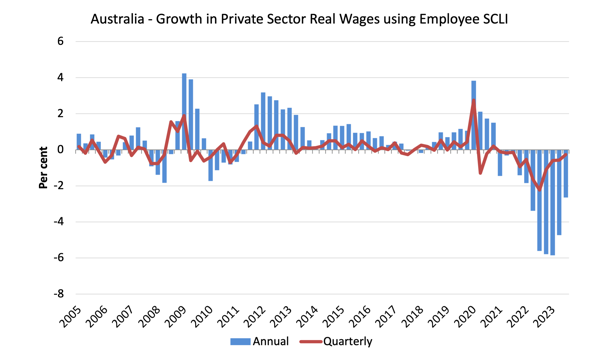
To further reinforce that point, the following graphs use the Employee SLCI measure (first graph) and the CPI (second graph) to show the movement of real wages in the private sector from 2005 to the December-quarter 2023.
In terms of the SLCI measure, there has been a dramatic drop in real wages in the economy over the last 11 quarters.
Workers in the private and public sectors have both experienced sharp declines in the purchasing power of their wages.
This is at the same time as interest rates are have risen more quickly than any time in the distant past.
The fluctuation in mid-2020 is an outlier created by the temporary government decision to offer free child care for the December-quarter which was rescinded in the December-quarter of that year.
Overall, the record since 2013 has been appalling.
Throughout most of the period since 2015, real wages growth has been negative with the exception of some partial catchup in 2018 and 2019.
The systematic real wage cuts indicate that wages have not been driving the inflationary episode.
Workers are only able to secure partial offset for the cost-of-living pressures caused by the supply-side, driven inflation.
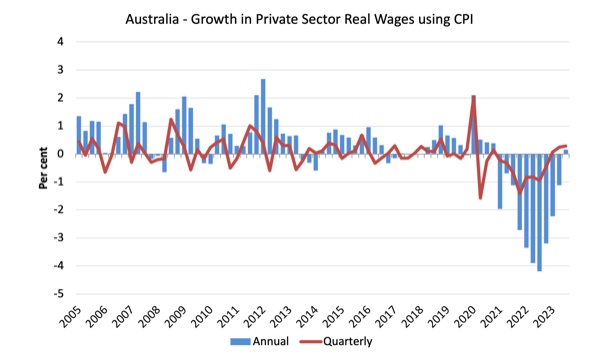
The second graph shows the real wage calculation using the CPI as the deflator.
The situation for workers is only marginally better given the CPI inflation rate is lower than the SLCI rate.
So we now see a real wage gain in the December-quarter using this measure – but note my warning above.
The great productivity rip-off continues
While the decline in real wages means that the rate of growth in nominal wages being outstripped by the inflation rate, another relationship that is important is the relationship between movements in real wages and productivity.
The RBA is now making a big deal of the fact that wages growth is too high relative to productivity growth.
Historically (up until the 1980s), rising productivity growth was shared out to workers in the form of improvements in real living standards.
In effect, productivity growth provides the ‘space’ for nominal wages to growth without promoting cost-push inflationary pressures.
There is also an equity construct that is important – if real wages are keeping pace with productivity growth then the share of wages in national income remains constant.
Further, higher rates of spending driven by the real wages growth can underpin new activity and jobs, which absorbs the workers lost to the productivity growth elsewhere in the economy.
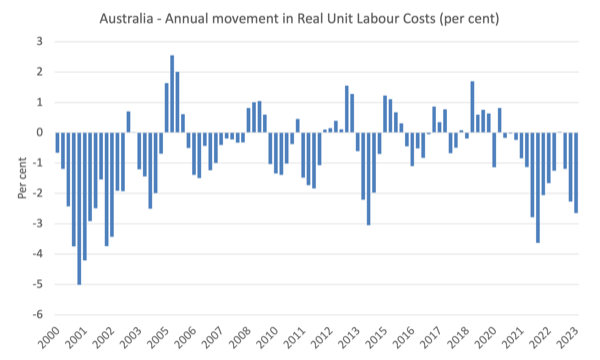
The following graph shows the annual change (per cent) in Real Unit Labour Costs from the December-quarter 1999 to the December-quarter 2023 using the CPI measure to deflate nominal wages.
I used the CPI measure because the RBA claims that is what they focus on rather than the SLCI, which is a measure of the cost of living.
Even though productivity growth has been weak or negative recently, RULCs have continued to fall, because the real wage growth has been weaker than the productivity growth (or in the current period, the fall in real wages has outstripped the fall in productivity growth).
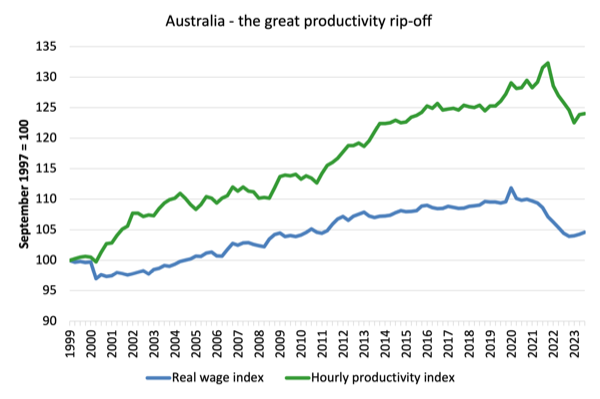
We can see that in the following graph which shows the total hourly rates of pay in the private sector in real terms deflated with the CPI (blue line) and the real GDP per hour worked (from the national accounts) (green line) from the December-quarter 1999 to the December-quarter 2023.
It doesn’t make much difference which deflator is used to adjust the nominal hourly WPI series. Nor does it matter much if we used the national accounts measure of wages.
But, over the time shown, the real hourly wage index has grown by only 4.6 per cent (and falling sharply), while the hourly productivity index has grown by 24 per cent.
So not only has real wages growth turned negative over the 18 months or so, but the gap between real wages growth and productivity growth continues to widen.
If I started the index in the early 1980s, when the gap between the two really started to open up, the gap would be much greater. Data discontinuities however prevent a concise graph of this type being provided at this stage.
For more analysis of why the gap represents a shift in national income shares and why it matters, please read the blog post – Australia – stagnant wages growth continues (August 17, 2016).
Where does the real income that the workers lose by being unable to gain real wages growth in line with productivity growth go?
Answer: Mostly to profits.
These blog posts explain all this in more technical terms:
1. Puzzle: Has real wages growth outstripped productivity growth or not? – Part 1 (November 20, 2019).
2. Puzzle: Has real wages growth outstripped productivity growth or not? – Part 2 (November 21, 2019).
Conclusion
In the December-quarter 2023, Australia’s nominal wage growth improved as the general inflation rate fell, which depending on which cost-of-living measure one uses, provided some real wage growth for workers or a lower diminution in their purchasing power cuts that have occurred over the last 11 quarters.
While most commentators will focus on the nominal wages growth relative to CPI movements, the more accurate estimate of the cost-of-lving change is the Employee Selected Living Cost Index, which is running above the CPI change.
Further with the gap between productivity growth and the declining real wages increasing, the massive redistribution of national income away from wages to profits continues.
This is no time for workers to celebrate the recent wage rises.
That is enough for today!
(c) Copyright 2024 William Mitchell. All Rights Reserved.
I don’t have much faith in any of the price’s data. My utilities usage has decreased but my bills are at least 60% higher than they were a year ago. (and yes, I shop around and change providers whenever necessary to get a better deal).
At the supermarket most prices have increased at least 20% per item.
… and so on.
I can’t imagine what it’s like for people with children and mortgages [or paying rent] in this economic climate – but I’d imagine they roll their eyes frequently listening to the inflation and prices numbers being quoted in the media.