The Australian Bureau of Statistics released the latest - Australian National Accounts: National Income, Expenditure…
US labour market – stability abounds although, worryingly, real wage gains have evaporated
Last Friday (October 6, 2023), the US Bureau of Labor Statistics (BLS) released their latest labour market data – Employment Situation Summary – September 2023 – which showed payroll employment rising by 336,000 and the unemployment rate stable, after rising 0.3 points to 3.8 per cent in August. I posed the question last month when employment growth had slowed considerably and unemployment had started to rise whether this marked a tipping point. My answer, given the extra data that resolved some of the uncertainty about last month’s data, is that I don’t think it did. In September 2023, the data suggested a very steady labour market – employment growth above the average of the last 9 months but just enough to keep pace with the labour force growth. Participation was constant as was the employent-population ratio. All signs of stability. The disturbing fact though, was the renewed failure of nominal wages growth to transalate into real wage gains for workers. The relatively modest real wage gains over the last few months as the inflation rate has declined evaporated. The question that mainstream economists need to answer is how come the significant interest rate rises have not seriously impacted the labour market performance? I know why. But their textbooks do not!
Overview for September 2023 (seasonally adjusted):
- Payroll employment increased by 336,000 (up from 187,000 last month).
- Total labour force survey employment rose by 86 thousand net (0.05 per cent).
- The labour force rose 90 thousand net (0.05 per cent) – (last month’s rise was significantly revised down as I suspected).
- The participation rate was steady at 62.8 per cent.
- Total measured unemployment rose by 5 thousand to 6,360 thousand – so employment growth essentially matched the underlying population growth.
- The official unemployment rate was stable at 3.8 per cent.
- The broad labour underutilisation measure (U6) fell 0.1 point to 7 per cent.
- The employment-population ratio was unchanged at 60.4 per cent (still well below the June 2020 peak of 61.2).
For those who are confused about the difference between the payroll (establishment) data and the household survey data you should read this blog post – US labour market is in a deplorable state – where I explain the differences in detail.
Some months the difference is small, while other months, the difference is larger.
Payroll employment trends
The BLS noted that:
Total nonfarm payroll employment rose by 336,000 in September, above the average monthly gain of 267,000 over the prior 12 months. In September, job gains occurred in leisure and hospitality; government; health care; professional, scientific, and technical services; and social assistance …
Leisure and hospitality added 96,000 jobs in September, above the average monthly gain of 61,000 over the prior 12 months. Employment in food services and drinking places … has returned to its pre-pandemic February 2020 level. Accommodation employment … remains below its February 2020 level by 217,000, or 10.3 percent.
In September, government employment increased by 73,000, above the average monthly gain of 47,000 over the prior 12 months … Employment in government is slightly below (-9,000) its February 2020 level.
Health care added 41,000 jobs in September, compared with the average monthly gain of 53,000 over the prior 12 months …
Employment in professional, scientific, and technical services increased by 29,000 in September, in line with the average monthly gain of 27,000 over the prior 12 months.
Social assistance added 25,000 jobs in September, about the same as the average monthly gain of 23,000 over the prior 12 months …
In September, employment in transportation and warehousing changed little … has shown little net change over the year.
Employment in information changed little in September …
Employment showed little change over the month in other major industries …
In summary, there is still no sign of an impending recession notwithstanding the hiccup last month.
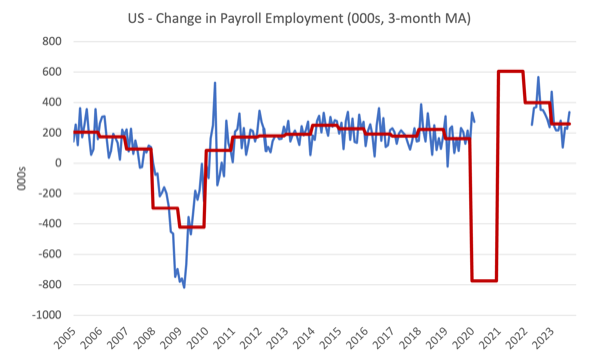
The first graph shows the monthly change in payroll employment (in thousands, expressed as a 3-month moving average to take out the monthly noise). The red lines are the annual averages. Observations between March 2020 and March 2022 were excluded as outliers.
The average line (which does not exclude the outliers) allows you to see the extent of the slowdown over the first two years of the Covid outbreak.
The next graph shows the same data in a different way – in this case the graph shows the average net monthly change in payroll employment (actual) for the calendar years from 2005 to 2023.
The red marker on the column is the current month’s result.
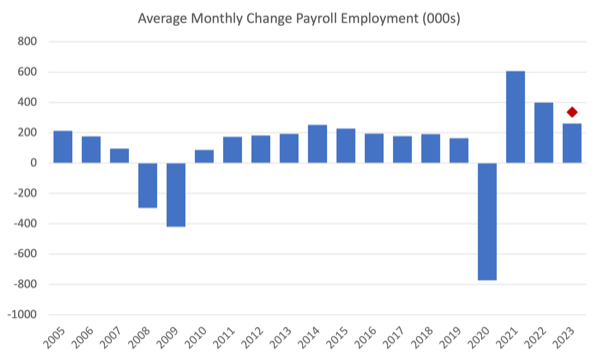
Average monthly change – 2019-2023 (000s)
| Year | Average Monthly Employment Change (000s) |
| 2019 | 163 |
| 2020 | -774 |
| 2021 | 606 |
| 2022 | 399 |
| 2023 (so far) | 260 |
Labour Force Survey data – employment growth tracking underlying population growth
The seasonally-adjusted data for September 2023 reveals:
1. Total labour force survey employment rose by 86 thousand net (0.05 per cent) – modest.
2. The labour force rose massively by 90 thousand net (0.05 per cent).
3.The participation rate was steady at 62.8 per cent.
4. As a result (in accounting terms), total measured unemployment rose by 5 thousand to 6,360 thousand – so employment growth essentially matched the underlying population growth.
5. The official unemployment rate was stable at 3.8 per cent.
It remains to be seen whether participation change is a sampling aberration. We will see next month if revisions are made.
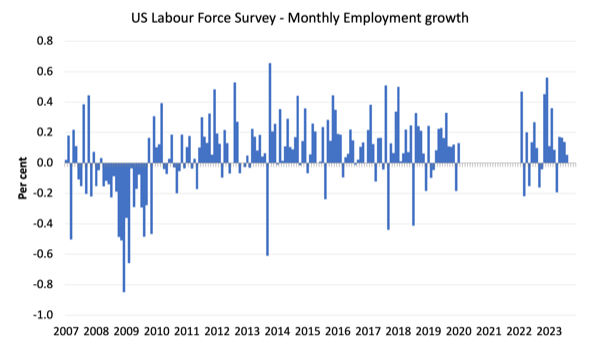
The following graph shows the monthly employment growth since January 2008 and excludes the extreme observations (outliers) between March 2020 and March 2022, which distort the current period relative to the pre-pandemic period.
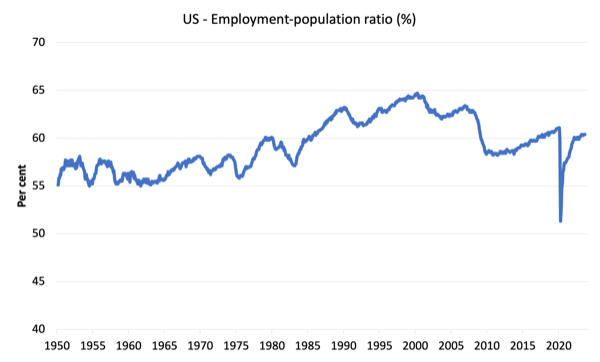
The Employment-Population ratio is a good measure of the strength of the labour market because the movements are relatively unambiguous because the denominator population is not particularly sensitive to the cycle (unlike the labour force).
The following graph shows the US Employment-Population from January 1950 to September 2023.
In September 2023, the ratio was unchanged at 60.4 per cent.
The peak level in September 2020 before the pandemic was 61.1 per cent.
Unemployment and underutilisation trends
The BLS note that:
The major labor market indicators from the survey of households showed little or no change over the month. The unemployment rate held at 3.8 percent in September, and the number of unemployed persons was essentially unchanged at 6.4 million …
The number of long-term unemployed (those jobless for 27 weeks or more) was little changed at 1.2 million in September. The long-term unemployed accounted for 19.1 percent of all unemployed persons …
The number of persons employed part time for economic reasons, at 4.1 million, changed little in September. These individuals, who would have preferred full-time employment, were working part time because their hours had been reduced or they were unable to find full-time jobs.
So the rise in unemployment last month, which was largely a result of a surge in the labour force participation rate, appears to have been an anomaly and not part of a deteriorating trend.
The first graph shows the official unemployment rate since January 1994.
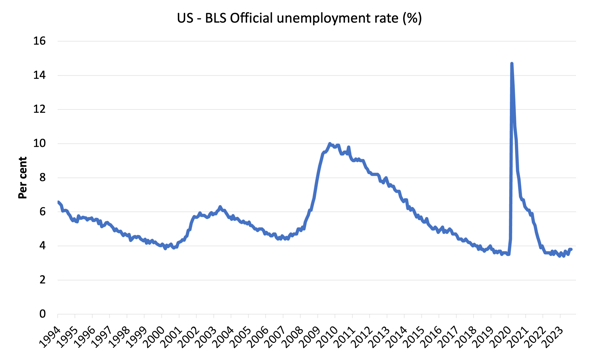
The official unemployment rate is a narrow measure of labour wastage, which means that a strict comparison with the 1960s, for example, in terms of how tight the labour market, has to take into account broader measures of labour underutilisation.
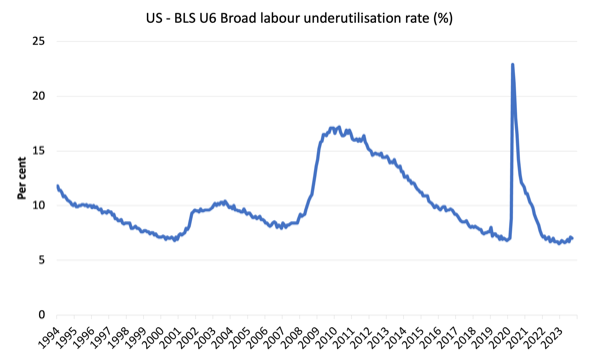
The next graph shows the BLS measure U6, which is defined as:
Total unemployed, plus all marginally attached workers plus total employed part time for economic reasons, as a percent of all civilian labor force plus all marginally attached workers.
It is thus the broadest quantitative measure of labour underutilisation that the BLS publish.
Pre-COVID, U6 was at 6.8 per cent (January 2019).
In September 2023 the U6 measure was 7 per cent down 0.1 point.
What about wages growth in the US?
The BLS reported that:
In September, average hourly earnings for all employees on private nonfarm payrolls rose by 7 cents, or 0.2 percent, to $33.88. Over the past 12 months, average hourly earnings have increased by 4.2 percent. In September, average hourly earnings of private-sector production and nonsupervisory employees rose by 6 cents, or 0.2 percent, to $29.06.
So not wages breakout emerging!
And more to the point real wages are falling again.
The latest – BLS Real Earnings Summary – August 2023 (published September 13, 2023) – tells us that:
Real average hourly earnings for all employees decreased 0.5 percent from July to August, seasonally adjusted … This result stems from an increase of 0.2 percent in average hourly earnings combined with an increase of 0.6 percent in the Consumer Price Index for All Urban Consumers (CPI-U).
Real average weekly earnings decreased 0.1 percent over the month due to the change in real average hourly earnings combined with a 0.3-percent increase in the average workweek.
Real average hourly earnings increased 0.5 percent, seasonally adjusted, from August 2022 to August 2023.
So even with moderating inflation, nominal wages growth is so low that the real wage gains of the lst few months have evaporated.
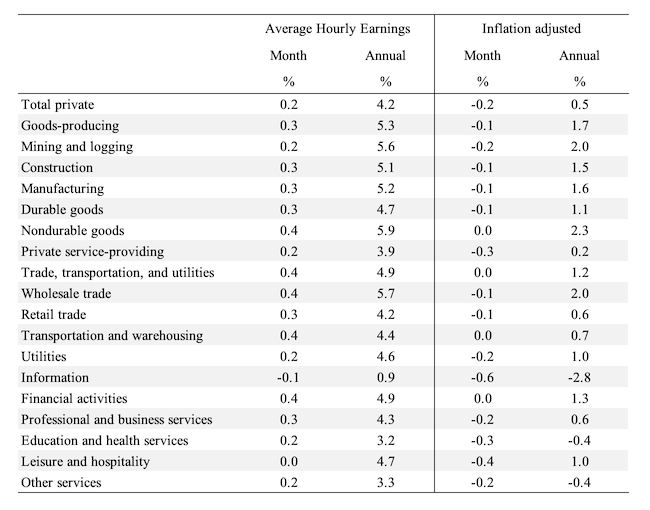
The following table shows the movements in nominal Average Hourly Earnings (AHE) by sector and the inflation-adjusted AHE by sector for September 2023 (note we are adjusting using the August CPI – the latest available).
The nominal wages slowdown has impacted on most sectors.
The following graph shows annual growth in real average hourly earnings from 2008 to September 2023.
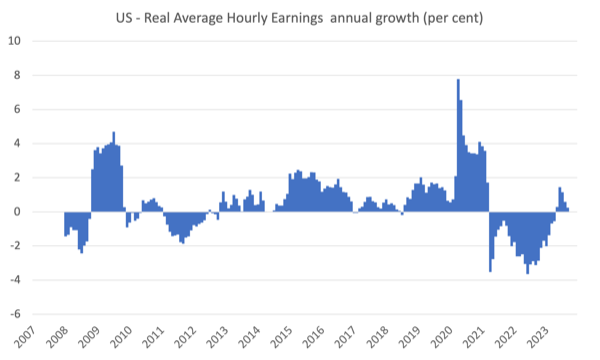
So the brief period of modest real wage gains after the long period of real wage cuts appears to have ended!
The other indicator that tells us whether the labour market is turning in favour of workers is the quit rate.
The most recent BLS data – Job Openings and Labor Turnover Summary (released October 3, 2023) – shows that:
The number of job openings increased to 9.6 million on the last business day of August … Over the month, the number of hires and total separations changed little at 5.9 million and 5.7 million, respectively. Within separations, quits (3.6 million) and layoffs and discharges (1.7 million) changed little. …
In August, the number of quits changed little at 3.6 million and the rate was unchanged at 2.3 percent.
So in August 2023, the dynamics of the US labour market were pretty stable.
Conclusion
Last month’s relatively poor performance does not appear to have marked the start of a deteriorating trend.
In September 2023, the latest US labour market data suggested a very steady labour market – employment growth above the average of the last 9 months but just enough to keep pace with the labour force growth.
Participation was constant as was the employment-population ratio.
All signs of stability.
The disturbing fact though, was the renewed failure of nominal wages growth to translate into real wage gains for workers. The relatively modest real wage gains over the last few months as the inflation rate has declined evaporated.
That is enough for today!
(c) Copyright 2023 William Mitchell. All Rights Reserved.
This Post Has 0 Comments