The Australian Bureau of Statistics released the latest - Australian National Accounts: National Income, Expenditure…
Australian labour market – rebound after weak month but 10 per cent of available and willing labour remain idle
The Australian Bureau of Statistics (ABS) released of the latest labour force data today (June 15, 2023) – Labour Force, Australia – for May 2023. The May result reverses two consecutive months of weaker results from the Labour Force survey. Employment rose by 75.9 thousand (a strong monthly result), participation rose by 0.1 point to a record high, and unemployment fell by 16,500. But one month is not a trend and it should be emphasised that there are 10 per cent of the available and willing working age population who are being wasted in one way or another – either unemployed or underemployed. That extent of idle labour means Australia is not really close to full employment despite the claims by the mainstream commentators. I am waiting for the RBA governor to claim the fall in the unemployment rate justifies further interest rate increases. It doesn’t but since when has logic and facts got in the road of his agenda.
The summary ABS Labour Force (seasonally adjusted) estimates for May 2023 are:
- Employment rose by 75,900 (0.5 per cent) – full-time employment rose by 61,700 and part-time employment increased by 14,300.
- Unemployment fell 16,500 to 515,900 persons.
- The official unemployment rate fell by 0.1 point to 3.6 per cent.
- The participation rate rose 0.1 point to 66.9 per cent.
- The employment-population ratio rose by 0.2 points to 64.5 per cent.
- Aggregate monthly hours fell 36 million hours (-1.8 per cent).
- Underemployment rose 0.3 points to 6.4 per cent (a rise of 45.2 thousand). Overall there are 936.6 thousand underemployed workers. The total labour underutilisation rate (unemployment plus underemployment) rose by 0.2 points to 10 per cent. There were a total of 1,452.5 thousand workers either unemployed or underemployed.
In its – Media Release – the ABS noted that:
… The unemployment rate fell 0.1 percentage point to 3.6 per cent in May (seasonally adjusted) …
The strong growth in employment in May followed a small decrease in April, around Easter, when employment fell by more than it usually would over the holiday period …
Looking over the past two months, the employment increases average out to around 36,000 extra employed people each month. This is still around the average over the past year of 39,000 people a month.
Conclusion: Following a relatively weak month in April, the May data shows a strengthening situation.
Employment rose by 75,900 (0.5 per cent) in May 2023
1. Full-time employment rose by 61,700 and part-time employment increased by 14,300.
2. The employment-population ratio rose by 0.2 points to 64.5 per cent, which is a record high.
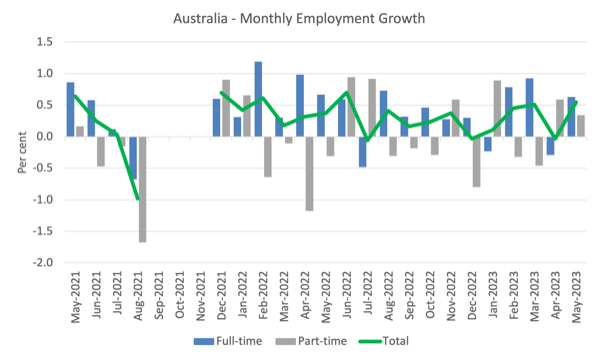
The following graph shows the month by month growth in full-time (blue columns), part-time (grey columns) and total employment (green line) for the 24 months to May 2023 using seasonally adjusted data.
I took out the observations from September to January 2021 – they were outliers due to the Covid wave at that time.
The following table provides an accounting summary of the labour market performance over the last six months to provide a longer perspective that cuts through the monthly variability and provides a better assessment of the trends.

Given the variation in the labour force estimates, it is sometimes useful to examine the Employment-to-Population ratio (%) because the underlying population estimates (denominator) are less cyclical and subject to variation than the labour force estimates. This is an alternative measure of the robustness of activity to the unemployment rate, which is sensitive to those labour force swings.
The following graph shows the Employment-to-Population ratio, since January 2008 (that is, since the GFC).
The ratio ratio rose by 0.2 points to 64.5 per cent in May 2023, which is a record high.

For perspective, the following graph shows the average monthly employment change for the calendar years from 1980 to 2022 (to date).
1. The average employment change over 2020 was -8.9 thousand which rose to 36.3 thousand in 2021 as the lockdowns eased.
2. For 2022, the average monthly change was 40.3 thousand.
3. So far, in 2023, the average change is 44 thousand and rising.

The following graph shows the average monthly changes in Full-time and Part-time employment (lower panel) in thousands since 1980.

Hours worked fell by 36 million hours (-1.8 per cent) in May 2023
The following graph shows the monthly growth (in per cent) over the last 24 months.
The dark linear line is a simple regression trend of the monthly change (skewed upwards by the couple of outlier results).

Actual and Trend Employment
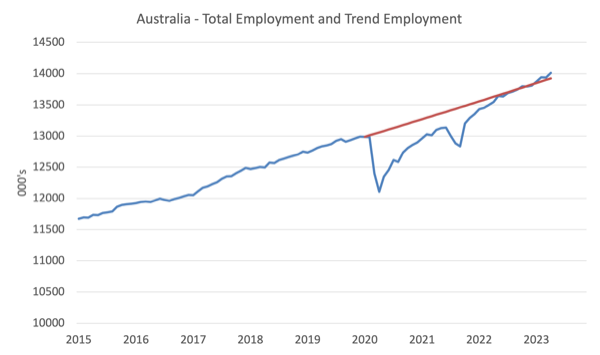
The Australian labour market is now larger than it was in March 2020 and employment has now exceeded the pre-pandemic trend.
The following graph shows total employment (blue line) and what employment would have been if it had continued to grow according to the average growth rate between 2015 and April 2020.
The Population Slowdown – the ‘What-if’ unemployment analysis
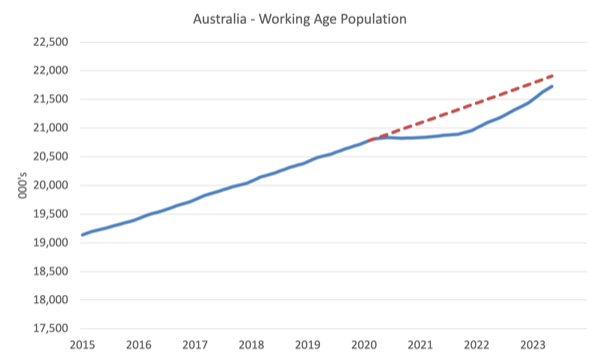
The following graph shows Australia’s working age population (Over 15 year olds) from January 2015 to May 2023. The dotted line is the projected growth had the pre-pandemic trend continued.
The difference between the lines is the decline in the working age population that followed the Covid restrictions on immigration.
The civilian population is 179.1 thousand less in May 2023 than it would have been had pre-Covid trends continued.
The following graph shows the evolution of the actual unemployment rate since January 1980 to May 2023 and the dotted line is the ‘What-if’ rate, which is calculated by assuming the most recent peak participation rate (recorded at May 2023 = 66.9 per cent), the extrapolated working age population (based on growth rate between 2015 and March 2020) and the actual employment since March 2020.
It shows what the unemployment rate would have been given the actual employment growth had the working age population trajectory followed the past trends.
In this blog post – External border closures in Australia reduced the unemployment rate by around 2.7 points (April 28, 2022), I provided detailed analysis of how I calculated the ‘What-if’ unemployment rate.
So instead of the current unemployment rate of 3.6 per cent, the rate would have been 4.2 per cent in May 2023, given the employment performance since the pandemic.

Unemployment fell 16,500 to 515,900 persons in May 2023
A reversal on last month’s relatively poor result – employment growth strong and more than absorbing the labour force growth, which was driven by the underlying working age population growth and the increase in the participation rate.
All good outcomes.
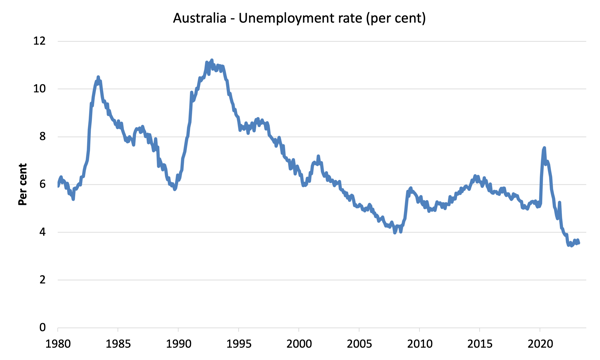
The following graph shows the national unemployment rate from January 1980 to May 2023. The longer time-series helps frame some perspective to what is happening at present.
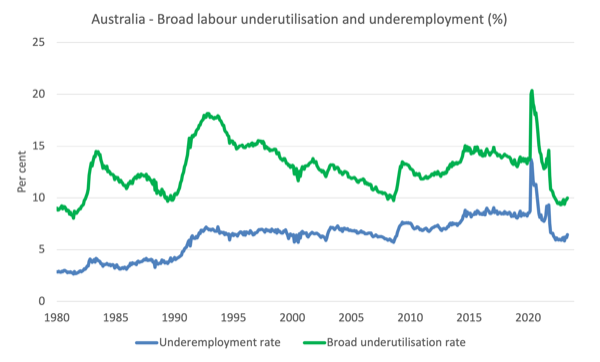
Broad labour underutilisation rises 0.2 points to 10 per cent in May 2023
1. Underemployment rose 0.3 points to 6.4 per cent (a rise of 45.2 thousand).
2. Overall there are 936.6 thousand underemployed workers.
3. The total labour underutilisation rate (unemployment plus underemployment) rose by 0.2 points to 10 per cent.
4. There were a total of 1,452.5 thousand workers either unemployed or underemployed.
The following graph plots the seasonally-adjusted underemployment rate in Australia from April 1980 to the May 2023 (blue line) and the broad underutilisation rate over the same period (green line).
The difference between the two lines is the unemployment rate.
Teenage labour market sheds full-time employment in May 2023
Teenagers gained 8.8 thousand net jobs in April with full-time jobs falling by 0.9 thousand and part-time rising by 9.7 thousand.
The following Table shows the distribution of net employment creation in the last month and the last 12 months by full-time/part-time status and age/gender category (15-19 year olds and the rest).

To put the teenage employment situation in a scale context (relative to their size in the population) the following graph shows the Employment-Population ratios for males, females and total 15-19 year olds since June 2008.
You can interpret this graph as depicting the change in employment relative to the underlying population of each cohort.
In terms of the recent dynamics:
1. The male ratio rose 0.6 points over the month.
2. The female ratio rose 0.2 points.
3. The overall teenage employment-population ratio rose by 0.4 points over the month.

Conclusion
My standard monthly warning: we always have to be careful interpreting month to month movements given the way the Labour Force Survey is constructed and implemented.
My overall assessment is:
1. The May data reverses two consecutive months of weaker results from the Labour Force survey.
2. Employment rose by 75.9 thousand (a strong monthly result), participation rose by 0.1 point to a record high, and unemployment fell by 16,500.
3. But one month is not a trend and it should be emphasised that there are 10 per cent of the available and willing working age population who are being wasted in one way or another – either unemployed or underemployed.
4. That extent of idle labour means Australia is not really close to full employment despite the claims by the mainstream commentators.
That is enough for today!
(c) Copyright 2023 William Mitchell. All Rights Reserved.
The insanity of mainstream economic orthodoxy on display:
From a financial press headline today:
“Australia May employment blows past expectations, piling pressure on RBA.”
ie, because unemployment fell from 3.7% to 3.6% – a good thing – the RBA must reverse it…..the ‘Reverse Bank’, indeed….
Central banks cannot control employment levels. There is no Phillips curve-style relationship between interest rates and employment (not even in the short run). The data over the last year make clear the central bank impotence with respect to employment (and the impotence was clear previously).
Can central banks squeeze issuers of floating-rate debt (banks, junk bond issuers, and others who borrow at floating rates)? Yes. But squeezing issuers of floating-rate debt (businesses and households) has no direct effect on employment levels.
Looking at the figures, is there any reason why employment cannot be increasing while livelihoods are racing to the bottom due to stagnant wages versus increasing costs, particularly where increasing overhead costs have to be met for maintenance of a socially acceptable level of existence? A headline aggregate employment number/percentage or increase doesn’t say anything meaningful about the spread of income across the participants. Economists aren’t interested in wealth-income spread in society or its social consequences but only aggregate numbers as the basis for decision making. When all you have is a hammer, every problem is a nail.
Isn’t the analytical relevance of employment/unemployment data akin to using GDP as a meaningful metric, even though the latter says nothing about the distribution of wealth (who is benefiting) within the relevant society? The boiling frog syndrome looks an appropriate metaphor for the mode of wealth transference underway from the bottom to the top, as inflicted by the Australian Government through the agency of its wholly owned bank as the chef, where decision making is based on an aggregate. All driven by a false economic theology, but that is only so if it is intended to be concerned with maintaining or improving social equity.
What the hell is our government doing to its citizens and why are they doing it? Because the neoclassical theology says that to fix things (i.e. “discipline” labor being the only game in town) an unemployment level of 4.5% must be achieved (so that capital retains its supremacy over labour) and if we have to cause a recession to get there then so be it. Another “recession we had to have” in the offing. Neoliberals to the right and neoliberals to the left.
Today’s capitalism’s failings are again in your face visible as the financialisation of everything acts precisely as intended. How many more times can the majority go through the cycle without an FDR to save capitalism from itself? Can’t see any saviour of capitalism from where I’m observing the polycrisis that we’re living through. Perhaps the US will confect a major war to stoke some military Keynesianism – it’s certainly trying to. There is already a man-made war on our hands with ecological overshoot, primarily driven by intense and wasteful energy usage from concentrated sunlight in the form of fossil fuels. Such energy use has been without regard to the effects of pollutants from that use on our home in space. The war is here but private capital is not geared up to deal with it or been forced to by governments. Those vested interests remain aided and abetted by captured governments and we will all pay the price.
That the economy is a dynamic system with multiple variable interactions effecting outcomes is something that is totally alien to the thoughts, belief systems and models of orthodox economists. Also, the ignore of externalities and a failure to understand that the sustainable ecological limits of our planet are of the essence for the practice of real world economics continues to power the orthodoxy. Citizens sense that something is seriously wrong with our economic system but fail to seek the knowledge to understand and analyse same – just too busy on the mousewheel trying to remain solvent, which perfectly suits those running things for the benefit of capital. I’m sick of hearing lay people say “I’m not an economist” and thereby defer to the flawed economic priesthood for answers.